
Problems of Technical Analysis Revisited
Introduction
At present, technical analysis along with the fundamental one is the most important method to analyze stock market. In Russia, it is used by the most of traders. We can even state that knowledge of at least basics of technical analysis is a kind of "entrance ticket" to the market: This is not a place for anybody without this.
Being one of the predicting methods of stock market pricing dynamics, the technical
analysis has a large amount of disadvantages that cast some doubt on its practical
applicability.
NB: I have been using technical analysis since 1996. I have tried and tested a huge amount of indicators on real data during this period. The conclusion is not encouraging: In many cases, the market behavior is opposite to all predictions. There are so many studies and published works on this topic that I wouldn't like to repeat them here.
The followers of technical analysis ought this to the following: "Technical analysis requires high analytical qualification. Being used properly, it helps to achieve really good results. So the matter is not in any problems in technical analysis itself. The problem is in its proper use".
However, in my opinion, the problem is rooted in that technical analysis as a method
of analyzing and predicting the market pricing dynamics has some inherent defects
located in its fundamental postulates and in its ideology itself.
NB: All errors are rooted in technical analysts' aspiration to analyze the chart but
not the market.
It recurs to me the following ancient Chinese parable:
– Can one talk riddles to people? Baigun asked Confucius, but the latter said nothing.
– What will happen if a riddle will be like a stone thrown into a river? Baigun asked.
– There are very good divers in the Kingdom of Wu, they will fish it out, Confucius answered.
– And what happens if a riddle is like water poured into the water?
– They mixed water from rivers Tze and Shan. However, cook Yi Ya tasted it and distinguished which is which.
– Do you mean that one should not talk riddles?
– Why not? However, does the speaker himself understand the meaning of words? Those who understand the meaning of words won't speak in words. Fisher's clothes gets wet, hunter's feet get tired, but not for pleasure. Since true words are without wording, a true act is inactivity. After all, everything the perfunctory persons are arguing about is so insignificant!
Having got no change out of the Master, Baigun died in the bath.
The market talks riddles with people. A chart is words, wet clothes, sore feet. We need to get to the bottom - how many quails did the hunter get down, how many fish did the fisher hook? The list of chartists "died in the bath" will probably be rather long.
Having found an object in the chart, an analyst hastens to exclaim: "The market turns its direction since I see the object in the chart!". However, one should act differently. Having observed something in the chart, one has to ask him or herself: "What process happening in the market caused appearance of this graphical object in the chart? Will this process result in a turn or just in some correction?"
Neglecting the essential contents of processes that take place in the market resulted
in the worst mistakes in further development of technical analysis.
Mistake 1
The same indicators are used to analyze very different markets: for instance, stock market and bond market, Forex and commodity market. In some cases, this approach is authorized by the situation: A "false bottom" is a "false bottom" everywhere. However, it is frequently not the case. This results in errors.
The above-mentioned markets differ from each other through not only morphology and trading particularities, but also even through their... chart shapes! It is fair to say that this difference can be noticed by professionals only. It looks the same for newbies. Below are some charts illustrating my point. Classical Russian companies are shown in Fig. 1-1 and 1-2: LUKOIL and Russian Unified Electrical Company for one year.
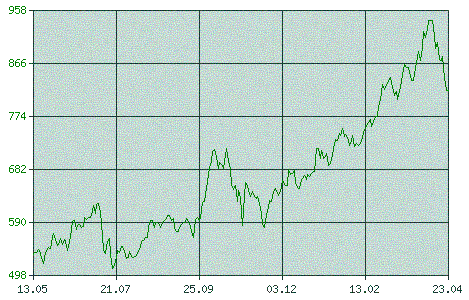
Fig. 1-1. LUKOIL, MICEX, May 2003 - May 2004.
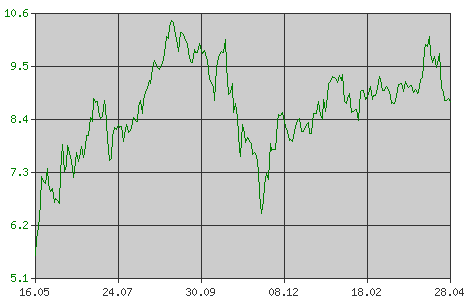
Fig. 1-2. Russian Unified Electrical Company, MICEX, May 2003 - May 2004.
The following is typical for a chart of the secondary market: short rollbacks when
the price grows and long ones when it falls, relatively small range of prices in
bands, sometimes rather long periods of quiet after growth. Market ups and downs
occur rather rarely, this usually takes place when the market goes from falling
to growth. Alternation of active movements periods with rollbacks and classical
trend fragments. Stock market usually grows slowly and falls rapidly.
In Fig. 1-3 – 1-6, some commodity market charts are given. The following is typical for them: explicit trend structure, sudden hitches (for example, in Fig. 1-5), considerable breaks, sudden changes in direction of price movements during strong hitches, fairly wide ranges. The periods of growth and falling are approximately of the same length in a commodity market; it even happens so that it, unlike the stock market, grows fast and falls slowly (see Fig. 1-6).
I consider every market type to have its own typical portrait. This idea needs to be developed. There are still preliminary considerations.
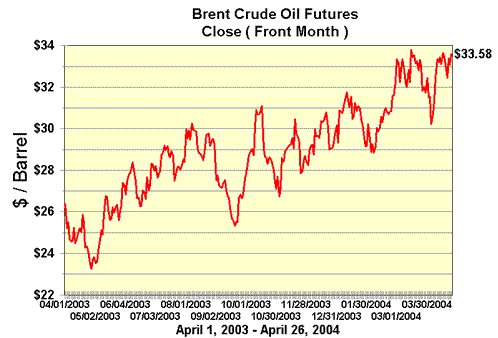
Fig. 1-3. Futures for Brent Oil.
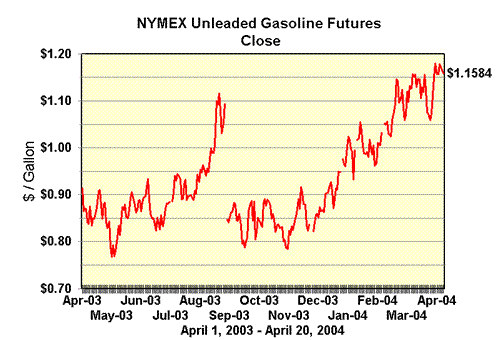
Fig. 1-4. Petroleum Futures.
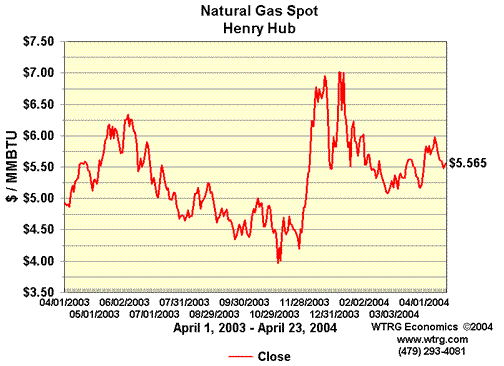
Fig. 1-5. Natural Gas. Spot.
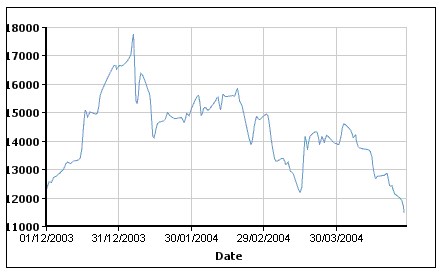
Fig. 1-6. Nickel Cash. LME.
Unfortunately, the idea has not been developed in technical analysis. (I may be mistaken, of course. It would
be interesting to know about other specialists' opinions: Have they ever come across any works on technical analysis
where the matter of different chart shapes for different markets is considered?) FOREX stands apart here. Its
charts have many characteristics resembling those of “commodities” and “stocks”. Generally speaking,
I have very little knowledge of FOREX, so I won't write much about it.
NB: I think that one of the ways for the technical analysis to develop must be differentiation
by types of markets under research.
Mistake 2
Researchers cannot understand the nature of the market. Some of them consider this to be a natural, not an artificially created object. This complex of difficulties and errors caused a huge amount of incorrect prediction techniques. Researchers tried to find a perfect ordering where it does not exist at all and cannot exist. For example, Elliot Waves and Fibonacci Sequence. On the other hand, some of them tried to apply to the market analysis the chaos theory and the fractal geometry, both not relating to the market in any way since they describe absolutely different objects.
"Mandelbrot discovered that fractal changes of rivers are similar to the same structures of commodity markets which is the evidence that markets are more a natural function than a process created by human left hemisphere, " (Bill Williams. Trading Chaos, page 64) – the logical fallacy of inference is present: sometimes even very different systems produce outwardly similar appearances (we can remember about protective horning and spines in animals: these means of protection occurred in both dinosaurs and mammals at different times, with the interval of dozens of millions of years). In order not to overcharge my reasoning, I put my thoughts about Elliot Wave Theory, Fibonacci numbers, and fractal geometry in the end of my article, in the "Particularities" section.
Analysts use terms, such as "energy", "bull power", "bear power" and others, to describe markets. The market, for such analysts, can "fall", "jump back", "move by inertia", it can be "pushed", "bucked up" and "braked". MACD, for example, "… directs the way like car headlamps" (A. Elder). We can also quote Bill Williams: "Energy always follows the path of least effort. The market resembles a river… Since a river flows down, its behavior is determined by the choice of the path of least effort." In this connection, I recall one of my acquaintances who recommended everybody to eat hemp seeds. He argued in favor of his idea as follows. Parrots, he said, eat hemp and can live up to 300 years. If a human eats hemp, he or she will live 300 years, too.
NB: A theory must be developed that would describe markets (stock, commodity, forex)
as they are, with all their peculiarities that cannot be reduced to purely natural,
psychological or financial laws. It must be admitted that any organized (stock)
market is a sophisticated system that exists and develops under its own laws.
Lack of clarity over the real nature and morphology of stock markets produced difficulties in defining of reasons for which the market grows or falls. Apart from mysterious "bull powers", "bear powers" and "potential market energy", it is often discussed about "crowd emotions" and "mass psychological structuring". My opinion about this topic can also be read at the end of this article.
If the market nature is considered more closely, one may find out much interesting. A certain set of factors is effective for every market type. For second stock market, it is flow of capital. For commodity market, it is demand/supply balance shifts plus flow of risk capital, and so on.
Generally, this topic needs a special research. I have done something in this field, but I consider it at the end of the article.
The second and the third mistakes produced difficulties with proper interpretation of volume. Indeed, if we have not yet caught the point about the nature of market processes reflected in charts, what can we say about any proper interpretation of volume? Books on technical analysis contain everything but the proper interpretation of volume. Authors usually don't go further than to state something like "volume direction confirms the trend" or "volume changes precede price changes" (Joseph Granville). Indicators created on the volume basis are just terrible. It is sufficient to think of the classical On Balance Volume (OBV) or Elder's Force Index (FI). By the way, as to the latter indicator: It is not clear at all what is the sense of multiplying volume by price difference. My school maths teacher said that lamps multiplied by oranges make something like "loranges", not any real things. This is exactly the case.
We can solve a simple problem. Dick, Harry and Tom have two apples each. How many
apples do they have together? Solution:
3 * 2 = 6
Everything is clear and logical in this problem. It can be easily understood the
sense of multiplying of the amount of children by the amount of apples. However,
there are other problems that are quite different. How much does one kilo of nails
if hearts are trump? Or: What will we get if we multiply price difference by volume?
Mistake 3
Taking undue freedoms with time.For some reason, technical analysts skip weekends and public holidays when drawing charts. As a result of such loose time treatment, the charts are often distorted. Some at least disputable methods occur, too. Tic-tac-toe-like ones, for example.
The technique to construct angles in the chart (for example, Gann's Angles) should be considered specifically. What does angle of 45° mean? Tangent of this angle must be one, mustn't it? In practice, it means that price/time = 1. It means, say, that one ruble corresponds with one day. If my ruble is equal to two days, the angle will be 26.57°. This is arctg(0.5), see Fig. 1-7 for this. This example shows us that if time scale increases 2 times, the angle will decrease 1.69 times. We will observe the same effect if we increase price scale 2 times. The angle will then be equal to 63.43°.
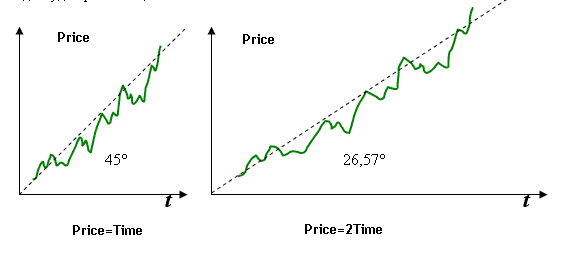
Fig. 1-7. Gann's Angles in Different Scaling.
Neglecting the time matters may also lead to that researchers forget at all about in what coordinates they operate - from this point of view, the following citation from A. Elder's Study Guide for Trading for a Living is typical:
"There are several techniques for projecting how far a breakout is likely to go. what will follow the rectangle. Measure the height of a rectangle and project it from the broken wall in the direction of the breakout. This is the minimum target. The maximum target is obtained by taking the length of the rectangle and projecting it vertically ifrom the broken wall in the direction of the breakout (italics mine – K.Ts.)".
Please note the phrase in italics – it's a full absurd. The length of a rectangle in the chart is measured in time terms (days, weeks), so plotting these values on the price axis is nonsense. In order to visualize the mistake made by the author of that recommendation, let's look at Fig. 1-8 showing the same chart in different time scales (the time scaling of the right picture is two times larger):
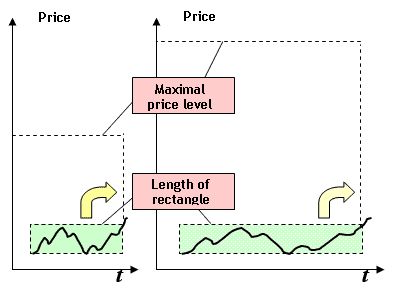
Fig. 1-8. Prediction of the maximal price level when breached from the rectangle according to Elder.
In the second case, the maximal predicted level turns to be two times higher whereas we took the same rectangle. Either, the reviewed technique does not answer the question why it is the maximal price level that must be found in that place, not in another.
NB: To eliminate such errors, it is necessary to show time in the chart properly.
V.I. Yeliseev is mathematician by training (see at www.maths.ru). He invented his own, original system of graphical analysis of stock markets. If all "normal" analysts place price movement in horizontal coordinates plotting time on X-line and price on Y-line, Mr Yeliseev uses a circular graph with the only one axis. His time circles and price is plotted on the axis (see Fig. 1-9):
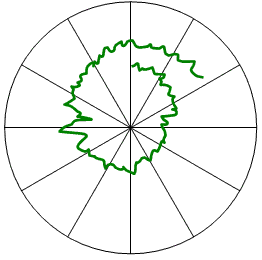
Fig. 1-9. Price chart in V.I, Yeliseev's coordinates
The circle is divided into twelve sectors for one month each. The price makes complete revolution within the year
– well, everything turns full circle. The price chart resembles the spiral. This is just one example of nonstandard
approach, nothing else. I hesitate to make the flat assertion that this method is correct.
Talking about time makes me recall one more Achilles' heel of technical analysis: It is the time parameter in indicators. Indeed, let's imagine that we construct an average. For how many days? For twenty five? But why twenty five namely? Do we play on RSI signals? Ok! Within how many days do we build this indicator? Five? Too smart? Fourteen? But why fourteen?
Unfortunately, "the great" ones cannot say anything about this, except for: "choose the time parameter that work best on the studied pooled data in the past. If, for some reasons, the indicator with the chosen time parameter stopped working effectively, choose another value for the parameter". It means that they just tell us: "fit the method for the result until you satisfied (it is just good that not the result for the method)".
NB: It is necessary to develop such indicators that don't depend on time parameters
or that use such parameters that would be displayed on clear, scientifically grounded
algorithms.
Mistake 4
The logical consequence of the topic of how to show time in charts is the topic of how to represent price and volume, as well as a larger topic of composition and representation of trade data.The circular graph of V.I. Yeliseev given above is one of attempts to bust stereotypes that have firmed up for many dozens of years of the technical analysis evolution.
Indeed, why do we build a chart basing on open, high, low and close prices? Why don't we consider mean values? I came across an approximate average calculation by an American author:
max + min
----------------
2
… and this is in the days of Pentiums. I think the matter is as follows. At the time stocks started to publish quotes tables and analysts started to chart on them, it was technically very difficult to calculate averages, particularly the weight-average, for trade volumes: It took them several hours of hard work (imagine that there have been performed some thousands of trades). Stock traders decided: Get along with this average... So it has disappeared since that. At present, the calculating of average takes centiseconds, even milliseconds. So why not to introduce this measure into charting of trades?
Western analysts have used awkward bar charts for dozens of years pretending nothing better can be done. And only in early 90s, when the famous S. Nison's book was published, they discovered Japanese Candlesticks for themselves. Question: Perhaps, it would be better to care of chart appearance instead of inventing many intricate indicators?
Mistake 5
Why do we all construct only straight trend lines?In many cases, however, movements of highs and lows are approximated by a curve! The matter here seems to be in
that building of straight trend lines is easy even for a schoolchild, whereas it is rather difficult to construct
curves. The latter needs knowledge of higher mathematics, which is often a weak point of many chartists (there
is still one more way: study features of MS Excel…).
Mistake 6
The undue concentration of technical analysts on intraday events is astonishing:"If the price breaks this level, then …","the volume was extreme today, this means that...", etc. In my opinion, this point of view is wrong. Trends do not develop within one day, though one can always find extremums in the chart. In the most cases, the trend turns are caused by global market movements that have rather extended in time. Only rarely the market is turned by a force majeure.
Take, for example, the turn model of "dark-cloud cover" (see Fig. 1-10):
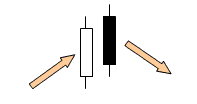
Fig. 1-10. Dark-Cloud Cover Model.
This is what Gregory Morris writes about this model in his book Candlestick Charting Explained: Timeless Techniques for Trading Stocks and Futures (1995):
"Uptrend prevails in the market. The long white candle is formed that is typical for the uptrend. When opening the next day, it breaks up. However, the uptrend may stop at that. The market falls in order to close within the body of the white day, practically under its middle. All bullish traders should revise their strategy under these circumstances. Like in case of a piercing candle, an important market turn occurs."
It is absolutely not clear from the above explanation why it is this model that is considered as turn model, as well as why "all bullish traders should revise their strategy under these circumstances." You should know that for many buyers, a strong downtrend shown as a black candle is a good point to buy. In such conditions, the "important market turn" may never occur next day. So why did Japanese analysts observed, in most cases, trend change after the "dark-cloud cover" had appeared?
This was caused by that large traders from the market. As soon as they started to leave the market, this caused appearance of the dark-cloud cover. These are traders that expand the market, not chart properties.
Mistake 7
About turns, by the way. Why do many young and unexperienced traders fall short? It is through their inability to distinguish a real turn from an imaginary one.For justice' sake, it must be noted that when prices reach extremums, practically nobody understands that this is the extremum. It is normally understood later, one or one and a half years later. In Fig. 1-11, a typical bearish divergence between RSI and prices in the second stock market is given.
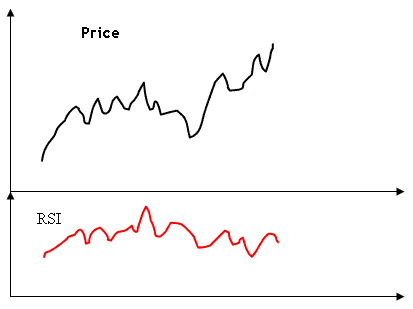
Fig. 1-11. Divergence between RSI and prices in the second stock market.
A. Elder writes in this concern: "Bearish divergences give sell signals. They occur when prices rally to a new peak but RSI makes a lower top than during the previous rally. Sell short as soon as RSI turns down from its second top, and place a protective stop above the latest minor high. Sell signals are especially strong if the first RSI top is above its upper reference line and the second top is below it."
This situation occurs very often before prices rally. Our traders will close by stop (if the market does not become illiquid). Possible development of the situation is shown in Fig. 1-12.
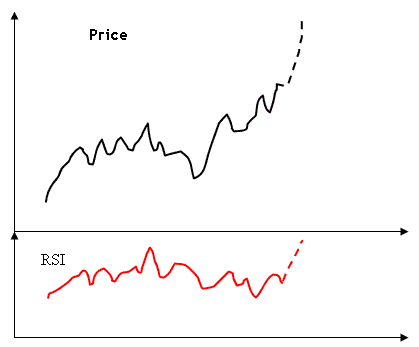
Fig. 1-12. Price rallies after divergence.
We can also complain of difficulties in recognizing the shapes in the chart within
this topic. However, this is not so bad.
Particularities
Elliot Waves and Fibonacci Numbers
Watching price charts is so interesting and exciting that it sometimes attracts people who seem to be far removed from the market. R.N. Elliot, a modest American accountant who lived at the end of the 19th - the first half of the 20th century, devoted his all his spare time to the chart analysis. He tried to find a magic formula, a kind of a magic key for the market, that would allow one to make rather reliable forecasts. It must be said that there are still many "philosophers' stone" seekers among traders. This seems to be very human to try and find some hidden order in the chaos. Well, having spent many years on search, Elliot concluded that, as it seemed to him, there had been a mysterious structure reigning the market. However, Elliot did not precise what a structure it was and what the nature of that structure was. But he deduced a principle, or a law if you want, that had subordinated the price movements. These are so-called "Elliot Waves" (see Fig. 1-13):
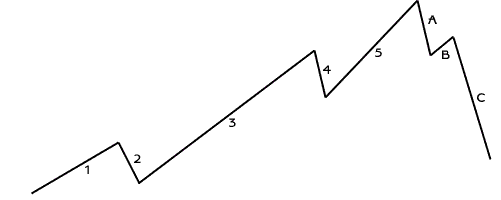
Fig. 1-13. Elliot Waves. Source: www.finbridge.ru.
According to Elliot, the uptrend consists of five waves, whereas the downtrend has three waves. Growth and falling are periodically replaced by corrections. Wave parameters in the Elliot's model are interrelated through smart mathematical ratios. For example, price levels reached at the end of the first and the second wave are interrelated through the "golden section" (see Fig. 1-14):

Fig. 1-14. Golden Section in Elliot Waves
At the same time, many Elliot's followers insist that this ratio may be different, like 0.5 or 0.667 (2/3). By
the way, the "golden section" is widely spread in nature. We can observe it in proportions of galaxies,
animals, plants, humans (for example, measure phalanxes of your fingers – they relate to each other as 1.618;
it must also be noted that 1/1.618 is 0.618; numbers 1.618 and 0.618 are sometimes called "Fibonacci numbers";
one should remember that values given here are approximate; the precise value of these numbers cannot be expressed
in a finite set of numbers; to seven decimal places, number is 1.6180339…; it can be obtained from the
following expression: = 0.5 + √5/2). Ancient Greek sculptors and architects used "golden section"
in their works. We can see this ratio in the works of oriental masters. A medieval mathematician named Leonardo
Fibonacci studied this problem, too. He considered a sequence of positive natural numbers in which each following
number is equal to two preceding ones summed up:
1, 1, 2, 3, 5, 8, 13, 21, 34, 55, and so on.
This sequence was named Fibonacci sequence. If we divide two neighboring numbers in Fibonacci sequence by each other:
… we will see that every result gradually approximates to the "golden section" proportion, though it never reaches it.
Followers of the Elliot's theory consider the "golden section" and the closely related to it Fibonacci numbers and sequences to have to appear in charts. They reason that, since we observe the above relations in a significant amount of natural objects, we should observe them in charts, too. Moreover, some experts think a natural object and a market to be the same. This is what Bill Williams says about that: « … the markets are a "natural" nonlinear function and not a "classical physics" linear function..." (B. Williams. Trading Chaos)
However, this statement is an absolute absurd. A wise man from Odessa, monsieur Boyarski said to his bride Dvoira one day: "Mam'selle Krick, I will never say for black that it is white, nor I allow myself to say for white that it is black". (I. Babel. Sunset)
Bill Williams names white things black. Market is a man-made complicated system. Scientists will perhaps discover the laws that regulate its functioning. Even a human being is not only natural, but also a social subject. So what shall we think of a market… Millions of people trade in the market. Can you prove that their activities produce Elliot Waves, Fibonacci numbers, Gann Angles. Prove it! And then start to forecast for specific purposes.
Fibonacci numbers and other "magic" relationships may sometimes occur in charts, but only along with other proportions. The market often rolls back after growth by, say, 50, 40, 30% – generally speaking the rollback value may be very different. Any analyst of good sense will tell you about this. However, many specialists state that Fibonacci numbers, Elliot Waves, etc. might "manage" the market.
NB: Is it so, indeed? Yes, these relationships are sometimes observed in charts. However, in most cases, they are
not. The divergence of price fluctuation parameters is so large that any relationships can be found there. As
to that those numbers "manage" the market, I can say: Yes, they do. However, they do it to the extent,
to which they manage consciousness of the analyst plotting waves with predefined parameters in the chart…
Fractals
By the way, as to waves. If we closer consider any element of Elliot wave, for example, waves 1 and 2, we will discover that they copy the entire wave formation, but in small (see Fig. 1-15):
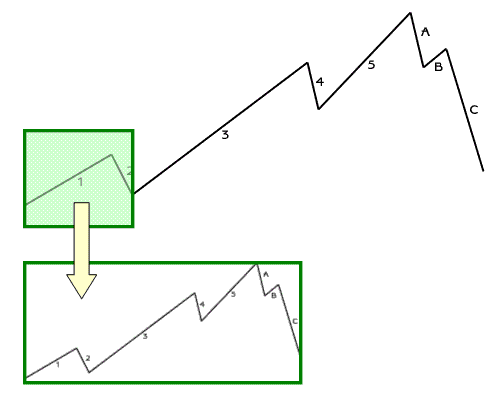
Fig. 1-15. Enlarged Waves 1 and 2
Elliot Waves are, thus, similar to fractal objects, or fractals. Fractal is a system where lower-lever elements copy the higher-level elements. In Fig. 1-16, we can see the simplest fractal objects:
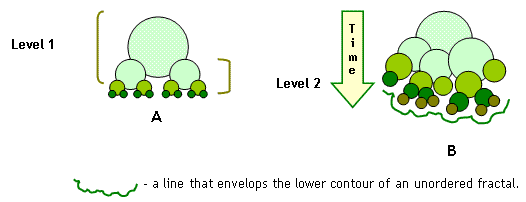
They are formed by circles. As you can see, structure of level n+1 copies the structure of level n. We observe the same circles at the lower level. In our example, in an ordered
fractal, their radius decreases two times when going to level n+1 and their amount is strictly fixed: two lower-level circles for one upper-level
circle. This is not the case in an unordered fractal. The radii of circles there
are not changed in a strict order, the amount of elements at level n+1 fluctuates, too. The amount of levels in a fractal is named fractal number. For fractal A, it is 4, and it is
5 for fractal B. Note the time vector – it is directed from larger elements to smaller ones. Why is it so?
What is the sense of this? – I will deal with this topic below.
The term of "fractal" was coined by Benoît Mandelbrot, the member of research staff at the IBM Thomas J. Watson Research Center, in 1977. He made a mathematical description of fractals, though some mathematicians considered fractal objects still in the 19th century. The word "fractal" itself comes from Latin word "fractus" that means "split", "divided into parts". Mandelbrot defined a fractal as "a rough or fragmented geometric shape that can be subdivided in parts, each of which is (at least approximately) a reduced-size copy of the whole". He noticed that the fractal structure was repeated in reduced-size objects. Many natural objects are similar to fractals. We can name them natural fractals unlike mathematical fractals the foreign scientist dealt with. A tree, for instance, is an unordered natural fractal that is formed with the time from larger elements (trunk, boughs) to smaller ones (twigs).This is the sense of arrow "Time" shown in Fig. 1-16. Goose feather is a natural fractal, too, but more ordered one than the tree. Benoît Mandelbrot, in addition, noticed that some objects, such as British coastline, resemble an outline of an imaginary unordered fractal. He also noticed that, in some cases, an exteriorly chaotic structure has some internal transphenomenal order that relates, again, to fractals.
Many technical analysts jumped at these ideas. A group of researchers declared that
a price chart is an object based on an invisible fractal structure and the only
thing to do in order to make a good forecast for the future is to find this hypothetical
structure, then everything else would be the matter of realization. It must be
said that that quest for the fractal has not resulted in something essential yet.
Another group just undertook a frontal attack against the market saying that the
chart itself is a fractal. Let my readers forgive me for that I don't expound the
ideas quite clearly. I can excused myself by saying that I try to retell some entangled
and unclear ideas in my own words. Many experts who say that "market = fractal"
do not imagine
a) what the market is;
b) what the fractal is; and
c) what the sign of "=" means.
So in order to understand what will happen in the market within the next month, it is sufficient to consider the price movements within say five days since, if the market is a fractal objects, the things happening at n+1 level significantly reflect the things happening at n level!
What can we say about this? It recurs to me the following story. An indolent student preparing to his exam in biology learned only one topic – about fleas. In his exam paper, he sees the topic about fish. Being a man of ideas, the student says to his professor: "The fish body is scaly. However, if fish were furry, there would surely be fleas in their fur..." And he started to tell everything he learned about fleas. Some analysts, too, have learned only one topic - about fractals - and that in a perfunctory manner. To be serious, before building some specific forecasting methods (and the things come to this point, read, for example, Trading Chaos by Bill Williams), one has to prove scientifically that, indeed, a specific fractal structure underlies the market chaos. I have never seen such a proof.
Besides, we have to understand clearly the following. Mandelbrot's fractals are abstract mathematical and geometrical
structures. Natural fractals are organisms created by the Superior Mind that develop according to a certain plan.
This plan implies both their fractal structures and "golden section" in their proportions and many
other things that we don't know, neither can realize. For those readers who don't believe in the Superior Mind,
I can say that evolution plan for any living creature on our planet is coded in its genes that are included in
the DNA molecule. It is DNA where information about fractality, "golden section", etc. is stored.
Moreover, a natural fractal develops from larger elements to the smaller ones. The time is going here "along" the fractal (this is the sense of the arrow in Fig. 1-16), whereas a chart is formed by grouping about relatively small elements (prices of specific, single trades) into relatively larger ones (candlesticks, for example). In a chart, the time is going somehow "sideways" – along an imaginary line skirting the outline of the invisible fractal (have another look at Fig. 4 and at any price chart). A chart is just similar to a fractal or its outline.
NB: Thus, if somebody declares that the market is a fractal object regulated by Fibonacci
numbers and other predefined numerical relationships, I would ask such researcher
to show me the DNA molecule or the program that regulates the market! Or at least
to prove that the market pricing chaos, indeed, seems to be the chaos at our level
of perception and we will be able to see the order in the market if we look at
it at another sight angle! As it is now, I have to note that all theories about
waves, fractals and "magic" numbers are not built on any serious scientific
basis.
"Psychological School"
Once, in 1996, when I was standing in a queue in the stock lunchroom, my old team mate, stock trader and teacher
Valeri Gaevski elbowed me slightly and, pointing out to a tonsured man of medium height who was several steps
before us, said: "This is doctor Elder. He has just come from the States yesterday. Haven't you read his
book? I think you should read it…" This is how I knew about the famous trader, analyst and author Alexander
Elder. What was his way to fame? Our hero was born in the U.S.S.R., graduated a medical school and worked as
a ship's doctor. Let's call upon himself to speak, though:
"I had grown up in the Soviet Union in the days when it was, in the words of a former U.S. president, "an evil empire". I hated the Soviet system and wanted to get out, but emigration was forbidden. I entered college at 16, graduated medical school at 22, completed my residency, and then took a job as a ship's doctor. Now I could break free! I jumped the Soviet ship in Abidjan, Ivory Coast.
I ran to the U.S. Embassy through the clogged dusty streets of an African port city, chased by my ex-crewmates. The bureaucrats at the embassy fumbled and almost handed me back to the Soviets. I resisted, and they put me in a "safe house" and then on a plane to New York. I landed at Kennedy Airport in February 1974, arriving from Africa with summer clothes on my back and $25 in my pocket. I spoke some English, but did not know a soul in this country." (A. Elder. Trading for a Living.)
Elder kept wits about one in the new environment and found legs. He started to work in his specialty – as a psychiatrist, and traded stock in parallel. The latter occupation led him to success, that allowed him to open his own company where newbies were taught how to trade stock.
In 1993, John Wiley and Sons Inc. published his book Trading for a Living. The author stated in the book his rather original analysis conception, according to which the main force that moves the market is crowd's emotions. Doctor Elder considers a crowd to be an indiscrete mass liable to greed of gold and manias of different kinds. According to Elder, the behavior of most traders is the same as that of alcohol abusers – traders' wish to trade is as strong as abusers' wish to drink alcohol. The trend is formed as a result of that the most traders feel sorely incline to buy (uptrend) or sell (downtrend). The trend is broken when losers cannot contain themselves any longer and close positions, whereas the general body of traders starts to turn about in an opposite direction. According to this conception, Elder considers technical analysis as applied mass psychology. Shapes, trend lines, indicators - all this, to his opinion, reflects crowd's emotions.
However, this externally attractive conception has, to my opinion, some essential disadvantages. The main of them is that, apart from emotions, some other factors influence the trend. For example, capital flow due to activities of large traders that, unlike their smaller "colleagues", are psychologically stable subjects. The stock crowd is not an indiscrete mass. Three main classes of traders can be distinguished in the stock crowd. The superposition of activities of those three groups of traders forms the unique picture of the market that analysts see as a chart. You can do nothing in trading if you don't have money in your pocket, whether your emotions are strong or not. Any, even little considerable price fluctuation is caused by making a bilateral contract – somebody sells and somebody buys. This operation needs, first of all, money and a holding of stocks. Emotions accompany the trend, but they don't determine it. Stating the opposite is the same as saying that a car can go ahead with an empty gas tank driven by only driver's burning desire.
However, the most important force that moves the market is the real economy. Oil and oil stocks grew last years not that much due to "crowd's emotions", but because this raw material was in high demand in China and the USA.
NB: I think, emotions of traders should, of course, be considered in analysis. Emotions often cause some objects appearing in the chart, for example, so-called false breaks. However, the crowd's psychology must be considered together with, for example, capital flow.
Trading Volume
The modern interpretation of trading volume in the second stock market is, in terms of technical analysis, very general by nature, intrinsically erroneous and cannot really assist an analyst. Japanese school ignores the volume on the whole. If we speak about Western school, some statements from A. Elder's book Trading for a Living (1993) can be cited and commented here to illustrate the above reasoning. In my opinion, they show the current situation in the field of technical analysis very well.
A. Elder writes: "Volume reflects the degree of financial and emotional involvement, as well as pain, of market participants". [P.169] This statement is true only by half. The matter is that the volume often reflects activities of large traders that are unemotional. This means that large volume does not always show strong emotional involvement of participants in trading. In a similar way, a small volume may certify that some market operators have left for holidays (in Russia, for example, it is the case in July and August, and in the last decade of December) rather than that the "crowd" has weak emotions or does not react to the various data incoming in their terminals. Besides, let's imagine that an unexperienced retailer opens a long position, whereas the price falls contrary to what he or she might expect. Such a trader will slog this losing position out in the hope that the price will change its direction to his or her favor. And, the stronger the price falls, the stronger emotions this trader feels. As soon as his or her pain becomes unsufferable, the trader will close the position. By this example, we can see that intensity of performing trades and, therefore, the volume of trades are not directly related to the intensity of pain, nor is it directly related to the degree of financial and emotional involvement of market participants since, in spite of all pain a retailer has accumulated in him or herself, the trader entered the market only once - in order to close the position. – I would note parenthetically that Elder has not explained what is, in his terms, the "financial involvement". This occludes comprehension of his reasoning.
Let's read further: "Each tick takes money away from losers and gives it to winners. When prices rise, longs make money and shorts lose. Winners feel happy and elated, while losers feel depressed and angry. Whenever prices move, about half the traders are hurting. When prices rise, bears are in pain, and when prices fall, bulls suffer. The greater the increase in volume, the more pain in the market." [P.169]. The situation described by the author in his first two sentences occurs in its pure form only in the futures market when playing with leverage. These two above statements do not relate in any way to the classical stock market where traders sell and buy with full coverage since, if a trader has bought some stock and the price goes against him or her, only market estimate of his or her stock will decrease. In the same way, if the price started to grow after he or she has sold his or her stock, the trader may only accuse him or herself for too early selling. We are not talking any loss, in both cases. Elder notes then: "Winners feel happy and elated, while losers feel depressed and angry. " As a matter of fact, everything is much more complicated. Let's imagine that a trader has bought stock and the price grows. The trader is a winner, isn't he/she? However, this does not mean that the trader is happy and elated. Quite the opposite, he or she may be depressed and sad. The trader is afraid of that price may swing in its movement! Then imagine that a trader has bought some stock and price goes against him or her. According to Elder, such trader must be depressed and angry. However, in practice we can see that this trader is fresh and happy. Why? The matter is that the trader is glad to have an opportunity to buy more stock at a lower price. Further Elder's statement is: "Whenever prices move, about half the traders are hurting.". This is one more disputable statement. Let's imagine that the price is growing and the buyers are two large traders, whereas the sellers are 40 retailers. In this case, the pain will be felt by the overwhelming majority of market participants, not by only 50% of them. And, finally, the last statements about that "the greater the increase in volume, the more pain in the market" is at least disputable, too. The following phrases by Elder are quite typical, too: "A burst of extremely high volume also gives a signal that a trend is nearing its end". [P.170] and "High volume confirms trends". [P.171]. Let us also compare the following quotations: "Falling volume shows that fuel is being removed from the uptrend and it is ready to reverse" [P.170] and " … a decline can persist on low volume" [P.171]. These statements are mutually exclusive. This interpretation of volume is not useful for an analyst. In my opinion, such statements testify that their author did not go deeply into the nature of markets being analyzed. This is why he interprets the data about trading volume in a wrong way.
In this connection, one more phrase is typical: "When a market rises to a new peak on lower volume than its previous peak, look for a shorting opportunity" [P.171]. First, it is not clear why this must be this way. Second, the analyst's attention is for some reason switched to the volume of the trading days, on which the price extremums fall, whereas the volumes of preceding and following days is not considered. This is obviously a mistake since in a second stock market trends most frequently develop as a result of large traders' activities that don't show themselves within one (even peak) day, but within many days.
NB: As of the stage, we can state that modern technical analysts cannot give any scientifically grounded interpretation for such an important characteristic of trading as volume. Therefore, the following task faces us: to interpret and to explain volume in a proper way.
Conclusions
Summarizing all above, I would like to note that technical analysis is now experiencing "teething troubles" marked by walking in heavy-going refinements of naive empiricism. Technical analysis has every chance to become a real science. However, this needs new developments, not only true realization of lacks and mistakes.
Unfortunately, most technical analysts ignore all this reasoning. They have shrunk into their little world. They just like to build charts, that's all. However, their final task is to predict the future. And this is the most difficult thing in the market. The future is not conserved as a zip file in the past. It always springs surprises on us.
This is the future that will show us whether technical analysis is able to overcome its own boundedness and start a new development cycle.
Constantin Tsarikhin, 2002-2004.
Translated from Russian by MetaQuotes Ltd.
Original article: https://www.mql5.com/ru/articles/1445
 Transferring an Indicator Code into an Expert Advisor Code. General Structural Schemes of an Expert Advisor and Indicator Functions
 Transferring an Indicator Code into an Expert Advisor Code. Indicator Structure
 Using Skype to Send Messages from an Expert Advisor
 MetaTrader 4 Working under Antiviruses and Firewalls
- Free trading apps
- Over 8,000 signals for copying
- Economic news for exploring financial markets
You agree to website policy and terms of use
Very well versed and heart catching article but I think it’s the matter of advancement in mathematical indicators techniques and supportive technology that may enhance some skills to get the understanding of the market.
As far my understanding I think mathematical indicators shows what the market feels right at particular time where as how it will behave further on is matter of assumption and guess work from ones previous experience to get odds in his favor .
I think mathematical indicators on charts can resemble thermometer which only indicates what’s the environment temperature rather than controlling the temperature. By denying the thermometer or breaking is not going to change temperature as the reasons of temperature fluctuations are others than measurement instruments, but surely one can assume that if reading shows high temperature and also outdoor he sees the dark clouds coming than he starts assuming that the environment temperature is going to get down but not sure how soon or how much its going to get down but with his experience and latest observation he sets that particular scale of measurement as resistance and wait for down trend.
Theirs is nothing wrong with indicators but with variable scales which bring a no standardization in a system, but yes how are you going to standardize a market where two sane persons are agreed upon price but disagree on value ???? Amazing … that’s the beauty or other wise market will become dull, odorless, tasteless, worthless, and unadventurous in short love without emotion.
Great article, very thought provoking and I really enjoyed reading it, even though, and I am NOT saying "You are wrong", I don't agree with all of your conclusions.
Fundamentally, a market is where things are exchanged at an agreed (read accepted) value. Value is what something is worth. What is it worth? Well, whatever you can get someone to pay for it. So, one may buy an item for $1.50 and, at the same time, somewhere else someone bought the same thing for $1.30. Did the first person get ripped off or did the second get a great bargain? Subjective to sat the least, but in reality, That item was worth BOTH $1.30 and $1.50 at the same time. Value and worth are only psychological perceptions, and they can be influenced by external factors, a bottle of water is worth more in the desert than it is beside a stream from a pristine mountain spring. Nothing has any intrinsic value!
So, in the stock market, a trader needs to buy low/sell high and vice-versa to walk away with his profit, but an investor may be looking to get dividends or accumulate positions over time with bonus shares, etc, whilst another may be buying shares to acquire voting rights for control.
Elders was indeed on track talking about the mass psychology. ALL transactions are performed by humans and all humans are influenced primarily by emotion, including those at institutions (Spock and the Vulcans have not come to Earth yet). The financial crash of 2008 was caused by institutional greed (emotion on steroids!).
There is some validity to Fibonacci ratios as, since they are so prevalent in the natural world around us, including us ourselves (ever looked at your fingers?) so they would have to be somewhat impregnated into our subconscious. So a pullback would "look about right" near a fib ratio.
Also there is the fact that so many, including institutional traders, using various tech analysis bits, will act similarly because they respond to the same thing in similar ways, creating the self fulfilling prophecy of sorts.
However, not all traders are trading the same time frames or using the same systems. How many little trends are on the m5 within a single daily candle? Some trade to grab the middle of a move waiting for a confirmed impulse, some trade the pullback, some try to catch the tops and bottoms.
I do not believe there will ever be holy grail science around it. Rather, I see that intuition, unquantifiable and undefinable like a surfer riding waves, will always be a big part of trading. Technical analysis and indicators can help traders "read the market", and since we all see things differently, no system, no indicator, whatever, will provide a "one size fits all" solution. Many of these "tools" may well be scientifically nonsense, but some people will be able to use them to create profit, while others, trying to do exactly the same thing fail, just like one surfer somehow manages to consistently make it through the tube while others consistently get wiped out!
We can get fooled looking at charts and fancy looking indicators that make it look like we are part of a NASA program, but in the end, that is just a display, and it is, in reality, people driving the markets, and I repeat, as Elders said, (and it has been scientifically quantified) people a far more emotional than rational when it comes to decision making.
So maybe it is more that we need to recognize technical analysis for what it is, rather than expecting there ever to be an intrinsic understanding of the market to build a science around, because the latter is the real unachievable "holy grail".
Hi Constantin, referring to the point in the article:
I'm curios of what you, the author, may think about alternative representations of chart data called Renko charts - Range bars - KAGI charts, that, as far as I read, don't use the time to draw chart data.
I'm also curios of what you may think about recent alternative methods for representing 'clusters' of prices of opened (and pending) buy and sell positions
(in short, something like the dealer book levels expressed in graphical form) such as the one called Market Profile. (https://www.mql5.com/en/code/9857)
And, referring to the point:
Trading Volume
I'm curios of what you may think about a proposal for an indicator "Market Volume Profile or Volume Histogram" (see forum at https://www.mql5.com/en/forum/102928).
By the way, I just found an article that I would also suggest Constantin to take a look, ""Principles of Time Transformation in Intraday Trading", that you can find here: http://articles.mql4.com/en/articles/1455As I understood from this article, the author describes a method for "adapting" the time variable to fixed number of market ticks, towards on increased homogeneity of statistical data.
Thank you for your excellent and insightful article