Working with Files. An Example of Important Market Events Visualization
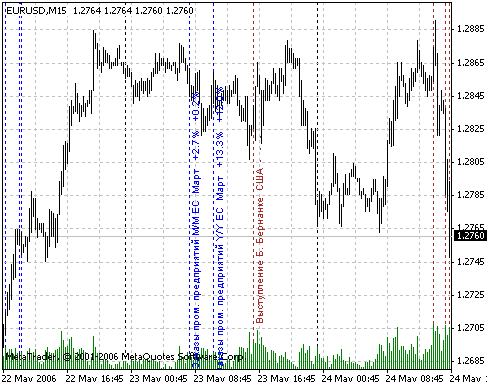
Every trader knows that is is rather risky to open a position using only technical analysis (TA). It would be more proper to open position using both fundamental and technical analysis. Most often, traders who work on TA use an events schedule in order to consider possibly volatility of the market and not to expose their positions to undue risks. It would be very convenient if all key events of the trade day were displayed in the price chart. For example:
15.05.2006;9:00; Industrial Production M.M ;Japan;March;3.40%;1.00%;
15.05.2006;16:30; New York Fed Survey ;USA;May;15.8;15;
15.05.2006;17:00; Netto Capital Flow ;USA;March;86.9Bln;80.0Bln;
16.05.2006;12:30; HICP Y.Y ;U.K.;April;1.80%;2.00%;
16.05.2006;13:00; ZEW Economic Sentiment;Germany;May;62.7;65;
16.05.2006;16:00; Wal-Mart Stores Report;USA;1qtr.;-0.61;-;
16.05.2006;16:30; PPI M.M ;USA;April;0.50%;0.70%;
16.05.2006;16:30; PPI ex. Mortgage and Energy M.M;USA;April;0.10%;0.20%;
16.05.2006;16:30; Housing Starts ;USA;April;1.960Mln;1.960Mln;
16.05.2006;16:30; Building Permits ;USA;April;2.094Mln;2.050Mln;
16.05.2006;17:15; Industrial Production M.M;USA;April;0.60%;0.40%;
16.05.2006;17:15; Capacity Utilization ;USA;April;81.30%;81.50%;
17.05.2006;8:30; Industrial Production (rev.) M.M ;Japan;March;0.20%;0.20%;
17.05.2006;12:30; Unemployment M.M ;U.K.;April;+12,600;+5,000;
17.05.2006;12:30; BoE Minutes 4.05 ;U.K.;-;-;-;
17.05.2006;13:00; Industrial Production M.M; Eurozone;March;0.00%;-0.20%;
17.05.2006;13:00; Industrial Production Y.Y ;Eurozone;March;3.20%;2.80%;
17.05.2006;13:00; HICP (rev.) Y.Y ;Eurozone;April;2.40%;2.40%;
17.05.2006;16:30; CPI M.M;USA;April;0.40%;0.50%;
17.05.2006;16:30; CPI ex. Mortgage and Energy M.M ;USA;April;0.30%;0.20%;
18.05.2006;12:30; Retail Sales M.M ;U.K.;April;0.70%;0.20%;
18.05.2006;12:30; Retail Sales Y.Y;U.K.;April;2.60%;2.60%;
18.05.2006;16:30; Initial Jobless Claims ;USA;8-14.05;324,000;320,000;
18.05.2006;17:30; Fed Chairman Bernanke Speaks ;USA;-;-;-;
18.05.2006;8:00; Leading Economic Indicators M.M ;USA;April;-0.10%;0.10%;
18.05.2006;20:00; Philadelphia Fed Survey ;USA;May;13.2;12;
19.05.2006;1:30; Alan Greenspen Speaks;USA;-;-;-;
19.05.2006;3:50; Gross Domestic Product (GDP) Q.Q ;Japan;1qrt.;1.30%;0.20%;
19.05.2006;8:00; Bank of Japan Meeting ;Japan;-;-;-;
19.05.2006;13:00; Current Account ;Eurozone;March;-4.5Bln;-3.0Bln;
To read the data from the file, it is necessary to connect to it first, i.e., to open it for reading. There is an operator used for this purpose in MQL4:
int FileOpen( string filename, int mode, int delimiter=';')
the parameters of which are: file name, type (a binary FILE_BIN or a line-oriented FILE_CSV with separators), access method (reading FILE_READ or writing FILE_WRITE), and delimiter character between line data. If the file is opened successfully, the identifier will be assigned with a unique value, otherwise the file identifier will be assigned with the value of -1. To refine the error data, one can use the GetLastError() function. The FileName variable is placed in the script heading.
#property show_inputs
extern string FileName = "week.txt";

…

   int handle;
   handle=FileOpen(FileName,FILE_CSV|FILE_READ,';');
   if(handle<1)
    {
     Print("File was not found: ", GetLastError());
     return(false);
    }
This is the way in which we connected to the file. The next stage will be reading of all data. We will read lines, then convert them into necessary types. Then we will try to write the filter of events displaying. To do so, we just need to put the variables into the script heading. The variables will show whether the event from this country should be displayed in the price chart.
    while(!FileIsEnding(handle))
   {
    string sDate=FileReadString(handle); // Date
    string sTime=FileReadString(handle); // Time
    string sCountry=FileReadString(handle); // Country
    string sPeriod=FileReadString(handle); // Period
    string sDescription=FileReadString(handle); // Description
    string sPrev=FileReadString(handle); // Prev
    string sForecast=FileReadString(handle); // Expected
    string sCurrent=FileReadString(handle); // Current value

    FileReadString(handle); // null


    Print(
      sDate+" "
      ,sTime+" "
      ,sCountry+" "
      ,sPeriod+" "
      ,sDescription+" "
      ,sForecast+" "
      ,sCurrent+" ");

    i++;
    datetime dt = StrToTime(sDate+" "+sTime);

         color c = Red;

         if (sCountry == "Japan") c = Yellow;
         if (sCountry == "USA") c = Brown;
         if (sCountry == "Germany") c = Green;
         if (sCountry == "Eurozone") c = Blue;
         if (sCountry == "U.K.") c = Orange;
         if (sCountry == "Canada") c = Gray;
         if (sCountry == "Australia") c = DarkViolet;
         if (sCountry == "Sweden") c = FireBrick;
         if (sCountry == "South African Republic")
             c = DodgerBlue;
         if (sCountry == "Denmark") c = RosyBrown;
         if (sCountry == "Norway") c = HotPink;


         if ((sCountry == "Japan") && (!Japan)) continue;
         if ((sCountry == "USA") && (!USA)) continue;
         if ((sCountry == "Germany") && (!Germany)) continue;
         if ((sCountry == "Eurozone") && (!ES)) continue;
         if ((sCountry == "U.K.") && (!GB)) continue;
         if ((sCountry == "Canada") && (!Canada)) continue;
         if ((sCountry == "Australia") && (!Australia))
              continue;
         if ((sCountry == "Sweden") && (!Shweden)) continue;
         if ((sCountry == "South African Republic")&& (!UAR))
               continue;
         if ((sCountry == "Denmark") && (!Dania)) continue;
         if ((sCountry == "Norway") && (!Norvegia)) continue;


          if (DisplayText)
          {
          ObjectCreate("x"+i, OBJ_TEXT, 0, dt, Close[0]);
          ObjectSet("x"+i, OBJPROP_COLOR, c);
          ObjectSetText("x"+i,
            sDescription + " "
            + sCountry + " "
            + sPeriod + " "
            + sCurrent + " "
            + sForecast,
            8);
          ObjectSet("x"+i, OBJPROP_ANGLE, 90);
          }


          ObjectCreate(sCountry+" "+i, OBJ_VLINE, 0, dt,
                       Close[0]);
          ObjectSet(sCountry+" "+i, OBJPROP_COLOR, c);
          ObjectSet(sCountry+" "+i, OBJPROP_STYLE, STYLE_DOT);
          ObjectSet(sCountry+" "+i, OBJPROP_BACK, true);
          ObjectSetText(sCountry+" "+i,
            sDescription + " · "
            + sPeriod + " · "
            + sCurrent + " · "
            + sForecast,
            8);

   }
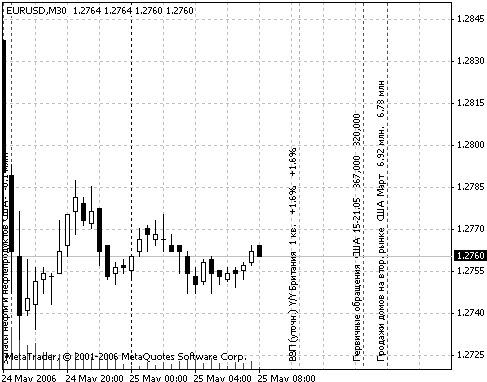
Now, you can always see the forthcoming events and their impact on the market. The ready script code and data files are attached to this article. Please do not forget that scripts should be placed in the Experts/Scripts directory, and data files should be in Experts/Files. The date format (YYYY.MM.DD HH:MM) and delimiters may not be forgotten. The work of the script is illustrated below.


Working with files in MQL4 gives users a multitude of opportunities: both connection of the terminal to external data feeds and simplifying or optimization of work with the trading terminal. Examples are both supporting of logs and possibility to display support/resistance levels getting data directly from WorldWide Web. It means that the user is unrestricted to choose methods of working with files. Automated opening and managing positions should contribute to decreasing of traders' stresses and, in their turn, allow to analyze more factors influencing trading. Actually, this is what MQL4 is intended for.
Below are all MQL4 functions used to work with files. More details can be found in MQL4 documentation.
FileClose
FileDelete
FileFlush
FileIsEnding
FileIsLineEnding
FileOpen
FileOpenHistory
FileReadArray
FileReadDouble
FileReadInteger
FileReadNumber
FileReadString
FileSeek
FileSize
FileTell
FileWrite
FileWriteArray
FileWriteDouble
FileWriteInteger
FileWriteString


                                                                                                     Translated from Russian by MetaQuotes Software Corp.
                                                                                                     Original article: /ru/articles/1382
Translated from Russian by MetaQuotes Ltd.
Original article: https://www.mql5.com/ru/articles/1382
 How to Use Crashlogs to Debug Your Own DLLs
 Error 146 ("Trade context busy") and How to Deal with It
 MagicNumber: "Magic" Identifier of the Order
 Information Storage and View
- Free trading apps
- Over 8,000 signals for copying
- Economic news for exploring financial markets
You agree to website policy and terms of use
Could you mind to set a * symble as a mark only,
then when one click that * mark, then popup a small window to show details like tootip ????
Could anyone tell me what's indicator as below picture, I like it !
Thanks you everybody again.
Methasit W. / New programmer & Gold Trader.