
Mechanical Trading System "Chuvashov's Fork"
"We are interested in the latest values in order to produce trend lines"
Thomas DeMark
Introduction
Stanislav Chuvashov proposed a Forex trading technique using the "Chuvashov's Fork" pattern. In this technique, the approach to market analysis has something in common with DeMark's approach to drawing trend lines for the last closest time interval.
1. A Method for Drawing "Chuvashov's Fork" Pattern Lines
The fractals indicator is used to draw the "Chuvashov's Fork" pattern. The main trend line is drawn passing through the two neighboring fractals 1 and 2 as shown in the price chart (see Figure below). The main uptrend line is drawn based on lower fractals; the main downtrend line is drawn based on upper fractals.
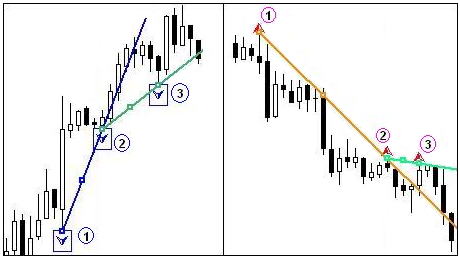
Figure 1. Drawing the "Chuvashov's Fork" pattern
We should wait until a similar fractal 3 gets formed following the main trend line breakout in the opposite direction to the trend. A lateral line drawn through fractals 2 and 3 together with the main trend line forms the "Chuvashov's Fork" (CF) pattern. This is the name given by the author Stanislav Chuvashov.
The main requirement to the CF pattern is that the lateral line of the fork must be in the direction of the trend. Lateral lines breaking through give rise to signals: to sell in the uptrend and to buy in the downtrend.
Below is the sequence of formation of the "Chuvashov's Fork" pattern as exemplified on EURUSD H1 over 4 consecutive days.
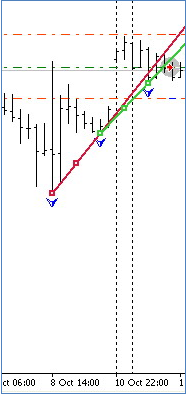
Figure 2. "Chuvashov's Fork" pattern formation
Figure 2 shows the emergence of the "Chuvashov's Fork" (CF) pattern on the uptrend suggesting the end of the trend or that the trend is going flat. РњРўS opened a SELL position.
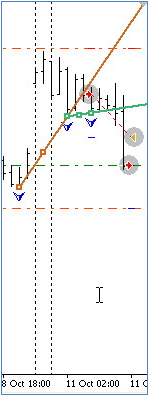
Figure 3. New CF pattern
6 bars (hours) later, a new CF pattern with a wider gap emerged (Fig. 3) confirming the previous pattern that suggested the reversal of the trend or it going flat.
MTS closed the previous SELL position at the Take Profit level and opened a SELL position again on the CF pattern conditions.
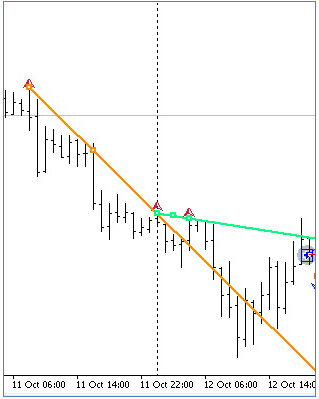
Figure 4. CF pattern confirmation
Fig. 4 shows that after the trend reversal on October 11, the trend was going down which is confirmed at the beginning of October 12 by the CF pattern directed downwards.
In the middle of the day, a new trend reversal started to take shape as the price moved towards the lateral CF line. After the lateral line is crossed, the existing SELL position can be closed and a BUY position can be opened.
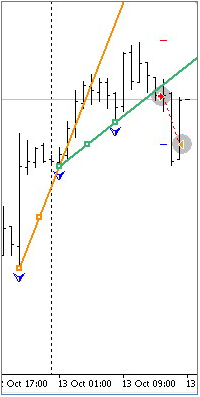
Figure 5. Trend reversal
As can be seen in Fig. 5, the trend kept going up for the remaining part of the day on October 12 and the beginning of October 13. Towards the middle of the day, an upward CF pattern has emerged. Another trend reversal began to show in the middle of the day on October 13. Following the formed signals, MTS will close the BUY position and open a SELL position.
The above pattern formation sequence can be traced using the strategy tester in visualization mode at a low speed by testing the attached file Fork_Ch_ExpertH1_v2.mq4 as an Expert Advisor.
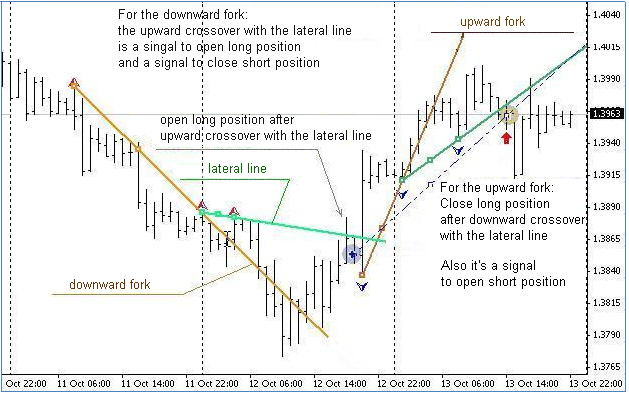
Figure 6. Trading signals
Figure 6 provides some clarifications in terms of signals for opening and closing positions.
2. Some Features of the Proposed Code for "Chuvashov's Fork" in MQL4
The list of variables, functions for opening and closing orders, functions for drawing marks and trend lines are left without comments in the below code and are not provided in the article since they can be found in the programs in the attached files and are simple enough to figure out.
Note that some variables are included in the main program function Start() as they should be zeroed out at every tick.
We start with searching for the last three consecutive fractals lying along, e.g. a downtrend. In this case, we get a fork directed downwards. If there is a breakout above the lateral line, a BUY position can be opened.
// ===================================================================
// Loop for searching for the last three consecutive fractals (BUY case)
// lying along the DOWNtrend for the Chuvashov's Fork construction
// ==================================================================+
   for (i=M;i<=N;i++)
    {//loop
    if(High[i]>High[i+1] && High[i]>High[i+2] && High[i]>High[i-1] && High[i]>High[i-2])
     {
      VFN++; // counter of the found fractal.
     // -------------------------------------------------------------+
      if(VFN==1)               // if the 1st fractal is found, store the following values: Max[i], candlestick no.[i], time[i]:
      { // f1
        Vnf1=i;                // store the Max bar number of the found fractal.
        VMF1=High[i];          // store the Max value of the 1st found fractal.
        tim1=iTime(NULL,0,i);  // store the time of the 2nd reference point.
      } //-f1

    // --------------------------------------------------------------+
      if(VFN==2)                // if the 2nd fractal is found, store the following values: Max[i], candlestick no.[i], time[i]:
      { VMF2=High[i];           // store the Max value of the 2nd found fractal.
        if(VMF2>VMF1)           // if the Max value of the 2nd fractal is higher than that of the 1st fractal (i.e. directed downwards),
        { Vnf2=i;               // store the Max bar number of the found fractal.
          tim2=iTime(NULL,0,i); // store the time of the 2nd reference point.
        }
      }
    // --------------------------------------------------------------+
    if(VFN==3)                  // if the 3rd fractal is found, store the following values: Max[i], candlestick no.[i], time[i]:
    {
      VMF3=High[i];             // store the Max value of the 3rd found fractal.
      if(VMF3>VMF2)             // if the Max value of the 3rd fractal is higher than that of the 2nd fractal,
       {Vnf3=i;                 // store the Max bar number of the 3rd fractal.
        tim3=iTime(NULL,0,i);   // store the time of the 3rd reference point.
       }
    }
// ------------------------------------------------------------------+
   if(VFN==3) break; // all three fractals are found, exit the loop.
// ------------------------------------------------------------------+
    }
   }//-loop
In the above loop, we have found three fractals located in the specified manner, i.e. the 1st fractal is lower than the 2nd fractal and the 2nd fractal is lower than the 3rd fractal. The 3rd and 2nd fractals are reference points in the construction of the Main trend line and form the basis thereof.
However the 3rd fractal (its value) may turn out to be lower than the main trend line projection on the vertical of the 1st fractal:
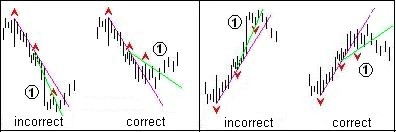
Figure 7. Refinement of location of the reference point
Therefore we introduce a number of operators refining the location of the 3rd reference point in accordance with the pattern construction requirements.
// ------------------------------------------------------------------+
   if(VMF3>VMF2 && VMF2>VMF1)
    {
    // Let us define whether the lateral (2) trend line is HIGHER than the projection of the MAIN(1)
    // trend line? For this purpose, we calculate the price value of the projection of the MAIN(1) trend line
    // on the vertical of the Max value of the 1st fractal:
    V_down1=((VMF3-VMF2)/(Vnf3-Vnf2));      // speeds of falling of the MAIN(1) trend line over 1 bar.
    PricePrL1_1f=VMF2-(Vnf2-Vnf1)*V_down1;  // price of the projection of the MAIN(1) trend line on the vertical of the 1st fractal.
    // now compare the price value of the 1st fractal with the price of the projection of the MAIN(1) trend line
    // on the vertical of the Max value of the 1st fractal, and if the Max price of the 1st fractal is higher than the price of the projection of the
    // MAIN(1) trend line on the same fractal, then the Chuvashov's Fork construction requirements are met.
    if(VMF1>PricePrL1_1f) // if the pattern for opening a Buy position has emerged
     {
     V_down2=((VMF2-VMF1)/(Vnf2-Vnf1));  // speeds of falling of the lateral trend line over 1 bar.
     PricePrL2_1b=VMF1-Vnf1*V_down2;     // price of the projection of the Lateral(2) trend line on the current 1st BAR.
     PricePrL1_1b=VMF2-Vnf1*V_down1;     // price of the projection of the MAIN(1) trend line on the current 1st BAR
     // keep in mind that the pattern for opening a Buy position has emerged
     patternBuy = true; patternSell = false;   // pattern for opening a Buy position has emerged
     // draw marks and lines of the "Chuvashov's Fork" pattern
     DelLine(); CreateLine(); CreateArrow();   // draw marks and lines having deleted the preceding ones
     }
    }
// ==================================================================+
If the Max price of the 1st fractal is higher than the price of the projection of the MAIN(1) trend line on the same fractal, then the Chuvashov's Fork construction requirements are met.
Thus, the "Chuvashov's Fork" pattern has been determined and we can draw the respective pattern marks and lines on the chart.
Now we should determine the conditions and parameters of the opening BUY position.
// ==================================================================+
//                    Opening BUY positions                           +
// ==================================================================+
   if(OrdersTotal()<1) // we place one (or 2..3..etc.) orders
    {  //open a position
// ------------------------------------------------------------------+
   if(patternBuy==true)
    { //patternBuy
It would be better if the price range over the last 25 bars is at least 50 points.
Let us add additional conditions, e.g. a 150-period moving average over the last 24 or 48 hours (bars) will be directed downwards and the price will be 89 points lower away from this indicator (Fibo89s level).
 // 1st additional condition - price range over the last 25 bars is at least 50 points.
if((High[iHighest(Symbol(),Period(),MODE_HIGH,25,0)]-Low[iLowest(Symbol(),Period(),MODE_LOW,25,0)])>=50*Point)
  {// price range
   // 2nd additional condition e.g. if the price is lower than 89 pip below the level of Ma144 (MA of 12 squared)
  if(Bid<Ma144_1-89*Point &&       // price is lower than Fibo89s level
     (Ma144_1-Ma144_48)<0)         // Ma144 slope is negative
   {//2nd additional condition
The main condition for opening a position is crossing of the lateral pattern line by the price.
E.g. it may be as follows:
if((High[1]>PricePrL2_1b ||                          // Max of the candlestick is higher than the lateral projection of the 1st Bar
    Close[1]>PricePrL2_1b ||                         // any candlestick closed above the projection of the 1st Bar
    (Open[1]<Close[1] && Close[1]>PricePrL2_1b) ||   // white candlestick crossed the projection of the 1st Bar
    Bid>PricePrL2_1b) && Bid<PricePrL2_1b+3*Point)   // not higher than 3 pip of the price of the projection of the 1st Bar
   {
Further, we define the Stop Loss and Take Profit parameters. Set Stop Loss to be equal to the minimum price value over the interval from the "0" bar to the bar of the 2nd fractal, i.e. at the Low level of the 1st fractal. Set Take Profit at the level of 0.6 of the price range.
Since this strategy presupposes tracing by lower fractals of the uptrend, we will set Take Profit to be more than two minimum price ranges, e.g. 100 - 200 points.
  {// opening a Buy position.
   // Calculate Stop Loss as the Min price value over the interval from the "0" bar to the bar of the 2nd fractal.
  SL_B=(Bid-Low[iLowest(Symbol(),Period(),MODE_LOW,Vnf2,0)])/Point;
  if(SL_B<StopLevel) SL_B=Bid-(StopLevel+2)*Point; // if SL_B is less than StopLevel
  TP_B=120;
  Print("  OP_BUY Chuvashov's Fork","  VMF1 = ",VMF1," < ",PricePrH1_1f);
  Op_Buy_Ch();
  return;
  }//- opening a Buy position.
The search for the last three consecutive fractals lying along the uptrend is based on lower fractals and the entire process of making an upward pattern follows the logic of a pattern made on a downtrend.
//+=======================================================================+
//                   proceed to TRACING opened positions            +
//+=======================================================================+
for (i=OrdersTotal()-1; i>=0; i--)        // loop for selection of BUY orders
   {//loop for selection of positions Buy
  if(!OrderSelect(i, SELECT_BY_POS, MODE_TRADES))
    {Print("Order selection error = ", GetLastError()); }
   if(OrderType()==OP_BUY )                // if the Buy order is placed
    { //2-type_Buy
If an uptrend pattern has emerged while a BUY position was opened, it means that the price has turned around and started going down. The BUY position should be closed.
//+=======================================================================+
//|  Conditions for closing BUY positions                                     +
//+=======================================================================+
   if(patternSell==true)         //  a pattern for opening a Sell position emerged
    {
    Print(" closing the BUY position as the opposite pattern has emerged");
    Close_B_Ch();         // close the position SELL
    return;
    }
//+=======================================================================+
We pass on to modification of the open BUY position.
The modification process is divided into 3 stages. At the first stage, we draw Stop Loss closer to 'zero-loss'. At the second stage, when the price reaches a positive profit equal to or greater than Stop Loss, we move Stop Loss to the position opening level.
// ---- 1st stage ------------------------------------------ 1st stage ---+
    // The first modification stage: when the price reaches the profit
    // equal to the Stop Loss value, we move SL_B by 1/2 value of Stop Loss
    // i.e. closer to the position opening level. (+StopLevel)
   if((Bid-OrderOpenPrice())>SL_B*Point        // if the difference between the price and the opening value is >SL_B
       && OrderStopLoss()<OrderOpenPrice())    // and if Stop Loss is less than the position opening level.
    {// modif-1
     OrderModify(OrderTicket(),                // order #.
     OrderOpenPrice(),                         // opening price.
     OrderStopLoss()+(SL_B/2)*Point,           // New value of Stop Loss.
     OrderTakeProfit()+1*Point,                // New value of Take Profit.
     0,                                        // Deferred order expiration time.
     Red);                                     // Color of modification marks (dashes).
     return;
    }//-modif-1
// --- end of 1st stage -----------------------------------------------------+
// ---- 2nd stage ------------------------------------------ 2nd stage ---+
    // The second modification stage: when the price repeatedly reaches profit
    // equal to the Stop Loss value, we move SL_B to the 'zero-loss'
    // level, i.e. to the position opening level (+StopLevel).
   if((Bid-OrderOpenPrice())>SL_B*Point        // if the difference between the price and the position opening value is >SL_B
       && OrderStopLoss()<OrderOpenPrice())    // and if Stop Loss is less than the position opening level
    {// modif-1
     OrderModify(OrderTicket(),                // order #.
     OrderOpenPrice(),                         // opening price.
     OrderStopLoss()+(SL_B+StopLevel)*Point,   // New value of Stop Loss.
     OrderTakeProfit()+1*Point,                // New value of Take Profit.
     0,                                        // Deferred order expiration time.
     Magenta);                                 // Color of modification marks (dashes).
     return;
    }//-modif-1
// --- end of 2nd stage -----------------------------------------------------+
When the price reaches the profit of more than 1.5 times the Stop Loss value, we draw SL_B to the nearest lower fractal that should be higher than the preceding Stop Loss, and further along the ascending lower fractals of the uptrend.
// ---- 3rd stage --------------------------------------- 3rd stage ------+
   //  When the price reaches the profit of more than 1.5 times the Stop Loss value
   //  draw SL_B to the nearest lower fractal that should be higher than the preceding Stop Loss
   if((Bid-OrderOpenPrice())>=(SL_B+SL_B/2)*Point  // if the difference between the price and the opening value is >SL_B+SL_B/2
       && OrderStopLoss()>=OrderOpenPrice())       // and if Stop Loss is already at the 'zero-loss' level.
    {// modif2
     // move SL_B to the level of the nearest lower fractal,
     // for this purpose, find the nearest lower fractal:
    for (k=3;k<=24;k++)
     {//loop-M
     if(Low[k]<Low[k+1] && Low[k]<Low[k+2] && Low[k]<Low[k-1] && Low[k]<Low[k-2])
      { // fractal Low
      VlFl_L=Low[k];             // Min value of the nearest fractal
     if(VlFl_L>OrderStopLoss())  // fractal that should be higher than the preceding Stop Loss
      {// fractal higher than SL_B
      tim1_L=iTime(NULL,0,k);    // Time of this fractal
         ///  string Time1_L=TimeToStr(tim1_L,TIME_DATE|TIME_MINUTES);
         ///  Print("  Modif-2 ====== ","  Fractal = ","Frak"+k,VlFl_L,"  time = ",Time1_L);
      // shift Stop Loss to the formed lower fractal Min value level
      OrderModify(OrderTicket(),            // order #
      OrderOpenPrice(),                     // opening price
      VlFl_L+2*Point,                       // New value of Stop Loss. // in zero-loss
      OrderTakeProfit()+1*Point,            // New value of Take Profit.
      0,                                    // Deferred order expiration time.
      Aqua);                                // Color of Stop Loss and/or Take Profit modification arrows
      if(VlFl_L!=0)  break;                 // if the fractal is found, exit the loop
      return;
// --- end of 3rd stage ------------------------------------------------------+
Conclusion
A brief conclusion is that the introduced sample MTS yields about the same positive results when tested by different brokers.
The described technique can be used by traders as a trading system component. However it needs to be further developed in terms of filters for opening positions. The filters proposed herein above can be improved as recommended by the author of the technique Stanislav Chuvashov.
The recommendations can be found in 17 free lessons by Stanislav Chuvashov (in Russian).
Notes to the attached files:
- Fork_Ch_ExpertH1_v1.mq4 - MTS "Chuvashov's Fork
- Fork_Ch_MTS_v2.mq4 - MTS "Chuvashov's Fork" without comments in the program text.
Translated from Russian by MetaQuotes Ltd.
Original article: https://www.mql5.com/ru/articles/1352
Warning: All rights to these materials are reserved by MetaQuotes Ltd. Copying or reprinting of these materials in whole or in part is prohibited.
This article was written by a user of the site and reflects their personal views. MetaQuotes Ltd is not responsible for the accuracy of the information presented, nor for any consequences resulting from the use of the solutions, strategies or recommendations described.
 Getting Rid of Self-Made DLLs
 Econometrics EURUSD One-Step-Ahead Forecast
 Who Is Who in MQL5.community?
 How to publish a product on the Market
- Free trading apps
- Over 8,000 signals for copying
- Economic news for exploring financial markets
You agree to website policy and terms of use
The Trade Robot software is an automated order execution software that automatically places mechanical systems trades directly into your dealers trading platform without any human intervention.
http://RoboticTradingSystems. com