Kostenpflichtige technische Indikatoren für den MetaTrader 5 - 63
Entry Confirmation Indicator for MT5: Precision Trading for Volatility Indices The Entry Confirmation Indicator for MetaTrader 5 (MT5) is a powerful and versatile tool tailored specifically for traders who focus on volatility indices. Whether you're looking to capitalize on trend continuations or identify key reversal points, this indicator is designed to provide clear and actionable signals that enhance your trading strategy. Targeted Instruments: A Focus on Volatility This indicator is optimiz

HiperCube AutoTrend Lines Dieser Indikator hilft Ihnen, Unterstützung und Widerstand einfach zu identifizieren, Linien im Diagramm zu zeichnen und zu wissen, wo sich ein wichtiger Punkt auf dem Markt befindet. Dieses Tool ist die beste Möglichkeit, Ihren Handel halbautomatisch zu gestalten und einen Teil der Arbeit für Sie zu erledigen. Widerstand oder Unterstützung sind wichtige Niveaus, die manchmal schwer zu identifizieren sind, aber jetzt werden Sie dadurch nicht mehr verwirrt.
HiperCube
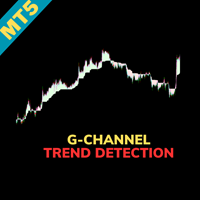
Indicator Name: G-Channel Trend Detection Overview: The G-Channel Trend Detection indicator offers a unique approach to trend analysis, leveraging AlexGrover's G-Channel methodology. This indicator provides a clear and simplified view of market trends by identifying bullish and bearish conditions based on price interactions with the G-Channel boundaries. Key Features: Trend-Based Market Analysis: The indicator determines trend direction by monitoring price action relative to the G-Channel bounda

CVD SmoothFlow Pro - Unbegrenzte Volumenanalyse für jedes Asset! CVD SmoothFlow Pro ist die ultimative Lösung für Trader, die eine präzise und unbegrenzte Volumenanalyse suchen. Mit der Berechnung des Cumulative Volume Delta (CVD) und fortschrittlicher Rauschfilterung bietet die Pro-Version die Flexibilität und Genauigkeit, die für den Handel mit jedem Finanzinstrument erforderlich sind. Was bietet CVD SmoothFlow Pro? Klarer Analyse : Filtert Marktrauschen und hebt signifikante Volumenbewe

Der Super Indicator ist eine umfassende Handelslösung, die auf neue und erfahrene Händler zugeschnitten ist. Es kombiniert über 5 Indikatoren, um Alarm zu geben
Signalklarheit: Bietet Pfeilsignale für klare Ein- und Ausstiegspunkte. Echtzeitwarnungen: Hält Händler mit Handelsein- und -ausstiegswarnungen auf dem Laufenden. Merkmale:
Kein Nachlackieren Maximale Aktivierungen 7+ Strategien 5 Indikatoren in einem Ein- und Ausstiegspunkte und Pfeile Benachrichtigungen per Telefon und E-Ma

DYJ SmoothedMA Strategy is a very simple but powerful system to get forex and s ynthetic market trend direction. This indicator is actually a moving average indicator containing 10 smoothing algorithms in a file . The indicator can help you to see the whole trend break out/rebound signal. And these BUY and SELL signals are sent out. You can use DYJ GameDevice follow-up software to receive these signals and realize automatic opening and closing of positions. And can use the game strategy fu

The Spike Forecaster SFD is a system that was developed to catch spikes, it simple to use, its just plug and play.
It will give both Buy Alerts and Sell Alerts through arrows white and red respectively.
The system was designed to make it easier for those traders who might be busy to analyse the market hence it will just give you simple alerts to know the direction of the market. Regards
Spike Forecaster

This is a early support and resistance indicator. It will allow you to choose how many candles back. You can use it on all timeframes. Change the color as you like. You can use it with other indicators for better entry prediction it will give you trend for bear market and bull market. It will help you predict sideways market trending market and falling market. Save trading
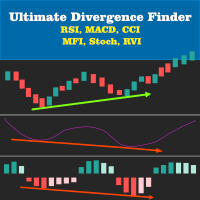
Multi Indicator Divergence Finder Enhance your trading strategy with the Multi Indicator Divergence Finder! This versatile tool is engineered to help traders quickly and accurately identify both regular and hidden divergences across multiple popular indicators simultaneously, including RSI, MACD, CCI, Stochastic, MFI, and RVI. Experience real-time divergence detection with signals plotted directly on your charts. Key Features: Simultaneous Multi-Indicator Divergence Detection : Detect regular an

Contact us to receive a comprehensive user guide after purchasing. Enhance your trading experience with the Hydra Trend Rider Indicator, meticulously designed by MQL5 silver award winning developer to provide you with unparalleled market insights and empower your decision-making process. This advanced tool is perfect for traders seeking precision and efficiency in their trading strategies. Join our MQL5 Channel Indicator Features: Multiple Timeframe Dashboard: Gain a comprehensive view of the
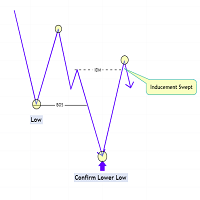
The Market Structure with Inducements & Sweeps indicator is a unique take on Smart Money Concepts related market structure labels that aims to give traders a more precise interpretation considering various factors.
Compared to traditional market structure scripts that include Change of Character (CHoCH) & Break of Structures (BOS) -- this script also includes the detection of Inducements (IDM) & Sweeps which are major components of determining other structures labeled on the chart.
SMC &

Previous Candle Levels MT5 shows the previous candle levels, it shows the previous candle Open High Low Close levels (OHLC Levels) in different time frame. It's designed to help the trader to analyse the market and pay attention to the previous candle levels in different time frame. We all know that the OHLC Levels in Monthly, Weekly and Daily are really strong and must of the time, the price strongly reacts at those levels. In the technical analysis, the user can use them as a support and res
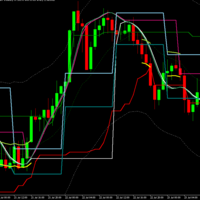
Mega Analyzer MT5 Indicator: A Comprehensive Trading Solution In the dynamic world of trading, having an edge can make all the difference. The "Mega Analyzer MT5 Indicator" offers traders that edge, providing a powerful tool that deciphers market movements with precision and clarity. Designed for both novice and experienced traders, this indicator is tailored to enhance decision-making and optimize trading strategies by revealing key price levels and market conditions that often go unnoticed by

VolumeSecret: Die Kraft des Volumens in Ihren Händen In der herausfordernden Welt der Programmierung stehen wir ständig vor Hindernissen, die uns zum Wachsen und Weiterentwickeln zwingen. Wir verstehen die Schwierigkeiten, die der Markt mit sich bringt, und wissen, wie Trader darum kämpfen, die bestmögliche Leistung zu erzielen. Deshalb arbeiten wir unermüdlich an innovativen Lösungen, um Entscheidungsprozesse im Markt reibungsloser und präziser zu gestalten. VolumeSecret ist das Ergebnis dieses
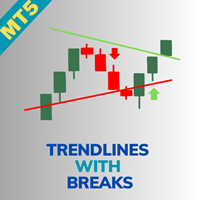
Indicator Name: Trendlines with Breaks [LuxAlgo] Overview: The Trendlines with Breaks [LuxAlgo] indicator provides traders with pivot point-based trendlines that highlight real-time breakouts. This tool is highly customizable, allowing users to adjust the steepness of trendlines, choose different slope calculation methods, and receive alerts on trendline breakouts. Key Features: Pivot Point-Based Trendlines: The indicator automatically generates trendlines based on pivot points, providing a clea

Buy Sell Storm
Professional indicator for trading on financial markets, designed for MT5 platform .
Trading on the indicator is very simple, Blue arrow to buy , Red arrow to sell.
The indicator does not redraw and does not change its values.
After purchase write to me and I will send you a Bonus in the form of an EA Buy Sell EA on this indicator.
( see the video of the EA on the indicator, the set file is attached).
In the default settings the Period parameter is set to -

Trendline Wizard Overview: The Trendline Wizard is a powerful and versatile MetaTrader 5 indicator designed for traders who rely on trendlines for their technical analysis. This indicator automatically monitors specified trendlines and provides real-time alerts when price action interacts with these critical levels. Whether you’re a swing trader, day trader, or long-term investor, the Trendline Wizard is an essential tool to enhance your trading strategy. Key Features: Customizable Alerts : Set

Überblick Der Multi Level ATR und Moving Average Band Indikator bietet eine umfassende Analyse von Preisbewegungen unter Berücksichtigung der Volatilität. Die visuelle Darstellung durch mehrere Bänder erleichtert die Identifizierung von Trend- und Konsolidierungsphasen sowie potenziellen Umkehrpunkten. Durch Anpassung der Parameter können Händler den Indikator auf ihre spezifischen Handelsbedürfnisse abstimmen. Funktionen Mehrere Bänder anzeigen: Preisniveaus auf der Basis von Hoch-, Mittel- und
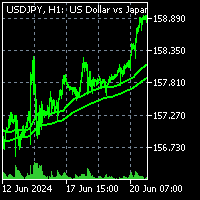
To get access to MT4 version please click here . This is the exact conversion from TradingView: "Liquidity Weighted Moving Averages" by "AlgoAlpha ". This is a light-load processing and non-repaint indicator. All input options are available expect time frame input . Buffers are available for processing in EAs. You can message in private chat for further information/changes you need. Thanks for downloading

TK - Rainbow Indikator Beschreibung: Der TK - Rainbow Indikator ist ein robustes Werkzeug für die technische Analyse, das entwickelt wurde, um durch einen mehrzeiligen Ansatz eine klare Sicht auf die Markttrends zu bieten. Mit 30 Linien, die in verschiedenen Zeiträumen berechnet werden, bietet er eine umfassende Analyse der Preisbewegungen. Der Indikator verwendet ein Zwei-Farben-Schema, um Aufwärts- und Abwärtstrends hervorzuheben, wodurch die Interpretation der Marktbedingungen auf einen Blick
Welcome to Tomas Lekim's Cube theory. The Theory is based on the calculation of the largest pattern existing in nature. A pattern that contains all other patterns and sequences. All patterns such as prime numbers, Fibonacci and other number sequences are contained in the universal mesh of my theory. It is possible to perceive the price pattern and the meeting between the two opposing forces that exist in the entire logic of negotiation and competition. .Games in which a team competes with anothe
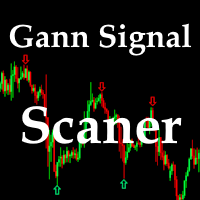
This indicator is based on the Gann Signal indicator and acts as a market scanner. All you need to do is fill in the selected currency pairs in the settings and that’s it. Next, the indicator itself will view all these currency pairs and time frames from M5 to D1 simultaneously. When a new signal appears, the indicator will give you an Alert and also draw the letter N where this new signal will be.

Ekom Spike Detector Pro
Take your trading to the next level with the Ekom Boom and Crash Spike Detector Indicator Pro, designed for serious traders who demand more. This advanced version provides: Key Features: - Accurate Spike Detection: Identify high-probability spike patterns in real-time using price action - Clear Visual Signals: Displays clear buy and sell arrows on the chart for easy decision-making - Customizable: easily change arrows and line colors and also select wether Boom or

1. What is this Due to the limitation of MT5 software, we can only see the minimum 1-minute candlestick chart. Sometimes this is not enough for high-frequency traders, or we want to see a more detailed candlestick chart. This tool allows you to see: A candlestick chart composed of N seconds, which allows you to better understand the price fluctuations. For example, each candle line has 20 seconds, or 30 seconds.
2. Parameters: SecondCandle = 20; // The second cnt for one candle, Need
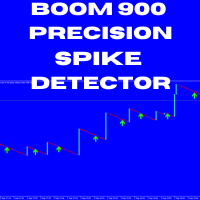
Boom 900 Precision Spike Detector The Boom 900 Precision Spike Detector is a powerful tool designed to help traders accurately identify spike opportunities in the Boom 900 market. With advanced features and precise alerts, this indicator takes the guesswork out of trading, enabling you to maximize your profits with confidence. Key Features: Non-Repainting Signals: Get reliable signals without repainting, ensuring your trading decisions are based on accurate, real-time data. Audible Alerts: Stay
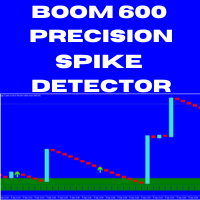
Boom 600 Precision Spike Detector The Boom 600 Precision Spike Detector is your ultimate tool for trading the Boom 600 market with precision and confidence. Equipped with advanced features, this indicator helps you identify potential buy opportunities and reversals, making it an essential tool for traders aiming to capture spikes with minimal effort. Key Features: Non-Repainting Signals: Accurate, non-repainting signals that you can trust for reliable trading decisions. Audible Alerts: Stay on t
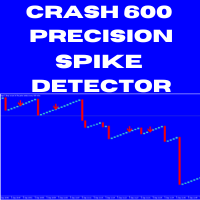
Crash 600 Precision Spike Detector The Crash 600 Precision Spike Detector is an essential tool designed to help traders navigate the Crash 600 market with accuracy and efficiency. Packed with advanced features, this indicator provides precise alerts that allow traders to capture spikes and reversals with confidence. Key Features: Non-Repainting Signals: Dependable, non-repainting signals that ensure your trading decisions are based on real-time, accurate data. Audible Alerts: Receive sound notif

In the context of trading, Malaysia SNR (Support and Resistance) refers to the technical analysis of support and resistance levels in financial markets, particularly for stocks, indices, or other assets traded. This is single timeframe version. Multiple timeframe version is avaiable here . There are three type of Malaysia SNR level Classic , GAP and Flipped 1. Classic Support is the price level at which an asset tends to stop falling and may start to rebound. It acts as a "floor" where demand is

Market Profile Introducing the Market Profile MetaTrader Indicator—your gateway to mastering market dynamics with precision and insight. This powerful tool delivers a classic Market Profile analysis, revealing price density over time and highlighting crucial levels, including the value area and control value for any trading session.
Compatible with timeframes from M1 to D1, it adapts to daily, weekly, monthly, or even intraday sessions, offering you unmatched flexibility. Lower timeframes pro
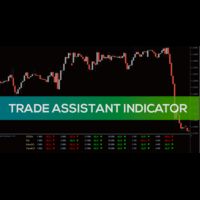
Trade Assistant Introducing the Trade Assistant MetaTrader Indicator—a revolutionary tool that brings clarity and precision to your trading strategy by seamlessly integrating three powerful indicators: the Stochastic Oscillator, RSI (Relative Strength Index), and CCI (Commodity Channel Index). This versatile, multi-timeframe indicator provides you with a comprehensive view of trend directions across every significant timeframe, from M1 to MN1. No matter which timeframe you choose to analyze, the

Imbalance DOM Pro: Maximieren Sie Ihre Handelsmöglichkeiten mit dem Ungleichgewicht im Orderbuch Chancen bei kleinen Preisbewegungen
Imbalance DOM Pro ist ein unverzichtbares Werkzeug für Analysten, die mit Orderflow handeln. Ideal für Scalper , wurde es entwickelt, um diejenigen zu unterstützen, die kleine Preisbewegungen mit hoher Präzision nutzen möchten. Durch fortschrittliche Berechnungen erkennt der Indikator Ungleichgewichte im Orderbuch und liefert wertvolle Signale für schnell

This is an advanced indicator used with success rate.Unlock the secrets of trading Boom and Crash spikes with our powerful MT5 indicator! This spike detection tool provides accurate buy and sell signals, trade alerts, and High success rate entries. Perfect for scalping, day trading, and swing trading. Get the best Boom and Crash strategy with our Deriv Boom and Crash spike indicator. Indicator does not redraw or repaint. Recommendation
· Use a Virtual Private Server (VPS) for 24/7 alerts on
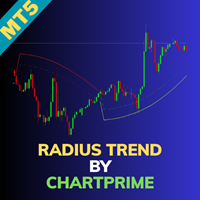
Radius Trend by ChartPrime Overview: The Radius Trend indicator is an advanced technical analysis tool designed to visualize market trends through an adaptive, radius-based method. With dynamic bands that react to price action and volatility, it offers traders a unique insight into trend strength, direction, and potential reversals. Unlike traditional trend lines, this indicator adjusts dynamically like a radius sweeping across the chart, creating a fluid approach to trend analysis. Key Features
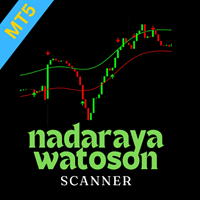
Nadaraya Watson Envelop Scanner Overview
The Nadaraya Watson Envelop Scanner is a powerful multi-symbol and multi-timeframe tool that enhances the functionality of the Nadaraya Watson Envelop indicator for MT5. By scanning across various symbols and timeframes, this scanner enables traders to detect key signals and trend reversals quickly and efficiently. Key Features Multi-Symbol & Multi-Timeframe Scanning: Automatically scans multiple symbols and timeframes to identify potential trade setups
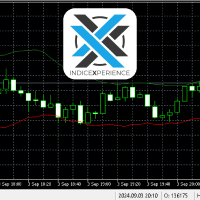
Indicador para mercado de Índice Futuro Brasileiro (WIN) __________________________________________________________________________________________________
O indicador trabalha com rompimento de canal indicando o sentido do movimento e os 3 possíveis TP e o SL baseado no ATR.
Indicação de utilização em TimeFrame de 5M, mas pode ser utilizado em qualquer tempo gráfico de sua preferencia. __________________________________________________________________________________________________

CVB Cumulative Volume Bands: Maximieren Sie Ihre Trades mit kumuliertem Volumen! Der CVB Cumulative Volume Bands ist ein fortschrittlicher Indikator, der für Trader entwickelt wurde, die präzise Signale auf Basis des kumulierten Volumens suchen. Durch die Nutzung von kumulierten Volumenbändern bietet dieser Indikator klare Einblicke in den Kauf- und Verkaufsdruck am Markt, um Umkehrungen und starke Kursbewegungen zu identifizieren. Hauptmerkmale: Analyse des kumulierten Volumens :

This indicator is one of our first brilliant programs, the indicator is quite useful and seems to give the best results when combined with price action, and a combination of oscillators , mainly the Bollinger bands and the moving average , you can also use this on all time frames but be careful on the lower time-frames as the trend is not too steady or rather moves fast, this will help you have better entries.

This is one of our best products available on the market, it will work with every pair you can think of, this ea works together hand in hand with the trend and support and resistance strategy , it will work with all the timeframes and all oscillators , this will amaze you on how best it works and makes trading a whole lot easier you can use this with the rsi oscillator for best results.
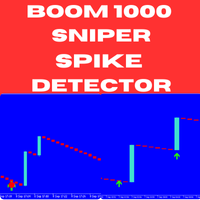
Boom and Crash Sniper Spike Detector - Boom 1000 The Boom and Crash Sniper Spike Detector is the ultimate tool for spike trading on Boom 1000, offering clear and reliable signals to help you capture high-probability trades. This advanced indicator is designed to enhance your trading strategy by simplifying spike detection and maximizing your profits. Key Features: Multi-Timeframe Compatibility : The indicator can be used on M1, M5, M15, M30, and H1 timeframes, but it works best on the M1 timefra
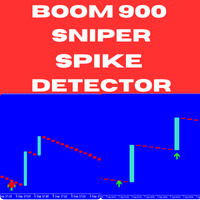
Boom and Crash Sniper Spike Detector - Boom 900 Unlock the potential of spike trading on Boom 900 with the Boom and Crash Sniper Spike Detector. This cutting-edge indicator provides precise and clear signals, helping you identify high-probability trades and capture spikes effortlessly. Designed for traders who want to enhance their trading performance, this tool simplifies the process of detecting spike opportunities. Key Features: Multi-Timeframe Compatibility : The indicator works across multi

This is Multiple Timeframe of Malaysia SNR Levels and Storyline. The single timeframe version here Features: + Display level on multiple timeframe (higher or lower) + Turn on/off level on timeframe + Alert when price touch level 1. if high > resistance level but close of candle < resistance level , this level become unfresh - Name of level will have "(m)" meaning mitigated if close of candle > resistance level , this level become invalid and can be removed in chart (there is setting for keep/rem
ZigZag function
The first zigzag was proposed by Arthur A. Merrill in 1977 and is based on the vertical axis (price range %). The second zigzag is based on the horizontal axis (period), which is widely known in MT4 and MT5. this is the third zigzag designed from a completely new perspective. However, it is not based on originality, but on more fundamental theory.
First, I created the smallest zigzag 0. I bundled zigzag 0 together in accordance with Dow Theory to create zigzag 1. I bundled

CustomRSI50 Alert and Mail at Cross Indikator CustomRSI50 Alert and Mail at Cross Indikator Beschreibung Der CustomRSI50 Alert and Mail at Cross Indikator ist ein fortschrittlicher technischer Indikator, der auf dem beliebten Relative Strength Index (RSI) basiert. Er wurde entwickelt, um den automatisierten Handel zu vereinfachen, indem sofortige Benachrichtigungen über Alarme und E-Mails gesendet werden, wenn der RSI-Wert die Schwelle von 50 überschreitet. Der Indikator bietet eine klare und an

BotM5 MT5
Exact entry points for currencies, crypto, metals, stocks, indices!
Indicator 100% does not repaint!!!
If a signal appeared, it does not disappear! Unlike indicators with redrawing, which lead to loss of deposit, because they can show a signal, and then remove it.
Trading with this indicator is very easy.
Wait for a signal from the indicator and enter the deal, according to the arrow
(Aqua arrow - Buy, Red - Sell).
Indicator parameters:
Deviation - 4 (you c
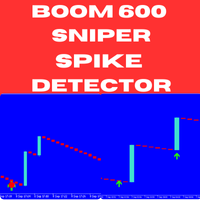
Boom 600 Sniper Spike Detector - MQL5 Listing Description Introducing the Boom 600 Sniper Spike Detector – a cutting-edge, non-repainting indicator designed to help you effectively capitalize on spikes in the Boom 600 market. Ideal for both seasoned traders and beginners, this indicator offers precise, actionable signals to enhance your trading strategy and maximize your profit potential. Key Features: Non-Repainting Signals : Guarantees reliable and consistent signals that do not repaint, provi
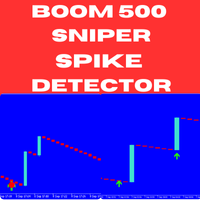
Introducing the Boom 500 Sniper Spike Detector – an advanced, non-repainting indicator specifically crafted to help you capture spikes in the Boom 500 market with precision. Whether you are an experienced trader or just starting, this indicator provides reliable signals that simplify spike trading, making it an essential addition to your trading arsenal. Key Features: Non-Repainting Signals : The Boom 500 Sniper Spike Detector generates highly reliable signals that do not repaint, allowing you t
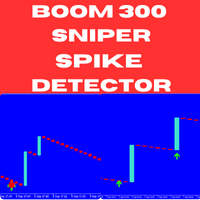
Introducing the Boom 300 Sniper Spike Detector – a powerful, non-repainting indicator specifically engineered to help you master spike trading in the Boom 300 market. Whether you're a seasoned trader or new to the game, this tool offers precise and timely signals, allowing you to catch spikes with confidence and improve your overall trading performance. Key Features: Non-Repainting Signals : Ensures consistent and accurate signals that do not repaint, providing you with reliable data to make con
Smart Fractals Indicator - Ein erweitertes Fraktal für Ihr Trading auf MT5 Der Smart Fractals ist die Weiterentwicklung des klassischen Fraktal-Indikators, den Sie auf Ihren Charts kennen und verwenden. Speziell für MetaTrader 5 entwickelt, identifiziert dieser Indikator nicht nur klassische Marktumkehrpunkte, sondern geht darüber hinaus und macht Ihr Trading effizienter und rentabler. Wir haben das Grundkonzept der Fraktale genommen und es in ein intelligenteres und funktionaleres Werkzeug verw

The Super Trend Extended Indicator is a powerful tool designed to assist traders in identifying market trends and making informed trading decisions. It combines a robust trend-following algorithm with advanced filtering options to provide precise entry and exit signals. Key Features: Trend Identification : The indicator effectively highlights the current market trend, whether bullish or bearish, helping traders stay on the right side of the market. Customizable Parameters : Users can adjust sens

This indicator managge all kind of ICT FVG include: FVG, SIBI, BISI, Inverse FVG. The advantage point of this indicator is mangage FVG on all timeframe. FVG - Fair value gap ICT Fair value gap is found in a “three candles formation” in such a way that the middle candle is a big candlestick with most body range and the candles above & below that candle are short and don’t completely overlap the body of middle candle. * This indicator allow filter FVG by ATR. So you can just show valid FVG which
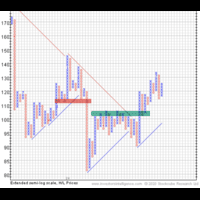
Point-and-Figure MetaTrader 5 indicator is an indicator that can plot a point-and-figure chart directly in the main window of your normal MT5 chart. You can set up all the point-and-figure method parameters, such as the box size and the reversal distance, according to your preference. In addition, you can control all the display parameters of the PnF chart. This point-and-figure indicator supports all sorts of alerts. It is based on real ticks data, and thus is available only for MT5. Point-an
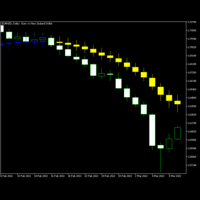
Moving Average Candlesticks MetaTrader indicator — is a chart visualization of a standard moving average using the candlestick bars. It draws the candlesticks based on the moving average values calculated for Close, Open, Low, and High. It allows seeing a compact snapshot of the more detailed market information compared with the classic MA indicator. It works with any currency pair, timeframe, and MA mode. The indicator is available for MT4 and MT5. Input parameters MAPeriod (default = 10
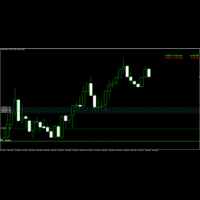
Breakeven Line Indicator is a MetaTrader indicator that calculates breakeven level based on all open positions and displays it on your chart as a horizontal line. Additionally, it will calculate the total number trades, the total number of lots, and the distance to the breakeven line in points and profit/loss. The indicator is available for both MT4 and MT5. You can press the Shift + B keyboard shortcut to hide or show the breakeven line. The indicator supports multiple input parameters to

ZigWave Oscillator: Optimieren Sie Ihre Trades mit Oszillatoren und ZigZag! Der ZigWave Oscillator ist das perfekte Werkzeug für Trader, die Präzision und Klarheit bei der Analyse des Finanzmarkts suchen. Dieser Indikator kombiniert die Stärke der Oszillatoren mit der visuellen Einfachheit von ZigZag und hilft Ihnen, die besten Kauf- und Verkaufsgelegenheiten schnell und effizient zu identifizieren. Warum den ZigWave Oscillator wählen? Präzise Oszillatoranalyse : Integrieren Sie RSI, W
Daily Performance Tracker (MetaTrader indicator) calculates the currency rate change relative to the previous day's close and displays it as a percentage in the main chart window. It also offers the option to show weekly and monthly percentage changes. You can customize colors to differentiate between positive and negative price movements. Additionally, a small, customizable arrow visually indicates the price direction. If your broker operates in a non-standard time zone, the Time Shift paramete

Attention all Boom and Crash traders! Elevate your market monitoring with the cutting-edge RSI indicator, Market Watch . - Customize alert settings for periods, volatility thresholds, and price spikes - Receive voice notifications when your targets are hit - Seamless integration with MetaTrader5 for real-time data
The indicator works on all five Boom and Crash Markets!
Default settings: Number of timeframes: Timeframe 1 - True Timeframe 2 - True Timeframe 3 - True Timeframe 4 - True Timefra

CBT Quantum Maverick Hocheffizientes binäres Gewinnsystem
CBT Quantum Maverick ist ein fein abgestimmtes, leistungsstarkes Handelssystem für binäre Optionen, das für Händler entwickelt wurde, die Präzision, Einfachheit und zuverlässige Gewinne suchen. Es ist keine Anpassung erforderlich – dieses System ist sofort nach der Installation für die besten Ergebnisse optimiert.
Hauptfunktionen:
- Zwei Modi der Signalpräzision: - „Neuzeichnen zulassen“-Modus: Bietet Signale im Voraus, sodass Sie

With this indicator, you can predict future price behavior for a certain number of bars ahead, giving you the ability to anticipate market dynamics. The indicator draws a forecast line , which models potential future price values based on sophisticated algorithms analyzing past data. This information can be leveraged not only for market entry and exit decisions but also for setting or adjusting stop-loss levels to better manage your positions. Application of the Forecast The data provided by the

TD Sequential Scanner: An Overview The TD Sequential scanner is a powerful technical analysis tool designed to identify potential price exhaustion points and trend reversals in financial markets. Developed by Tom DeMark, this method is widely used by traders to gauge market cycles and potential turning points with precision. How It Works: Sequential Count: The core of the TD Sequential indicator is its sequential counting mechanism. The scanner identifies a sequence of price bars where each ba

Fractal Indicator Strategy is an advanced MetaTrader 5 indicator specifically designed for traders who use fractal analysis in their strategies. This indicator provides an essential tool for marking key levels on the chart with horizontal lines, making it easier to identify and follow fractal patterns in the market. Key Features: Fractal Horizontal Lines: Automatically draws horizontal lines at customizable intervals in pips, based on key levels essential for fractal analysis. These horizontal

For support, visit cc.inni.cc where you will also find our Knowledge library and FAQ. PATHFINDER TREND is a complex, yet easy to manage trend indicator. It has various features that can aid in your decision making and boost your performance accuracy. Patfhinder Trend is a visually comfortable and user friendly tool that you should keep on your trading desk.
Key features Signal Detection & Trend Analysis Visually clear and decisive Early indication of signal direction with arrows Confirmed s

This is the best indicator we have created by far, this indicator replicates the well known heiken ashi indicator, but with a more precise entry point, this indicator can work on all time-frames and is strong on all the time frames , this indicator does not repaint nor does it lag , this indicator strategy combined with price action will change your trading experience , elevate your experience to the next level.

This is best binary signal indicator for 1 minute expiry on 1 minute chart window. Buy and Sell arrows appear on previous candle. This is best momentum candle strategy in all markets. Important = Use martingale (if you are not aware of martingale system then first search martingale and learn it ) all forex ___indexs___companies___all timeframes best for binary trading style Thank you...............

Dieser MACD (Moving Average Convergence Divergence) Indikator hat folgende Eigenschaften: Separates Fenster: Wird unter dem Hauptchart angezeigt. MACD-Linie: Blaue Linie, die den Unterschied zwischen schnellem und langsamem EMA zeigt. Signallinie: Rote Linie, die den SMA der MACD-Linie zeigt. Histogramm: Graues Histogramm, das den Unterschied zwischen MACD- und Signallinie zeigt. Kauf-/Verkaufssignale: Grüne (Kauf) und rote (Verkauf) Pfeile an Schnittpunkten. Nulllinie: Graue gepunktete Linie,
Looking for EA to automate your trading strategy on the Forex market? TrendRocWaves Oscillator — your faithful companion in the world of trading! This manual trading system offers unique features:
- works exclusively on an hour(H1) timeframe for instant response to market changes. - uses the most popular and liquid currency pairs such as EURJPY, EURGBP, EURUSD, GBPUSD and USDCAD with minimal spreads and fast transaction execution. - applies a scalping method based on a medium-term trend to ac

JsTrader: Connect MetaTrader 5 with JavaScript JsTrader provides an easy, drag-and-drop solution to connect your JavaScript strategies with MetaTrader 5 (MT5). Using a socket-based communication, your JavaScript script (client) interacts with the MT5 EA (server). It’s tested for real-time trading, enabling fast and efficient integration without the need for both to run on the same computer. Full documentation, including the JavaScript script, EA files, and examples, is available on our GitHub.
Produktübersicht Dieser MetaTrader 5 Preisalarm-Indikator hilft Händlern, Kursbewegungen mühelos zu überwachen. Er zeichnet eine horizontale Linie auf einem vom Benutzer festgelegten Niveau und warnt, wenn der Kurs über oder unter diesem Niveau schließt. Händler können die Alarmbedingungen anpassen, was es einfacher macht, wichtige Preisniveaus im Blick zu behalten, ohne den Markt ständig beobachten zu müssen. Hauptmerkmale Anpassbare Alarmebenen : Legen Sie ein bestimmtes Preisniveau fest, bei

This multi-currency annual dashboard analyzes the nearest high and low to the current price for a chosen number of recent years. It displays how many pips away the price is from the nearest high or low. You can set a pip threshold, and the alert will notify you when the price gets close to the specified levels. In real-time, the dashboard also provides an overview of the closest high or low values for each specific year, helping you make informed trading decisions.

Key level analysis : The indicator tracks the nearest annual high and low to the current price over a chosen number of years. Proximity alerts : It triggers an alert when the price reaches a specified number of pips from the nearest high or low. Customizable notification intervals : You can set how often alerts repeat, for example, every 30 minutes. Historical perspective : Enables long-term tracking of market levels and effective planning of trading strategies. Multi-currency support : This ind
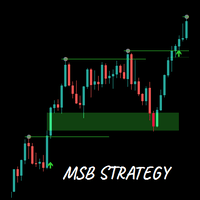
Capitalized on market structure and price gaps
The MSB Strategy indicator identifies swing highs and lows, detects high probability breakouts and price gaps (better knows as FVGs) which when price retests offer high probability entries. The indicator will draw an arrow to mark breakouts and when detected draw a rectangle FVG zone which you can use to define high probability entries. The 200 EMA is included to filter out noise and false signals. Summary of features Alerts on market structure br
MetaTrader Market - der einzige Shop, in dem man Handelsroboter als Demoversion herunterladen und testen sowie anhand historischer Daten optimieren kann.
Lesen Sie die Beschreibung und Bewertungen anderer Kunden über das gewünschte Produkt, laden Sie es direkt ins Terminal herunter und erfahren Sie, wie man einen Handelsroboter vor dem Kauf testet. Nur bei uns können Sie ein Programm testen, ohne dafür zu bezahlen.
Sie verpassen Handelsmöglichkeiten:
- Freie Handelsapplikationen
- Über 8.000 Signale zum Kopieren
- Wirtschaftsnachrichten für die Lage an den Finanzmärkte
Registrierung
Einloggen
Wenn Sie kein Benutzerkonto haben, registrieren Sie sich
Erlauben Sie die Verwendung von Cookies, um sich auf der Website MQL5.com anzumelden.
Bitte aktivieren Sie die notwendige Einstellung in Ihrem Browser, da Sie sich sonst nicht einloggen können.