YouTubeにあるマーケットチュートリアルビデオをご覧ください
ロボットや指標を購入する
仮想ホスティングで
EAを実行
EAを実行
ロボットや指標を購入前にテストする
マーケットで収入を得る
販売のためにプロダクトをプレゼンテーションする方法
MetaTrader 5のための有料のテクニカル指標 - 63
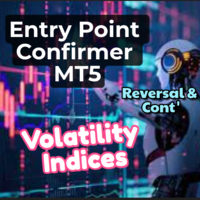
Entry Confirmation Indicator for MT5: Precision Trading for Volatility Indices The Entry Confirmation Indicator for MetaTrader 5 (MT5) is a powerful and versatile tool tailored specifically for traders who focus on volatility indices. Whether you're looking to capitalize on trend continuations or identify key reversal points, this indicator is designed to provide clear and actionable signals that enhance your trading strategy. Targeted Instruments: A Focus on Volatility This indicator is optimiz

HiperCube AutoTrend Lines このインジケーターは、サポートとレジスタンスを簡単に識別し、チャートにラインを描画して、市場の重要なポイントがどこにあるかを知るのに役立ちます。 このツールは、取引を半自動化し、作業の一部をあなたに代わって行うための最良の方法です。 レジスタンスまたはサポートは、識別が難しい場合がある重要なレベルですが、これで混乱がなくなります。
HiperCube Autotrends は、あらゆる時間枠向けに設計されています。 あらゆる種類の戦略、スキャルピング、スイング、日中取引... すべての市場、Forex、コモディティ、インデックス、暗号通貨... XAU、EURUSD、BTC、US30 など、お好きな場所で使用できます。 ChatgptとAIが開発に使用されました アカウント: お好きな場所で、リアルまたはデモで使用できます。 どのような種類のアカウントでもネットまたはヘッジが有効です
機能 使いやすい 便利なオプションが揃っています レジスタンスラインとサポートラインをカスタマイズ
推奨事項 他の指標や分析と組み合わせて
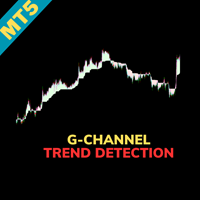
Indicator Name: G-Channel Trend Detection Overview: The G-Channel Trend Detection indicator offers a unique approach to trend analysis, leveraging AlexGrover's G-Channel methodology. This indicator provides a clear and simplified view of market trends by identifying bullish and bearish conditions based on price interactions with the G-Channel boundaries. Key Features: Trend-Based Market Analysis: The indicator determines trend direction by monitoring price action relative to the G-Channel bounda

CVD SmoothFlow Pro - すべての資産に対応した無制限のボリューム分析! CVD SmoothFlow Pro は、精密で無制限のボリューム分析を求めるトレーダーに最適なソリューションです。Cumulative Volume Delta(CVD)の計算と高度なノイズフィルタリングを使用することで、プロ版はあらゆる金融資産の取引に必要な柔軟性と精度を提供します。 CVD SmoothFlow Pro が提供するもの: クリアな分析 :ノイズをフィルタリングし、すべての金融資産における重要なボリュームの動きを際立たせます。 ️ 正確な計算 :買いと売りの差を監視し、外為、インデックス、暗号通貨などの資産におけるボリュームの詳細な動きを提供します。 直感的なインターフェース :データの表示が明確で、分析がわかりやすく効率的です。 トレンドの特定 :市場のトレンドを自信を持って特定し、情報に基づいた意思決定をサポートします。 実用的な用途: リアルタイムで任意の資産における買い手と売り手のバランスを監視します。 ボリュームに基づいてトレンドの反転

スーパー インジケーターは、初心者および経験豊富なトレーダー向けに調整された包括的な取引ソリューションです。 5つ以上のインジケーターを組み合わせて警告を発します 信号の明瞭さ: 明確な入口と出口の矢印信号を提供します。 リアルタイムアラート: 取引のエントリーおよびエグジットのアラートでトレーダーに最新の情報を提供します。 特徴: 無再塗装 最大アクティベーション数 7 つ以上の戦略 5つのインジケーターがひとつに 入口と出口のポイントと矢印 電話やメールでのアラート 推奨事項: 通貨とペア: EURUSD、AUDUSD、NZDUSD、XAUUSD (金)、BTC、SYNTHETIC: ブーム/暴落/ステップ、ボラティリティ... 期間: 常時 Sūpā injikētā wa, shoshinsha oyobi keiken hōfuna torēdā-muke ni chōsei sa reta hōkatsu-tekina torihiki soryūshondesu. Itsutsu ijō no injikētā o kumiawasete keikoku o hassh

DYJ SmoothedMA Strategy is a very simple but powerful system to get forex and s ynthetic market trend direction. This indicator is actually a moving average indicator containing 10 smoothing algorithms in a file . The indicator can help you to see the whole trend break out/rebound signal. And these BUY and SELL signals are sent out. You can use DYJ GameDevice follow-up software to receive these signals and realize automatic opening and closing of positions. And can use the game strategy fu

The Spike Forecaster SFD is a system that was developed to catch spikes, it simple to use, its just plug and play.
It will give both Buy Alerts and Sell Alerts through arrows white and red respectively.
The system was designed to make it easier for those traders who might be busy to analyse the market hence it will just give you simple alerts to know the direction of the market. Regards
Spike Forecaster

This is a early support and resistance indicator. It will allow you to choose how many candles back. You can use it on all timeframes. Change the color as you like. You can use it with other indicators for better entry prediction it will give you trend for bear market and bull market. It will help you predict sideways market trending market and falling market. Save trading
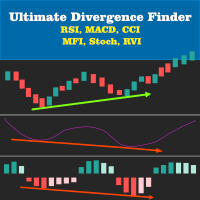
Multi Indicator Divergence Finder Enhance your trading strategy with the Multi Indicator Divergence Finder! This versatile tool is engineered to help traders quickly and accurately identify both regular and hidden divergences across multiple popular indicators simultaneously, including RSI, MACD, CCI, Stochastic, MFI, and RVI. Experience real-time divergence detection with signals plotted directly on your charts. Key Features: Simultaneous Multi-Indicator Divergence Detection : Detect regular an

Contact us to receive a comprehensive user guide after purchasing. Enhance your trading experience with the Hydra Trend Rider Indicator, meticulously designed by MQL5 silver award winning developer to provide you with unparalleled market insights and empower your decision-making process. This advanced tool is perfect for traders seeking precision and efficiency in their trading strategies. Join our MQL5 Channel Indicator Features: Multiple Timeframe Dashboard: Gain a comprehensive view of the
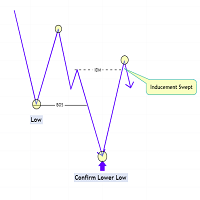
The Market Structure with Inducements & Sweeps indicator is a unique take on Smart Money Concepts related market structure labels that aims to give traders a more precise interpretation considering various factors.
Compared to traditional market structure scripts that include Change of Character (CHoCH) & Break of Structures (BOS) -- this script also includes the detection of Inducements (IDM) & Sweeps which are major components of determining other structures labeled on the chart.
SMC &

Previous Candle Levels MT5 shows the previous candle levels, it shows the previous candle Open High Low Close levels (OHLC Levels) in different time frame. It's designed to help the trader to analyse the market and pay attention to the previous candle levels in different time frame. We all know that the OHLC Levels in Monthly, Weekly and Daily are really strong and must of the time, the price strongly reacts at those levels. In the technical analysis, the user can use them as a support and res
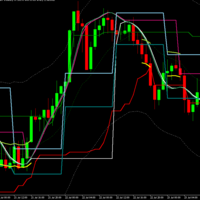
Mega Analyzer MT5 Indicator: A Comprehensive Trading Solution In the dynamic world of trading, having an edge can make all the difference. The "Mega Analyzer MT5 Indicator" offers traders that edge, providing a powerful tool that deciphers market movements with precision and clarity. Designed for both novice and experienced traders, this indicator is tailored to enhance decision-making and optimize trading strategies by revealing key price levels and market conditions that often go unnoticed by

VolumeSecret:あなたの手にあるボリュームの力 困難なプログラミングの世界では、私たちは常に成長と進化を促す障害に直面しています。市場が課す困難や、トレーダーが最高のパフォーマンスを達成するために奮闘する姿を深く理解しています。そのため、市場での意思決定をよりスムーズかつ正確にするための革新的なソリューションの開発に尽力しています。 VolumeSecret はこの献身の結晶です。この高度なインディケーターは、ボリューム分析と洗練された戦略を組み合わせ、市場を支配しようとする人々に決定的なアドバンテージを提供します。 VolumeSecretとは? VolumeSecret は、価格変動の背後に隠された秘密を明らかにするために設計された最先端のテクニカルインディケーターです。ボリューム分析をコンパスとして使用し、エントリーとエグジットの機会を高精度で特定します。フラクタル幾何学とボリュームを組み合わせることで、市場の動きを深く詳細に読み解くことができます。 VolumeSecretのメリット 深いボリューム分析: 機関投資家の動きや隠れた市場フローを特定。 正確な
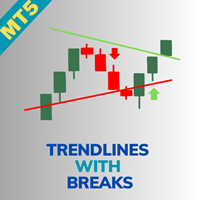
Indicator Name: Trendlines with Breaks [LuxAlgo] Overview: The Trendlines with Breaks [LuxAlgo] indicator provides traders with pivot point-based trendlines that highlight real-time breakouts. This tool is highly customizable, allowing users to adjust the steepness of trendlines, choose different slope calculation methods, and receive alerts on trendline breakouts. Key Features: Pivot Point-Based Trendlines: The indicator automatically generates trendlines based on pivot points, providing a clea

Buy Sell Storm
Professional indicator for trading on financial markets, designed for MT5 platform .
Trading on the indicator is very simple, Blue arrow to buy , Red arrow to sell.
The indicator does not redraw and does not change its values.
After purchase write to me and I will send you a Bonus in the form of an EA Buy Sell EA on this indicator.
( see the video of the EA on the indicator, the set file is attached).
In the default settings the Period parameter is set to -

Trendline Wizard Overview: The Trendline Wizard is a powerful and versatile MetaTrader 5 indicator designed for traders who rely on trendlines for their technical analysis. This indicator automatically monitors specified trendlines and provides real-time alerts when price action interacts with these critical levels. Whether you’re a swing trader, day trader, or long-term investor, the Trendline Wizard is an essential tool to enhance your trading strategy. Key Features: Customizable Alerts : Set

概要 ATRマルチレベルおよび移動平均バンドインジケーターは、トレーダーが市場のトレンド、サポートおよびレジスタンスレベル、ボラティリティを特定するのを支援する強力なツールです。このインジケーターは、価格変動の周りにビジュアルバンドを作成するために、複数の移動平均とATR(平均真の範囲)乗数を組み合わせています。これにより、トレーダーは潜在的な反転ポイント、トレンド条件、および市場の統合ゾーンを検出するのに役立ちます。 特徴 複数バンドの視覚化: トレンドを簡単に識別するために、赤、オレンジ、黄色、緑、青、紫などの異なる色で、6つの動的バンドを表示します。 ATRボラティリティバンド: 市場のボラティリティに基づいてバンドのグラフを調整し、反転または価格の継続の可能性について明確な視覚的信号を提供します。 カスタマイズ可能なパラメーター: ATR乗数と移動平均の期間を調整可能で、市場の異なる条件やトレーディング戦略に適応します。 トレンドの明確な識別: バンドはボラティリティに応じて拡張および収縮し、トレーダーがトレンド、統合期間、および潜在的なブレイクポイントを簡単に視認できます。
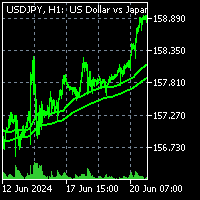
To get access to MT4 version please click here . This is the exact conversion from TradingView: "Liquidity Weighted Moving Averages" by "AlgoAlpha ". This is a light-load processing and non-repaint indicator. All input options are available expect time frame input . Buffers are available for processing in EAs. You can message in private chat for further information/changes you need. Thanks for downloading

TK - Rainbow インジケーター 説明: TK - Rainbow インジケーターは、複数のラインアプローチを通じて市場のトレンドを明確に表示するために設計された強力なテクニカル分析ツールです。異なる期間で計算された30本のラインを使用して、価格の動きの広範な分析を提供します。このインジケーターは、上昇トレンドと下降トレンドを際立たせるために二色スキームを使用しており、市場の状況を一目で簡単に解釈できます。 主な特徴: 30本のライン: 各ラインは異なる平滑化期間を表し、広範な市場トレンドをカバーします。 二色スキーム: 上昇トレンド(寒色)と下降トレンド(暖色)を区別するために二色を使用します。 カスタマイズ可能な設定: トレードの好みに合わせてラインの幅、スタイル、ステップサイズを調整できます。 TK - Rainbowの使い方: インジケーターの適用: TK - Rainbow インジケーターをMetaTrader 5のインジケーターリストからチャートに追加します。 パラメーターの設定: ステップ (inpStep): 各ライン間の期間の増分を定義します。これを調整してラ
Welcome to Tomas Lekim's Cube theory. The Theory is based on the calculation of the largest pattern existing in nature. A pattern that contains all other patterns and sequences. All patterns such as prime numbers, Fibonacci and other number sequences are contained in the universal mesh of my theory. It is possible to perceive the price pattern and the meeting between the two opposing forces that exist in the entire logic of negotiation and competition. .Games in which a team competes with anothe
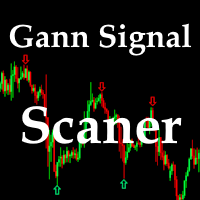
This indicator is based on the Gann Signal indicator and acts as a market scanner. All you need to do is fill in the selected currency pairs in the settings and that’s it. Next, the indicator itself will view all these currency pairs and time frames from M5 to D1 simultaneously. When a new signal appears, the indicator will give you an Alert and also draw the letter N where this new signal will be.

Ekom Spike Detector Pro
Take your trading to the next level with the Ekom Boom and Crash Spike Detector Indicator Pro, designed for serious traders who demand more. This advanced version provides: Key Features: - Accurate Spike Detection: Identify high-probability spike patterns in real-time using price action - Clear Visual Signals: Displays clear buy and sell arrows on the chart for easy decision-making - Customizable: easily change arrows and line colors and also select wether Boom or

1. What is this Due to the limitation of MT5 software, we can only see the minimum 1-minute candlestick chart. Sometimes this is not enough for high-frequency traders, or we want to see a more detailed candlestick chart. This tool allows you to see: A candlestick chart composed of N seconds, which allows you to better understand the price fluctuations. For example, each candle line has 20 seconds, or 30 seconds.
2. Parameters: SecondCandle = 20; // The second cnt for one candle, Need
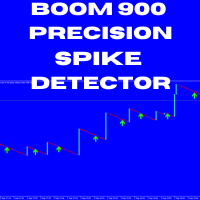
Boom 900 Precision Spike Detector The Boom 900 Precision Spike Detector is a powerful tool designed to help traders accurately identify spike opportunities in the Boom 900 market. With advanced features and precise alerts, this indicator takes the guesswork out of trading, enabling you to maximize your profits with confidence. Key Features: Non-Repainting Signals: Get reliable signals without repainting, ensuring your trading decisions are based on accurate, real-time data. Audible Alerts: Stay
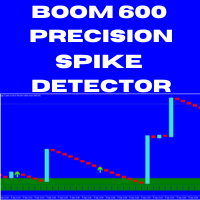
Boom 600 Precision Spike Detector The Boom 600 Precision Spike Detector is your ultimate tool for trading the Boom 600 market with precision and confidence. Equipped with advanced features, this indicator helps you identify potential buy opportunities and reversals, making it an essential tool for traders aiming to capture spikes with minimal effort. Key Features: Non-Repainting Signals: Accurate, non-repainting signals that you can trust for reliable trading decisions. Audible Alerts: Stay on t
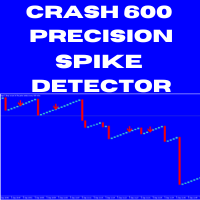
Crash 600 Precision Spike Detector The Crash 600 Precision Spike Detector is an essential tool designed to help traders navigate the Crash 600 market with accuracy and efficiency. Packed with advanced features, this indicator provides precise alerts that allow traders to capture spikes and reversals with confidence. Key Features: Non-Repainting Signals: Dependable, non-repainting signals that ensure your trading decisions are based on real-time, accurate data. Audible Alerts: Receive sound notif

In the context of trading, Malaysia SNR (Support and Resistance) refers to the technical analysis of support and resistance levels in financial markets, particularly for stocks, indices, or other assets traded. This is single timeframe version. Multiple timeframe version is avaiable here . There are three type of Malaysia SNR level Classic , GAP and Flipped 1. Classic Support is the price level at which an asset tends to stop falling and may start to rebound. It acts as a "floor" where demand is

Market Profile Introducing the Market Profile MetaTrader Indicator—your gateway to mastering market dynamics with precision and insight. This powerful tool delivers a classic Market Profile analysis, revealing price density over time and highlighting crucial levels, including the value area and control value for any trading session.
Compatible with timeframes from M1 to D1, it adapts to daily, weekly, monthly, or even intraday sessions, offering you unmatched flexibility. Lower timeframes pro
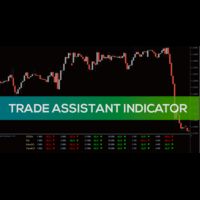
Trade Assistant Introducing the Trade Assistant MetaTrader Indicator—a revolutionary tool that brings clarity and precision to your trading strategy by seamlessly integrating three powerful indicators: the Stochastic Oscillator, RSI (Relative Strength Index), and CCI (Commodity Channel Index). This versatile, multi-timeframe indicator provides you with a comprehensive view of trend directions across every significant timeframe, from M1 to MN1. No matter which timeframe you choose to analyze, the

Imbalance DOM Pro: 注文簿の不均衡で取引を強化 小さな価格変動の機会
Imbalance DOM Pro は、 注文フロー で取引するアナリストにとって必須のツールです。 スキャルパー に最適で、価格の小さな変動を高精度で捉えたい方に最適です。高度な計算を用いて、 注文簿 の不均衡を特定し、迅速なエントリーとイグジットのための貴重なシグナルを提供します。 重要: MT5での注文簿の利用可能性
Imbalance DOM Pro を使用する前に、お使いのブローカーが MT5での注文簿アクセス を提供していることを確認してください。このインジケーターはリアルタイムデータに依存しています。 MT5プラットフォームは注文簿の履歴を保存しないため 、インジケーターは リアルタイム でのみ機能し、市場の買い注文と売り注文に関する即時の洞察を提供します。 Imbalance DOM Proの利点 1. 明確な色分けによる高度な注文簿分析 Imbalance DOM Pro は、 注文の不均衡 を特定の色で簡単に視覚化できます: 緑色 : 買い注文

This is an advanced indicator used with success rate.Unlock the secrets of trading Boom and Crash spikes with our powerful MT5 indicator! This spike detection tool provides accurate buy and sell signals, trade alerts, and High success rate entries. Perfect for scalping, day trading, and swing trading. Get the best Boom and Crash strategy with our Deriv Boom and Crash spike indicator. Indicator does not redraw or repaint. Recommendation
· Use a Virtual Private Server (VPS) for 24/7 alerts on
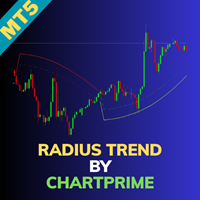
Radius Trend by ChartPrime Overview: The Radius Trend indicator is an advanced technical analysis tool designed to visualize market trends through an adaptive, radius-based method. With dynamic bands that react to price action and volatility, it offers traders a unique insight into trend strength, direction, and potential reversals. Unlike traditional trend lines, this indicator adjusts dynamically like a radius sweeping across the chart, creating a fluid approach to trend analysis. Key Features
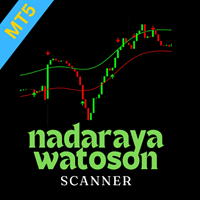
Nadaraya Watson Envelop Scanner Overview
The Nadaraya Watson Envelop Scanner is a powerful multi-symbol and multi-timeframe tool that enhances the functionality of the Nadaraya Watson Envelop indicator for MT5. By scanning across various symbols and timeframes, this scanner enables traders to detect key signals and trend reversals quickly and efficiently. Key Features Multi-Symbol & Multi-Timeframe Scanning: Automatically scans multiple symbols and timeframes to identify potential trade setups
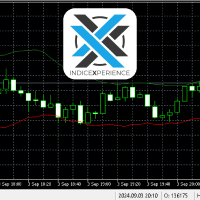
Indicador para mercado de Índice Futuro Brasileiro (WIN) __________________________________________________________________________________________________
O indicador trabalha com rompimento de canal indicando o sentido do movimento e os 3 possíveis TP e o SL baseado no ATR.
Indicação de utilização em TimeFrame de 5M, mas pode ser utilizado em qualquer tempo gráfico de sua preferencia. __________________________________________________________________________________________________

CVB Cumulative Volume Bands: 累積ボリュームでトレードを強化! CVB Cumulative Volume Bands は、累積ボリュームに基づく正確なシグナルを求めるトレーダー向けに設計された高度なインジケーターです。 このインジケーターは、累積ボリュームバンドを使用して、買いと売りの圧力を明確に読み取り、反転や強い価格変動を特定するのに役立ちます。 主な特徴: 累積ボリューム分析 : ボリュームに基づいて重要な圧力点を検出します。
明確なエントリー/エグジットシグナル : リアルタイムでチャンスを捉えます。
簡単な解釈 : ユーザーフレンドリーなインターフェースとシンプルなビジュアル。
全ての資産とタイムフレームに対応 : どの市場でも、いつでも使用可能。 CVB Cumulative Volume Bands で一歩先を行き、自信を持ってトレードの判断を改善しましょう! フィードバックをお寄せいただき、改善にご協力ください!

This indicator is one of our first brilliant programs, the indicator is quite useful and seems to give the best results when combined with price action, and a combination of oscillators , mainly the Bollinger bands and the moving average , you can also use this on all time frames but be careful on the lower time-frames as the trend is not too steady or rather moves fast, this will help you have better entries.

This is one of our best products available on the market, it will work with every pair you can think of, this ea works together hand in hand with the trend and support and resistance strategy , it will work with all the timeframes and all oscillators , this will amaze you on how best it works and makes trading a whole lot easier you can use this with the rsi oscillator for best results.
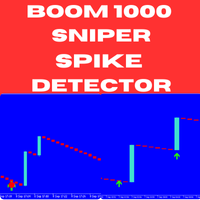
Boom and Crash Sniper Spike Detector - Boom 1000 The Boom and Crash Sniper Spike Detector is the ultimate tool for spike trading on Boom 1000, offering clear and reliable signals to help you capture high-probability trades. This advanced indicator is designed to enhance your trading strategy by simplifying spike detection and maximizing your profits. Key Features: Multi-Timeframe Compatibility : The indicator can be used on M1, M5, M15, M30, and H1 timeframes, but it works best on the M1 timefra
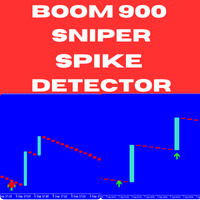
Boom and Crash Sniper Spike Detector - Boom 900 Unlock the potential of spike trading on Boom 900 with the Boom and Crash Sniper Spike Detector. This cutting-edge indicator provides precise and clear signals, helping you identify high-probability trades and capture spikes effortlessly. Designed for traders who want to enhance their trading performance, this tool simplifies the process of detecting spike opportunities. Key Features: Multi-Timeframe Compatibility : The indicator works across multi
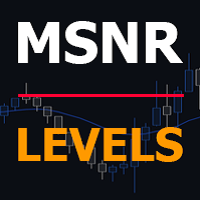
This is Multiple Timeframe of Malaysia SNR Levels and Storyline. The single timeframe version here Features: + Display level on multiple timeframe (higher or lower) + Turn on/off level on timeframe + Alert when price touch level 1. if high > resistance level but close of candle < resistance level , this level become unfresh - Name of level will have "(m)" meaning mitigated if close of candle > resistance level , this level become invalid and can be removed in chart (there is setting for keep/rem
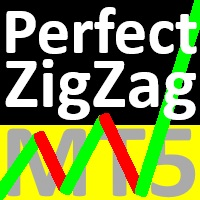
ZigZag function
The first zigzag was proposed by Arthur A. Merrill in 1977 and is based on the vertical axis (price range %). The second zigzag is based on the horizontal axis (period), which is widely known in MT4 and MT5. this is the third zigzag designed from a completely new perspective. However, it is not based on originality, but on more fundamental theory.
First, I created the smallest zigzag 0. I bundled zigzag 0 together in accordance with Dow Theory to create zigzag 1. I bundled

CustomRSI50 Alert and Mail at Cross インジケーター CustomRSI50 Alert and Mail at Cross インジケーター 説明 CustomRSI50 Alert and Mail at Cross インジケーターは、人気の相対力指数 (RSI) に基づく高度なテクニカルインジケーターで、RSI レベルが 50 の閾値を超えたときにアラートやメール通知を通じて自動取引を簡素化するように設計されています。このインジケーターは、RSI の明確でカスタマイズ可能な視覚化を提供し、特に多くのトレーダーにとってモメンタム分析で重要な 50 の臨界レベルに重点を置いています。 主な特徴 50 レベルを超えたときのアラートとメール通知の送信 設定可能な RSI 期間 強調された基準レベル 50 カスタマイズ可能な適用価格タイプ 別ウィンドウでの表示 0 から 100 までの固定スケールで簡単に解釈可能 カスタマイズ可能なパラメータ RSI_Period: RSI 計算の期間を設定できます (デフォルト: 14) applied_price: 計算

BotM5 MT5
Exact entry points for currencies, crypto, metals, stocks, indices!
Indicator 100% does not repaint!!!
If a signal appeared, it does not disappear! Unlike indicators with redrawing, which lead to loss of deposit, because they can show a signal, and then remove it.
Trading with this indicator is very easy.
Wait for a signal from the indicator and enter the deal, according to the arrow
(Aqua arrow - Buy, Red - Sell).
Indicator parameters:
Deviation - 4 (you c
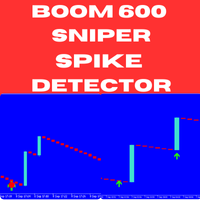
Boom 600 Sniper Spike Detector - MQL5 Listing Description Introducing the Boom 600 Sniper Spike Detector – a cutting-edge, non-repainting indicator designed to help you effectively capitalize on spikes in the Boom 600 market. Ideal for both seasoned traders and beginners, this indicator offers precise, actionable signals to enhance your trading strategy and maximize your profit potential. Key Features: Non-Repainting Signals : Guarantees reliable and consistent signals that do not repaint, provi
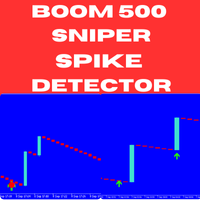
Introducing the Boom 500 Sniper Spike Detector – an advanced, non-repainting indicator specifically crafted to help you capture spikes in the Boom 500 market with precision. Whether you are an experienced trader or just starting, this indicator provides reliable signals that simplify spike trading, making it an essential addition to your trading arsenal. Key Features: Non-Repainting Signals : The Boom 500 Sniper Spike Detector generates highly reliable signals that do not repaint, allowing you t
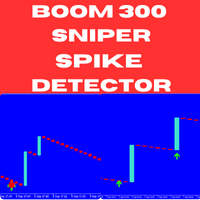
Introducing the Boom 300 Sniper Spike Detector – a powerful, non-repainting indicator specifically engineered to help you master spike trading in the Boom 300 market. Whether you're a seasoned trader or new to the game, this tool offers precise and timely signals, allowing you to catch spikes with confidence and improve your overall trading performance. Key Features: Non-Repainting Signals : Ensures consistent and accurate signals that do not repaint, providing you with reliable data to make con
Smart Fractals Indicator - あなたのMT5トレードのための強化フラクタル Smart Fractalsは、あなたがチャートで使用している従来のフラクタル指標の進化版です。MetaTrader 5用に特別に設計されたこの指標は、従来の市場反転ポイントを識別するだけでなく、それを超えて、あなたのトレードをより効率的で収益性の高いものにします。私たちはフラクタルの基本概念を取り、それをよりスマートで機能的なツールに変えました。 主な特徴: 売買シグナル:従来の市場転換点を示すフラクタルに加えて、Smart Fractalsには、グラフ上に黄色と紫の矢印で表示される、明確に定義された買いと売りのシグナルが含まれています。これにより、自信を持ってポジションに入ることができます。 改善されたビジュアル:各フラクタルは、カスタマイズ可能な色で「アップ」フラクタルと「ダウン」フラクタルを区別し、明確で直感的に表示されます。さらに、市場の構造的なブレイク (BOS) はリアルタイムで表示され、方向性の有効性を確認します。 色とスタイルのカスタマイズ:さまざまなシグナルに対して、

The Super Trend Extended Indicator is a powerful tool designed to assist traders in identifying market trends and making informed trading decisions. It combines a robust trend-following algorithm with advanced filtering options to provide precise entry and exit signals. Key Features: Trend Identification : The indicator effectively highlights the current market trend, whether bullish or bearish, helping traders stay on the right side of the market. Customizable Parameters : Users can adjust sens

This indicator managge all kind of ICT FVG include: FVG, SIBI, BISI, Inverse FVG. The advantage point of this indicator is mangage FVG on all timeframe. FVG - Fair value gap ICT Fair value gap is found in a “three candles formation” in such a way that the middle candle is a big candlestick with most body range and the candles above & below that candle are short and don’t completely overlap the body of middle candle. * This indicator allow filter FVG by ATR. So you can just show valid FVG which
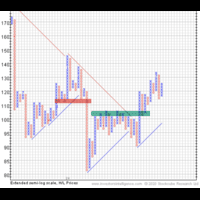
Point-and-Figure MetaTrader 5 indicator is an indicator that can plot a point-and-figure chart directly in the main window of your normal MT5 chart. You can set up all the point-and-figure method parameters, such as the box size and the reversal distance, according to your preference. In addition, you can control all the display parameters of the PnF chart. This point-and-figure indicator supports all sorts of alerts. It is based on real ticks data, and thus is available only for MT5. Point-an
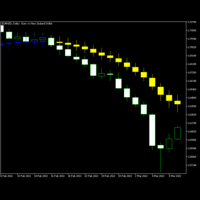
Moving Average Candlesticks MetaTrader indicator — is a chart visualization of a standard moving average using the candlestick bars. It draws the candlesticks based on the moving average values calculated for Close, Open, Low, and High. It allows seeing a compact snapshot of the more detailed market information compared with the classic MA indicator. It works with any currency pair, timeframe, and MA mode. The indicator is available for MT4 and MT5. Input parameters MAPeriod (default = 10
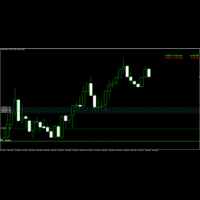
Breakeven Line Indicator is a MetaTrader indicator that calculates breakeven level based on all open positions and displays it on your chart as a horizontal line. Additionally, it will calculate the total number trades, the total number of lots, and the distance to the breakeven line in points and profit/loss. The indicator is available for both MT4 and MT5. You can press the Shift + B keyboard shortcut to hide or show the breakeven line. The indicator supports multiple input parameters to

ZigWave Oscillator: オシレーターとZigZagで取引を強化! ZigWave Oscillatorは、金融市場分析において精度と明瞭さを求めるトレーダーに最適なツールです。このインジケーターは、オシレーターの強みとZigZagの視覚的なシンプルさを組み合わせ、迅速かつ効率的に最適な売買機会を見つけるのに役立ちます。 ZigWave Oscillatorを選ぶ理由 精密なオシレーター分析 : RSI、Williams %R、またはCCIを統合し、市場の主要な動きをキャッチします。 動的なZigZagと精密調整 : ZigZagのスイングは、オシレーターの買われすぎや売られすぎの領域で微調整され、反転ポイントを明確に示します。 完全なカスタマイズ ️: オシレーターとZigZagの設定を調整し、自分の戦略に合わせて最適化できます。 直感的で使いやすいデザイン エレガントでカスタマイズ可能なビジュアルレイアウトにより、ZigWave Oscillatorは市場のシグナルを簡単に読み取ることができ、取引に集中できます。 全てのアセット
Daily Performance Tracker (MetaTrader indicator) calculates the currency rate change relative to the previous day's close and displays it as a percentage in the main chart window. It also offers the option to show weekly and monthly percentage changes. You can customize colors to differentiate between positive and negative price movements. Additionally, a small, customizable arrow visually indicates the price direction. If your broker operates in a non-standard time zone, the Time Shift paramete

Attention all Boom and Crash traders! Elevate your market monitoring with the cutting-edge RSI indicator, Market Watch . - Customize alert settings for periods, volatility thresholds, and price spikes - Receive voice notifications when your targets are hit - Seamless integration with MetaTrader5 for real-time data
The indicator works on all five Boom and Crash Markets!
Default settings: Number of timeframes: Timeframe 1 - True Timeframe 2 - True Timeframe 3 - True Timeframe 4 - True Timefra

CBT Quantum Maverick 高効率バイナリ利益獲得システム
CBT Quantum Maverick は、精度、シンプルさ、確実な利益を求めるトレーダー向けに設計された、細かく調整された高性能バイナリ オプション取引システムです。カスタマイズは不要で、このシステムはすぐに最高の結果が出るように最適化されています。
主な機能:
- シグナル精度の 2 つのモード:
- 「再描画を許可」モード: 事前にシグナルを提供し、次のキャンドルに向けて十分な準備と取引の機会を提供します。
- 「厳密に再描画なし」モード: 現在のキャンドルの開始時にリアルタイム シグナルを提供し、再描画がないことと 100% 正確なシグナル タイミングを保証します。
- バイナリ オプションのベスト: このシステムはバイナリ オプション取引に最適です。シグナルに従い、取引の準備をし、自信を持って実行するだけです。
互換性:
1. あらゆる時間枠で合成チャートを派生します。
2. Quotex、PocketOption、Binomo、Stockity、IQOption

With this indicator, you can predict future price behavior for a certain number of bars ahead, giving you the ability to anticipate market dynamics. The indicator draws a forecast line , which models potential future price values based on sophisticated algorithms analyzing past data. This information can be leveraged not only for market entry and exit decisions but also for setting or adjusting stop-loss levels to better manage your positions. Application of the Forecast The data provided by the

TD Sequential Scanner: An Overview The TD Sequential scanner is a powerful technical analysis tool designed to identify potential price exhaustion points and trend reversals in financial markets. Developed by Tom DeMark, this method is widely used by traders to gauge market cycles and potential turning points with precision. How It Works: Sequential Count: The core of the TD Sequential indicator is its sequential counting mechanism. The scanner identifies a sequence of price bars where each ba

Fractal Indicator Strategy is an advanced MetaTrader 5 indicator specifically designed for traders who use fractal analysis in their strategies. This indicator provides an essential tool for marking key levels on the chart with horizontal lines, making it easier to identify and follow fractal patterns in the market. Key Features: Fractal Horizontal Lines: Automatically draws horizontal lines at customizable intervals in pips, based on key levels essential for fractal analysis. These horizontal

For support, visit cc.inni.cc where you will also find our Knowledge library and FAQ. PATHFINDER TREND is a complex, yet easy to manage trend indicator. It has various features that can aid in your decision making and boost your performance accuracy. Patfhinder Trend is a visually comfortable and user friendly tool that you should keep on your trading desk.
Key features Signal Detection & Trend Analysis Visually clear and decisive Early indication of signal direction with arrows Confirmed s

This is the best indicator we have created by far, this indicator replicates the well known heiken ashi indicator, but with a more precise entry point, this indicator can work on all time-frames and is strong on all the time frames , this indicator does not repaint nor does it lag , this indicator strategy combined with price action will change your trading experience , elevate your experience to the next level.

This is best binary signal indicator for 1 minute expiry on 1 minute chart window. Buy and Sell arrows appear on previous candle. This is best momentum candle strategy in all markets. Important = Use martingale (if you are not aware of martingale system then first search martingale and learn it ) all forex ___indexs___companies___all timeframes best for binary trading style Thank you...............

このMACD(移動平均収束発散)インジケーターには以下の特徴があります: 別ウィンドウ:メインチャートの下に表示されます。 MACDライン:速いEMAと遅いEMAの差を示す青線。 シグナルライン:MACDラインのSMAを示す赤線。 ヒストグラム:MACDラインとシグナルラインの差を示す灰色のヒストグラム。 買い/売りシグナル:交差点で緑(買い)と赤(売り)の矢印を表示。 ゼロライン:MACDのゼロレベルを示す灰色の点線。 カスタマイズ可能なパラメータ:EMA期間、シグナルSMA期間、シグナル閾値、アラートオプション。 動的情報表示:現在のトレンド、MACDステータス、シグナルステータス、交差情報を示すテキストボックス。 アラートシステム:有効にすると新しいシグナルのアラートを提供。 自動計算:MACD値を自動的に更新。 ビジュアルカスタマイズ:線の色、スタイル、幅をカスタマイズ可能。
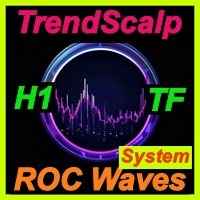
Looking for EA to automate your trading strategy on the Forex market? TrendRocWaves Oscillator — your faithful companion in the world of trading! This manual trading system offers unique features:
- works exclusively on an hour(H1) timeframe for instant response to market changes. - uses the most popular and liquid currency pairs such as EURJPY, EURGBP, EURUSD, GBPUSD and USDCAD with minimal spreads and fast transaction execution. - applies a scalping method based on a medium-term trend to ac

JsTrader: Connect MetaTrader 5 with JavaScript JsTrader provides an easy, drag-and-drop solution to connect your JavaScript strategies with MetaTrader 5 (MT5). Using a socket-based communication, your JavaScript script (client) interacts with the MT5 EA (server). It’s tested for real-time trading, enabling fast and efficient integration without the need for both to run on the same computer. Full documentation, including the JavaScript script, EA files, and examples, is available on our GitHub.
製品概要 この MetaTrader 5 価格アラートインジケーター は、トレーダーが価格変動を簡単に監視するのに役立ちます。ユーザー指定のレベルに水平線を引き、そのレベルを上回るか下回って終値が決まるとアラートを発します。トレーダーはアラート条件をカスタマイズでき、市場を常に見続けることなく重要な価格レベルを監視できます。 主な機能 カスタマイズ可能なアラートレベル : アラートを受け取りたい特定の価格レベルを設定します。 柔軟なアラート条件 : 設定したレベルを終値が上回ったり下回ったりするときにアラートをトリガーするかどうかを選択します。 アラートラインの色の調整 : チャートのテーマや好みに合わせてアラートラインの色を変更できます。 アラート回数の制限 : アラートが何回トリガーされるかを指定し、繰り返し通知を防ぎます。 明確な視覚および聴覚アラート : 条件が満たされると、インジケーターは画面通知と音声アラートを表示します。 入力パラメータ アラートレベル ( double ): 監視する価格レベルを設定します。 アラートの上限値 ( bool ): 価格が設定したレベルを上

This multi-currency annual dashboard analyzes the nearest high and low to the current price for a chosen number of recent years. It displays how many pips away the price is from the nearest high or low. You can set a pip threshold, and the alert will notify you when the price gets close to the specified levels. In real-time, the dashboard also provides an overview of the closest high or low values for each specific year, helping you make informed trading decisions.

Key level analysis : The indicator tracks the nearest annual high and low to the current price over a chosen number of years. Proximity alerts : It triggers an alert when the price reaches a specified number of pips from the nearest high or low. Customizable notification intervals : You can set how often alerts repeat, for example, every 30 minutes. Historical perspective : Enables long-term tracking of market levels and effective planning of trading strategies. Multi-currency support : This ind
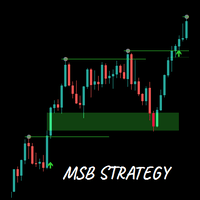
Capitalized on market structure and price gaps
The MSB Strategy indicator identifies swing highs and lows, detects high probability breakouts and price gaps (better knows as FVGs) which when price retests offer high probability entries. The indicator will draw an arrow to mark breakouts and when detected draw a rectangle FVG zone which you can use to define high probability entries. The 200 EMA is included to filter out noise and false signals. Summary of features Alerts on market structure br
MetaTraderマーケットは自動売買ロボットとテクニカル指標を販売するための最もいい場所です。
魅力的なデザインと説明を備えたMetaTraderプラットフォーム用アプリを開発するだけでいいのです。マーケットでプロダクトをパブリッシュして何百万ものMetaTraderユーザーに提供する方法をご覧ください。
取引の機会を逃しています。
- 無料取引アプリ
- 8千を超えるシグナルをコピー
- 金融ニュースで金融マーケットを探索
新規登録
ログイン