Technische Indikatoren für den MetaTrader 5 - 88

First and foremost, the Insight Flow Indicator stands out as a Non-Repainting, Non-Redrawing, and Non-Lagging tool. This makes it a prime choice for both manual and algorithmic trading, ensuring reliable and consistent signals. User Manual: Settings, Inputs, and Strategy The Insight Flow Indicator leverages price action, strength, and momentum to provide a clear edge in the market. Equipped with advanced filters, it eliminates noise and false signals, enhancing trading potential. By using multip

Dynamic Range and Target Indicator: Your Reliable Trading Partner
Introducing an innovative indicator that revolutionizes how you analyze markets and make trading decisions. Whether you're a beginner seeking clear guidance or an experienced trader looking to enhance your strategy, this tool is designed to meet your needs.
Key Features:
1. Dynamic Range Determination: The indicator continuously analyzes the market, identifying the most recent significant price ranges.
2. Clear Support an
This never-before-seen Indicator is a histogram of the MACD lines crossing. It has never been easier to observe a trend reversal in advance. It fixes the crossing points of the MACD lines on the chart according to your parameter settings. Ideal for anticipating trends and studying the stock market. Detailing the Indicator: It accurately indicates the crossing of the MACD and Signal lines, being later confirmed by the MACD indicator as confirmation of the trend. it confirms the macd crossing wit

The indicator places a buy or sell signal when the conditions of the strategy it was designed with are met. The strategy is guaranteed, strong, and has been tested for 9 years. The indicator is for binary options and can be converted into a bot by linking it to MT2Trading, where it sends the signal to this platform. This platform automatically opens a trade on the trading platform you are using, whether it is Pocket Option, IQ Option, or any other binary options platforms. The entry is on the ne
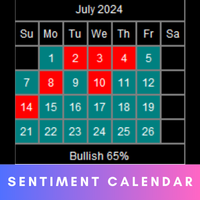
The Market Sentiment calendar provides a visual representation of market sentiment for each day or month. It will display daily and monthly BIAS . The calendar also highlights the percentage of bullish days or months within a given month or year. MT4 version - https://www.mql5.com/en/market/product/120767/ Inputs Frequency: Choose between "Daily" and "Monthly" calendar views. Sentiment Method: Select the method to determine daily or monthly sentiment: " L inear Regression ", " Accumu

SolarTrade Suite Finanzindikator: Jupiter Market Indicator – Ihr zuverlässiger Führer in der Welt der Finanzmärkte!
Dies ist ein Trendindikator, der spezielle innovative und fortschrittliche Algorithmen zur Berechnung seines Wertes verwendet und zudem ein ansprechendes Design aufweist.
Die Messwerte dieses Indikators sind sehr leicht zu verstehen: Blau – Kaufen, Rot – Verkaufen.
Sehen Sie sich unsere anderen Produkte aus der SolarTrade Suite-Reihe am Ende der Beschreibung an.
Möchten Sie si

SolarTrade Suite Finanzindikator: Saturn Market Indicator – Ihr zuverlässiger Führer in der Welt der Finanzmärkte!
Dies ist ein Preiskanalindikator, der spezielle innovative und fortschrittliche Algorithmen zur Berechnung seines Wertes verwendet und zudem ein ansprechendes Design aufweist.
Das Verstehen der Messwerte dieses Indikators ist sehr einfach: Handeln Sie von den Grenzen aus sowohl bei einem Ausbruch als auch bei einem Rebound.
Sehen Sie sich unsere anderen Produkte aus der SolarTra

Balanced Work Indicator: Your Gateway to Trend Trading Balanced Work is a trend-following indicator designed to simplify market analysis and trading decisions. This algorithmic tool draws two-colored dots along the price chart, connected by lines, offering a clear visual representation of market trends. The simplicity of this indicator lies in its color-coded signals: buy when a blue dot appears and sell when a red dot appears. It is particularly effective for scalping and pipsing, and it has p
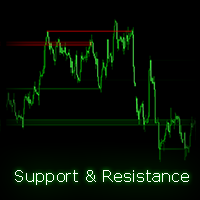
Dieser Indikator findet und plottet automatisch Support- und Widerstandskanäle auf Ihrem Chart, um wichtige Level einfach zu identifizieren. Der Indikator unterstützt mehrere Zeitrahmen, sodass Sie Kanäle aus verschiedenen Zeitrahmen auf Ihrem aktuellen Chart anzeigen können. Darüber hinaus bietet er transparente Farben für verbesserte visuelle Klarheit und ermöglicht es Ihnen, die Farben der Kanäle nach Ihren Wünschen anzupassen. Wie funktioniert dieser Indikator? Der Indikator findet Schwingun

The trendlines with breaks indicator return pivot point based trendlines with highlighted breakouts. Users can control the steepness of the trendlines as well as their slope calculation method.
Trendline breakouts occur in real-time and are not subject to backpainting. Trendlines can however be subject to repainting unless turned off from the user settings.
The indicator includes integrated alerts for trendline breakouts. Any valid trendlines methodology can be used with the indicator, users
Introducing the Gold Market Arrow Indicator, specifically designed for the 15-minute chart. This advanced tool provides clear and actionable buy and sell arrows, enabling traders to make timely and informed decisions in the gold market. Whether you're a seasoned trader or a novice, our indicator simplifies complex market data into straightforward signals, ensuring you never miss an opportunity to capitalize on gold price movements." This indicator works with a custom build in strategy The indic

Finanzindikator SolarTrade Suite: Uranus Market Indicator – Ihr zuverlässiger Führer in der Welt der Finanzmärkte! Unser Forex-Handelsprogramm ist mit einer leistungsstarken künstlichen Intelligenz ausgestattet, die Marktdaten in Echtzeit analysiert. Es sagt Preisbewegungen genau voraus und hilft Händlern, fundierte Entscheidungen zu treffen. Mit fortschrittlichen Algorithmen optimiert unser Indikator Strategien und minimiert Risiken für Händler. Dies sind zwei gleitende Durchschnitte, die spez

Finanzindikator SolarTrade Suite: Neptune Market Indicator – Ihr zuverlässiger Führer in der Welt der Finanzmärkte! Unser Forex-Handelsprogramm ist mit einer leistungsstarken künstlichen Intelligenz ausgestattet, die Marktdaten in Echtzeit analysiert. Es sagt Preisbewegungen genau voraus und hilft Händlern, fundierte Entscheidungen zu treffen. Mit fortschrittlichen Algorithmen optimiert unser Indikator Strategien und minimiert Risiken für Händler. Dies sind sechs gleitende Durchschnitte, die sp

SolarTrade Suite Finanzindikator: Venus Market Indicator – Ihr zuverlässiger Führer in der Welt der Finanzmärkte! Unser Forex-Handelsprogramm ist mit einer leistungsstarken künstlichen Intelligenz ausgestattet, die Marktdaten in Echtzeit analysiert. Es sagt Preisbewegungen genau voraus und hilft Händlern, fundierte Entscheidungen zu treffen. Mit fortschrittlichen Algorithmen optimiert unser Indikator Strategien und minimiert Risiken für Händler. Dies ist ein Oszillator, der spezielle innovative

Finanzindikator SolarTrade Suite: Mars Market Indicator – Ihr zuverlässiger Führer in der Welt der Finanzmärkte! Unser Forex-Handelsprogramm ist mit einer leistungsstarken künstlichen Intelligenz ausgestattet, die Marktdaten in Echtzeit analysiert. Es sagt Preisbewegungen genau voraus und hilft Händlern, fundierte Entscheidungen zu treffen. Mit fortschrittlichen Algorithmen optimiert unser Indikator Strategien und minimiert Risiken für Händler. Dies ist ein Oszillator, der spezielle innovative

Für einen kostenlosen Download, treten Sie unserer Gruppe bei. Begrenztes Angebot! Überblick: Erkennen Sie die stärksten Währungen auf einen Blick mit dem Currency Strength Chart für MetaTrader 5. Dieser leistungsstarke Indikator bietet eine klare, visuelle Darstellung der relativen Stärke der wichtigsten Währungen über die letzten 30 Tage, sodass Sie fundiertere Handelsentscheidungen treffen können. Hauptmerkmale: 30-tägige Vergleichsanalyse: Vergleichen Sie die Stärke jeder Hauptwährung über e

The ICT Immediate Rebalance Toolkit is a comprehensive suite of tools crafted to aid traders in pinpointing crucial trading zones and patterns within the market.
The ICT Immediate Rebalance, although frequently overlooked, emerges as one of ICT's most influential concepts, particularly when considered within a specific context. The toolkit integrates commonly used price action tools to be utilized in conjunction with the Immediate Rebalance patterns, enriching the capacity to discern conte
A simple indicator for plotting a tick chart.
This indicator will allow you to track the spread dynamics and the price behavior in general.
In the settings, you can select the price to display on the chart - Bid, Ask or both prices at the same time.
Tick Chart Indicator will definitely be useful when using scalping strategies. The MT4 version is available here . Good luck to everyone and successful trading!

Description of the Indicator Trend Stop shows the highest/lowest value of the last N periods. Can help traders identify the trend direction and potential stop levels. Use Trend Stop indicator to detects the trend direction.
Downtrend if the price crosses the Trend Stop line upwards Uptrend if the price crosses the Trend Stop line downwards
Use Trend Stop indicator to define optimal stop levels. Downtrend Place your stops above the Trend Stop line Uptrend Place your stops below the Tren
Optimized for Asia- London- US- Open-Session true Momentum - time-based Indicator
Filter
Daytime Weekdays Moving Averages Keltner-Channel MACD Advantages Optimised for Asia- London- US- Open-Session choose your personal times to trade - select Daytime and Weekdays Keltner-Channel => to reduce market noise - sideways movement will be hidden 3x Moving Averages => for the Trend, including Price MACD fits best with Trend MA Candles Signal after close - no repaint Alerts
Email Screen-A

Für einen kostenlosen Download, treten Sie unserer Gruppe bei. Angebot für begrenzte Zeit! Wir stellen unser innovatives MQL5-Indikator vor, das entwickelt wurde, um Ihr Handelserlebnis zu verbessern, indem es klare visuelle Hinweise auf die täglichen Kerzengrenzen in niedrigeren Zeitrahmen bietet. Dieses Tool ist perfekt für Trader, die über den Fortschritt der täglichen Kerze informiert bleiben möchten, um bessere Entscheidungen zu treffen und Strategien zu implementieren. Hauptmerkmale Visual
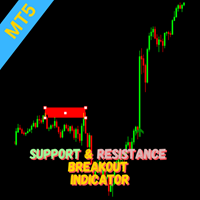
Indicator Overview This indicator utilizes the Zigzag indicator to identify potential support and resistance levels. When the price action breaks through one of these levels, a trading signal is generated. How it Works The Zigzag indicator is employed to pinpoint significant price highs and lows, forming potential support and resistance areas. A signal is triggered when the current candle closes beyond a previously established support or resistance level. Traders can consider entering a position
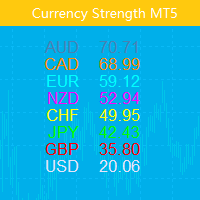
Dieser Indikator zeigt die relative Stärke von acht Hauptwährungen (USD, EUR, GBP, AUD, NZD, CAD, CHF, JPY). Kraftwerte werden im Bereich von 0 bis 100 normalisiert. Werte über 60 bedeuten stark. Ein Wert unter 40 deutet auf Schwäche hin.
Fahrkarte Only Show Current Pair - Bei „true“ wird nur das aktuelle Diagrammpaar angezeigt. Ansonsten werden alle acht Kurven angezeigt. Bars To Show – Anzahl der Balken zur Anzeige der Kraftkurve. Ma Periods To Smooth Curves : Gleitende Durch

VolaMetrics VSA | Ein Mächtiger Verbündeter in der Technischen Analyse Der VolaMetrics VSA ist ein technischer Analyseindikator, der die Volume Spread Analysis (VSA) Methode mit einer detaillierten Analyse des Handelsvolumens kombiniert. Entwickelt, um signifikante Preisbewegungen zu identifizieren und zu verfolgen , nutzt der VolaMetrics VSA die Interaktion zwischen Volumen und Preisspread , um wertvolle Einblicke zu bieten, die bei Handelsentscheidungen unterstützen können. Grundlagen der V
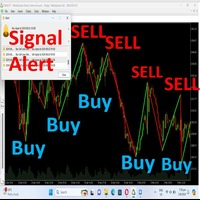
Hello Traders, *-For your bonus one indicator with SL,TP zone* just give your review, comment.Once finish developing I will give you**** Trend identification Indicator This is a indicator that will identify trend zone as bearish and bullish zone . This indicator can use for all pairs and any timeframe you can use it . *Green lime mean buy.Red line mean sell.You will receive alert sound when signal generate. The create best on high, low point and moving average calculation. You can customize valu
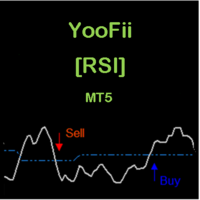
CONSTITUTION YooFii [RSI] is an indicator consisting of an oscillator and three dynamic levels. The oscillator, dynamic levels and warning signals can be adjusted via the inputs. It is designed for the MT5 platform only. APPLICATION This indicator should be used with a trend filter [for FOREX you can use the Currency Strength Meter; for CDF's you can use two moving averages (MA 200 and MA 55)]. With the trend already determined, through Yoofii [RSI] we detect points of exhaustion of correction m

This indicator/dashboard , is place on a single symbol. It shows the percentage of movement withing all time frames from M1 to W1.The text will change green if all % are in the positive for a buy signal.The text will change red if all % are below zero and in negative for a sell signal. There are audible notifications, as well as on screen notifications along with push notifications that can be turned on and ON/OFF in the settings.
This is a sure way to Find trends quickly and efficiently, with

Introducing the BOOM CRASH MASTER Indicator: Unleash the Power of Precision Trading! Step into the world of unparalleled trading with the BOOM CRASH Master Indicator, exclusively designed for the Boom and Crash indices offered by Deriv broker. This cutting-edge tool is your gateway to mastering the art of spike detection and anti-spike entries, ensuring you stay ahead of the market’s every move. Recommendations: Symbols: Any Boom or Crash Index
Timeframe: 1 minute / 5 minutes
Stop Loss: Recent

Adjustable Consecutive Fractals looks for 2 or more fractals in one direction and sends out a on screen alert, sound alert and push notification, for strong reversal points .
Adjustable Consecutive Fractals, shows the fractals on chart along with a color changing text for buy and sell signals when one or more fractals appear on one side of price.
Adjustable Consecutive Fractals is based Bill Williams Fractals . The standard Bill Williams fractals are set at a non adjustable 5 bars, BUT withe th
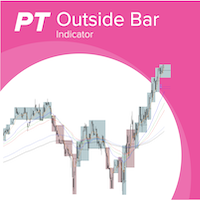
Aussenstab are important in professional price action trading and were made popular by Michael Voigt. Highs and lows of outside bars ( Aussenstäbe ) can be utilized as entry and exit for trades following different strategies. Examples for strategies with inside/outside bars are Reversal Trend continuation Breakout Ranges This indicator allows to displays outside bars on the current and configurable higher timeframes. E.g. you can display the M5 outside bars on a M1 timeframe to see the bigg

This MQL5 Speed Indicator script calculates the average speed of price movements for a selected financial instrument over a specified period. It uses the arithmetic mean to determine the average speed, which is computed by dividing the distance (change in price) by the time interval. The indicator then displays this value as a histogram in a separate window. Average Speed Calculation : The speed is calculated using the formula v = d t v = \frac{d}{t} v = t d , where d d d is the price differen
The "Order Block Indicator for MetaTrader 5" is an advanced trading tool designed to help traders identify key order block zones in the financial markets. Order blocks are areas of institutional buying and selling, often marking significant price levels where market reversals or continuations are likely to occur. This indicator provides a visual representation of these zones directly on the chart, enabling traders to make more informed trading decisions. Key Features: Accurate Order Block Identi
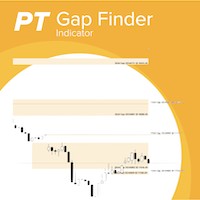
With the gaps finder indicator gaps between trading session are automatically added to you chart and you will never miss a gap which you can use in your trading strategies. Gaps often act as a magnet where the markets returns to or when a gap is closed often constitutes a reversal point.You don't have to draw manually gaps anymore. Key Features: Support for multiple trading sessions in a single chart, e.g market session and future session Configurable number of days to look back for gaps Highly
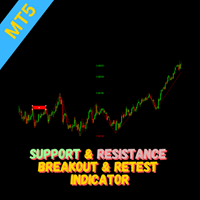
Overview The Breakout and Retest indicator is designed to identify potential trading opportunities by detecting price breakouts from significant support and resistance levels followed by a retest of the broken level. How it Works The indicator analyzes price data to determine key support and resistance areas. When the price decisively breaks through one of these levels and then retest it, then a potential breakout is signaled when it breakout again. To increase the probability of a successful t
You can use the indicator in trend following to detect trend changes. Each color change is a trading signal. It should be used on at least 1 hour charts. It is recommended to use it on 1-day charts. However, it should be noted that the number of meaningful candles (without gap) on your chart should be at least 80.
The calculation method is based on ATR, MA and CCI indicators. However, for a significant part of the calculation I have developed my own algorithm based on standard deviation and re

Elder Impulse Indicator Overview: The Elder Impulse Indicator is a powerful tool designed for traders who want to combine the strengths of trend-following and momentum strategies. Developed by Dr. Alexander Elder, this indicator helps traders identify potential entry and exit points by analyzing both price direction and momentum. It’s an essential tool for making informed decisions in various market conditions, whether you're trend-trading, swing trading, or looking for momentum shifts. Key Fea

„Der Ultimate Bot Alerts-Indikator ist ein leistungsstarkes Tool für MetaTrader 5, das Händlern dabei hilft, potenzielle Ein- und Ausstiegspunkte im Markt zu identifizieren. Dieser Indikator verwendet einen ausgeklügelten Algorithmus, der auf Average True Range (ATR) und Preisbewegungen basiert, um Kauf- und Verkaufssignale zu generieren.
Wenn Sie den Ultimate Bot Alerts-Indikator auf Ihr Diagramm anwenden, sehen Sie grüne Pfeile für Kaufsignale und rote Pfeile für Verkaufssignale. Diese Signa
Perfekt gestaltet für Trader, die Klarheit, Präzision und Benutzerfreundlichkeit schätzen, bietet dieser hochmoderne Renko-Chart-Indikator alles, was Sie benötigen, um Ihre Handelsstrategie zu verbessern. Im Gegensatz zu herkömmlichen Generatoren, die Offline-Charts erstellen, liefert dieser Indikator Renko-Charts in Echtzeit direkt auf Ihrer Live-Handelsplattform. Der Live Renko-Indikator funktioniert auch nahtlos auf Synthetic Indices wie Volatility 75, Step Index, Boom und Crash.

Im Trading-Bereich ist der Schlüssel zum Erfolg, die richtigen Werkzeuge zur richtigen Zeit zu haben. Unser innovativer Volumenprofil-Indikator wurde mit einem einzigen Ziel entwickelt: Tradern einen beispiellosen Zugang zu wichtigen Marktaktivitätsinformationen zu bieten. Dieses hochmoderne Werkzeug ermöglicht es Ihnen nicht nur zu sehen, wo und wann Volumen gehandelt wird, sondern auch die Markttiefe mit einer nie dagewesenen Klarheit zu verstehen. Hauptmerkmale: Zeitliche Flexibilität: Stelle

Überblick SwingVolumePro ist ein fortschrittlicher und vielseitiger Indikator, der für eine breite Palette von Finanzinstrumenten entwickelt wurde und verschiedene Handelsstile unterstützt. Basierend auf strengen Analysen von Volumen und Preis bietet er klare und präzise Signale, die es Händlern aller Erfahrungsstufen ermöglichen, informierte Entscheidungen auf Grundlage hochwertiger Daten zu treffen.
SwingVolumePro.PDF
Hauptmerkmale Vielseitigkeit: SwingVolumePro kann auf verschieden

Optimiere deine Handelsentscheidungen mit dem "autoFibo" Indikator Entdecke den "autoFibo" Indikator: "autoFibo" ist das essenzielle Analysewerkzeug für Trader, die Fibonacci-Niveaus voll ausnutzen möchten, ohne manuell zeichnen zu müssen. Dieser Indikator automatisiert den Fibonacci-Retracement-Prozess und bietet sofortigen visuellen Zugang zu wichtigen Unterstützungs- und Widerstandszonen. Hauptmerkmale: Automatisches Fibonacci-Retracement: Zeichnet automatisch Fibonacci-Niveaus, was die Ident
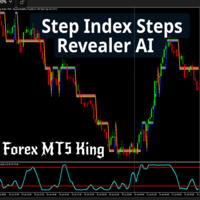
Unlock precision in your trading with the Step Index Steps Revealer AI . This advanced MT5 indicator is your ultimate tool for identifying key price levels on major forex pairs, including GBP/USD, EUR/USD, and others, as well as the step index
Key Features 1. Accurate Price Level Identification Plots precise key levels on major forex pairs like GBP/USD, EUR/USD, USD/JPY, and more. Ideal for traders looking to capitalize on bounce backs and breakouts with accuracy. 2. Optimized for Step Index Ch

Verbessere deine Trading-Leistung mit dem "Better Volume" Indikator Entdecke den "Better Volume" Indikator: Der "Better Volume" ist das essenzielle Werkzeug zur Analyse des Marktvolumens für Trader, die sich abheben möchten. Es analysiert Tick-Volumen mit beispielloser Genauigkeit und bietet eine fortgeschrittene Gleitende-Durchschnitt-Funktion (PERIOD_MA) sowie anpassbare Kauf- und Verkaufsalarme. Hauptmerkmale: Fortgeschrittene Volumenanalyse: Erkenne Volumenspitzen, die wichtige Preisbewegung
O delta volume é uma ferramenta poderosa utilizada em várias estratégias de operação, especialmente no trading de futuros, ações e criptomoedas. Aqui estão algumas das principais estratégias onde o delta volume é frequentemente aplicado: Identificação de Tendências : O delta volume ajuda a identificar a direção da tendência predominante, mostrando se há mais pressão de compra ou venda. Isso pode ser útil para confirmar a força de uma tendência ou identificar possíveis reversões. Confirmação de B
Verbessere Deine Handelsstrategien mit dem "Order Block" Indikator für MT4 Entdecke den "Order Block" Indikator: Der "Order Block" Indikator für MT4 ist darauf ausgelegt, Orderblöcke im Markt präzise zu identifizieren, indem er die Hochs und Tiefs der Orderblock-Kerzen markiert. Dieses leistungsstarke Tool ermöglicht es dir, zu verstehen, wo große Institutionen ihre Aufträge platzieren und so deine Fähigkeit zur Vorhersage von Marktbewegungen zu verbessern. Hauptmerkmale: Präzise Orderblock-Erke

Der SuperTrend ist einer der effektivsten und am weitesten verbreiteten technischen Indikatoren im Trading, ideal zur Identifizierung der Trendrichtung und zur Generierung von Ein- und Ausstiegssignalen. Basierend auf Volatilität und Trend passt sich dieser Indikator dynamisch den Marktbedingungen an und bietet Händlern eine klare visuelle Orientierung. Hauptmerkmale: Trend-Erkennung: Der SuperTrend folgt dem Markttrend und zeichnet eine Linie, die bei einem Abwärtstrend über dem Preis und bei e

Eine Reihe von Indikatoren, die Wendepunkte erkennen. Erkennt Höchst- und Tiefststände von Candlestick-Kombinationen, nachdem sie von zwei MAs abgezogen wurden. Gilt für Handelssysteme bei Verwendung von Early Entrys. Kann entlang des Trends für Scalping und Intraday-Handel sowie zur frühzeitigen Erkennung von Trendumkehrungen verwendet werden.
Möglichkeiten
Die Parameter bieten flexible Einstellungen für beliebige Zeitrahmen und Handelsinstrumente. Es gibt verschiedene Arten von Alarmen für

Neues Kombi-Indikator - 3 in 1 Suchen Sie nach Trading-Tools, die Ihre Marktanalyse und Anlagestrategien verbessern können? Wir haben drei unserer besten Indikatoren zu einer leistungsstarken und praktischen Lösung kombiniert, mit der Sie das Beste aus Ihrem Handel herausholen können. 1. Orderblock-Indikator (ehemals für 32,90$ verkauft) Der Orderblock-Indikator ist ein wesentliches Werkzeug zur Identifizierung von Bereichen von institutionellem Interesse im Markt. Dieser Indikator markiert die

O indicador media colors se baseia num canal que pode ser criado a partir de duas médias Media colors é um indicador de tendência utilizado no trading para identificar a direção predominante do mercado. Pode ser baseado na Média Móvel Simples (SMA) e na Média Móvel Exponencial (EMA) que dá mais peso aos preços mais recentes, tornando-a mais sensível às mudanças de preço. Como Funciona: Cálculo: A EMA é calculada aplicando um fator de suavização aos preços de fechamento de um ativo financeir

Enhance Your Trading with Buraq Bars Indicator! Take your trading to the next level with Buraq Bars ! This easy-to-use indicator draws bars on your chart whenever the RSI (Relative Strength Index) crosses above or below the levels you choose, giving you clear signals to help you trade better. Key Features: Set Your Own RSI Levels: Choose the levels for overbought and oversold that work best for you. Clear Visual Signals: Bars appear on your chart when the RSI crosses your levels, making it easy

Finanzindikator SolarTrade Suite: Comet Market Indicator – Ihr zuverlässiger Führer in der Welt der Finanzmärkte!
Dies ist ein Periodenindikator, der spezielle innovative und fortschrittliche Algorithmen zur Berechnung seines Wertes verwendet und zudem über ein ansprechendes Design und zusätzliche Funktionen verfügt.
Die Messwerte dieses Indikators sind sehr einfach zu verstehen: Eine grüne vertikale Linie ist der Beginn einer neuen Periode. Als zusätzliche Funktionen: - Klicken Sie mehrmals
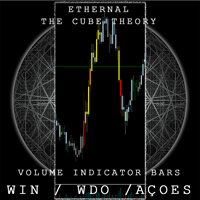
The Cube Bars Brasil pinta os candles de acordo com o volume , excelente para saber os picos de compra e venda . Pode ser regulado livremente pelo usario . Possui regulagem de parametro de entrada para que o usuario tenha a liberdade de regular o colume de acordo com o ativo que escolher . Possui 4 cores que diferenciam os candles de acordo com o tamanho do volume naquele instante
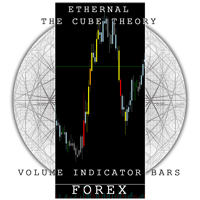
Der Cube Bars Forex ist ein Indikator für Meta Trader 5, der von mir Tomas Lekim erstellt wurde, um die Kerzen basierend auf den Volumenspitzen der Großinvestoren auf dem Forex-Markt zu färben. Es verfolgt die Kauf- und Verkaufsspitzen und malt die Kerzen entsprechend dem Geldbetrag, der von den anderen Robotern investiert wurde. Es ist ein mächtiges Werkzeug gegen große Roboter, weil es die Momente identifiziert, in denen sie Entscheidungen treffen müssen. Es kann entsprechend dem Währungspaar
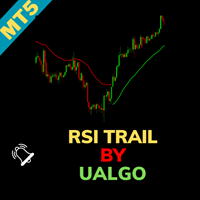
RSI Trail [UAlgo] Indicator for MetaTrader 5 The RSI Trail [UAlgo] indicator is a sophisticated technical analysis tool designed to enhance trading strategies by leveraging the Relative Strength Index (RSI) in conjunction with various moving average calculations. This indicator dynamically plots support and resistance levels based on RSI values, offering clear visual signals for potential bullish and bearish market conditions. Key Features:
Dynamic Support and Resistance Levels: The indicator u
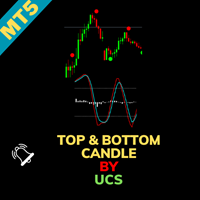
UCS_Top & Bottom Candle Indicator for MetaTrader 5 The UCS_Top & Bottom Candle is an innovative experimental indicator designed for MetaTrader 5. Based on momentum, this indicator identifies the top and bottom candles for most swing movements, assisting traders in making precise market entries and exits. Key Features: Momentum-Based Analysis: Utilizes momentum to detect the top and bottom candles for swing trading opportunities. Customizable Settings: Percent K: Set the Percent K value (default
Entry Confirmation Indicator for MT5: Precision Trading for Volatility Indices The Entry Confirmation Indicator for MetaTrader 5 (MT5) is a powerful and versatile tool tailored specifically for traders who focus on volatility indices. Whether you're looking to capitalize on trend continuations or identify key reversal points, this indicator is designed to provide clear and actionable signals that enhance your trading strategy. Targeted Instruments: A Focus on Volatility This indicator is optimiz
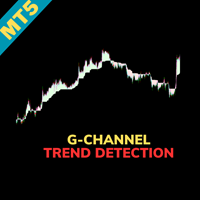
Indicator Name: G-Channel Trend Detection Overview: The G-Channel Trend Detection indicator offers a unique approach to trend analysis, leveraging AlexGrover's G-Channel methodology. This indicator provides a clear and simplified view of market trends by identifying bullish and bearish conditions based on price interactions with the G-Channel boundaries. Key Features: Trend-Based Market Analysis: The indicator determines trend direction by monitoring price action relative to the G-Channel bounda

CVD SmoothFlow Pro - Unbegrenzte Volumenanalyse für jedes Asset! CVD SmoothFlow Pro ist die ultimative Lösung für Trader, die eine präzise und unbegrenzte Volumenanalyse suchen. Mit der Berechnung des Cumulative Volume Delta (CVD) und fortschrittlicher Rauschfilterung bietet die Pro-Version die Flexibilität und Genauigkeit, die für den Handel mit jedem Finanzinstrument erforderlich sind. Was bietet CVD SmoothFlow Pro? Klarer Analyse : Filtert Marktrauschen und hebt signifikante Volumenbewe

Der Super Indicator ist eine umfassende Handelslösung, die auf neue und erfahrene Händler zugeschnitten ist. Es kombiniert über 5 Indikatoren, um Alarm zu geben
Signalklarheit: Bietet Pfeilsignale für klare Ein- und Ausstiegspunkte. Echtzeitwarnungen: Hält Händler mit Handelsein- und -ausstiegswarnungen auf dem Laufenden. Merkmale:
Kein Nachlackieren Maximale Aktivierungen 7+ Strategien 5 Indikatoren in einem Ein- und Ausstiegspunkte und Pfeile Benachrichtigungen per Telefon und E-Mail

Crash 1000 Scalping Indicator for the Crash 1000 Deriv Synthetic Index. Introduction The Crash 1000 Scalping Indicator is a specialized tool designed for the Crash 1000 index on the Deriv Synthetic market. This indicator is particularly useful for scalping on the M1 timeframe, helping traders to identify precise entry and exit points for buy positions. It is designed to be non-repainting, providing clear signals with audible alerts and push notifications, and is compatible with mobile devices th

DYJ SmoothedMA Strategy is a very simple but powerful system to get forex and s ynthetic market trend direction. This indicator is actually a moving average indicator containing 10 smoothing algorithms in a file . The indicator can help you to see the whole trend break out/rebound signal. And these BUY and SELL signals are sent out. You can use DYJ GameDevice follow-up software to receive these signals and realize automatic opening and closing of positions. And can use the game strategy fu

Looking to boost your trading performance on MT5? Introducing the signal indicator that will become your reliable ally on the path to success! This unique indicator utilizes arrows and a color-changing moving average to simplify your trading decisions. When the trend shifts upwards, the indicator turns the line blue, alerting you to potential price increases. If the trend reverses downwards, the line turns red, signaling a potential price drop. Additionally, arrows precisely indicate the optimal
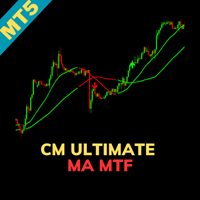
Indicator Name: CM_Ultimate_MA_MTF_V2 - Added Tilson T3 Overview: The CM_Ultimate_MA_MTF_V2 is a powerful moving average indicator that offers a high degree of customization and flexibility for traders. It supports multiple types of moving averages, including the advanced Tilson T3, and provides features such as multi-timeframe analysis, cross detection, and visual highlights. Key Features: Multi-Timeframe Flexibility: The indicator defaults to the current timeframe on the chart but allows users

The Spike Forecaster SFD is a system that was developed to catch spikes, it simple to use, its just plug and play.
It will give both Buy Alerts and Sell Alerts through arrows white and red respectively.
The system was designed to make it easier for those traders who might be busy to analyse the market hence it will just give you simple alerts to know the direction of the market. Regards
Spike Forecaster
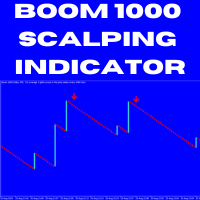
DC Boom 1000 Scalping Strategy Guide **Price**: $30 **Contact**: WhatsApp/Telegram: +27683229304 WhatsApp/Telegram: +27671192993 1. Understanding the Boom 1000 Index Boom 1000 Index: A synthetic index known for generating upward spikes. This strategy focuses on capturing the brief downward movements between spikes by selling when specific signals appear. 2. Timeframe M1 Timeframe: This strategy is exclusively designed for the 1-minute (M1) chart, allowing you to make quick trades and capture sma

This is a early support and resistance indicator. It will allow you to choose how many candles back. You can use it on all timeframes. Change the color as you like. You can use it with other indicators for better entry prediction it will give you trend for bear market and bull market. It will help you predict sideways market trending market and falling market. Save trading

Wir stellen vor: Trade Sniper: Ihr Vorsprung auf den Märkten.
MT4-Version: https://www.mql5.com/en/market/product/122371
Haben Sie es satt, profitable Trades zu verpassen oder auf der falschen Seite des Marktes zu landen? Lernen Sie Trade Sniper kennen, den hochmodernen Indikator, der die Macht der Trends nutzt, um Ihnen einen messerscharfen Vorteil beim Traden zu verschaffen.
Trend Sniper ist nicht nur ein weiterer 08/15-Indikator. Es ist ein ausgeklügeltes Tool, das fortschrittliche Algori
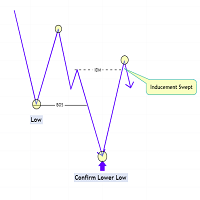
The Market Structure with Inducements & Sweeps indicator is a unique take on Smart Money Concepts related market structure labels that aims to give traders a more precise interpretation considering various factors.
Compared to traditional market structure scripts that include Change of Character (CHoCH) & Break of Structures (BOS) -- this script also includes the detection of Inducements (IDM) & Sweeps which are major components of determining other structures labeled on the chart.
SMC & pri

The Kijun Sen is a component of Ichimoku Kinko Hyo indicator. The Ichimoku Kinko Hyo is a technical analysis indicator that measures the direction, momentum, and strength of trends in the market , effectively helping traders point out trade signals where possible. Its lines also serve as support and resistance lines that give traders further insight into the market dynamics.
PLEASE CONTACT US for any assistance in the comments section. The Entry criteria used ensures that sniper entries are
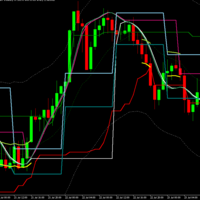
Mega Analyzer MT5 Indicator: A Comprehensive Trading Solution In the dynamic world of trading, having an edge can make all the difference. The "Mega Analyzer MT5 Indicator" offers traders that edge, providing a powerful tool that deciphers market movements with precision and clarity. Designed for both novice and experienced traders, this indicator is tailored to enhance decision-making and optimize trading strategies by revealing key price levels and market conditions that often go unnoticed by
Der MetaTrader Market ist die beste Plattform für den Verkauf von Handelsroboter und technischen Indikatoren.
Sie brauchen nur ein gefragtes Programm für die MetaTrader Plattform schreiben und schön gestalten sowie eine Beschreibung hinzufügen. Wir helfen Ihnen, das Produkt im Market Service zu veröffentlichen, wo Millionen von MetaTrader Benutzern es kaufen können. Konzentrieren Sie sich auf dem Wesentlichen - schreiben Sie Programme für Autotrading.
Sie verpassen Handelsmöglichkeiten:
- Freie Handelsapplikationen
- Über 8.000 Signale zum Kopieren
- Wirtschaftsnachrichten für die Lage an den Finanzmärkte
Registrierung
Einloggen
Wenn Sie kein Benutzerkonto haben, registrieren Sie sich
Erlauben Sie die Verwendung von Cookies, um sich auf der Website MQL5.com anzumelden.
Bitte aktivieren Sie die notwendige Einstellung in Ihrem Browser, da Sie sich sonst nicht einloggen können.