Technische Indikatoren für den MetaTrader 5 - 29

Description: The Range Breakout Catcher Indicator is a powerful tool known for its non-repainting, non-redrawing, and non-lagging capabilities, making it suitable for both manual and robot trading. This indicator utilizes a smart algorithm to calculate ranges and generate early signals for Buy and Sell positions at the breakout of these ranges, facilitating the capture of trends during ranging consolidations. The range calculation involves a comprehensive system based on various elements, prov

Trap Play refers to a market situation where price initially makes a new high or low, luring traders into believing a strong trend is forming. However, the price quickly reverses and invalidates the breakout, trapping those traders who entered positions based on the initial move. This sudden reversal often results in a rapid exit of positions, leading to significant price movement in the opposite direction. Trap plays can occur in various financial markets and timeframes and are characterized

The indicator displays a matrix of indicators across multiple timeframes with a sum total and optional alert. Custom indicators can also be added to the matrix, in a highly configurable way. The alert threshold can be set to say what percentage of indicators need to be in agreement for an alert to happen. The alerts can turned on/off via on chart tick boxes and can be set to notify to mobile or sent to email, in addition to pop-up. The product offers a great way to create an alert when multiple

The indicator displays trend slowdown or possible end of trend and price reversal. The indicator has no parameters. When red bars appear and when they become shorter, we can talk about the approaching end of the downtrend. When green bars become shorter, we can expect the approaching end of the uptrend.
FREE

This indicator identifies short-term, medium-term and long-term highs and lows of the market according to the method described by Larry Williams in the book "Long-term secrets to short-term trading".
Brief description of the principle of identifying the market highs and lows A short-term high is a high of a bar with lower highs on either side of it, and, conversely, a short-term low of a bar is a low with higher lows on either side of it. Medium-term highs and lows are determined similarly: a
FREE
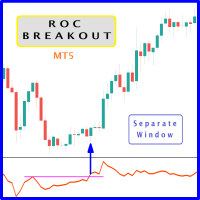
When prices breakout resistance levels are combined with Rate of Change oscillator "ROC" breaks out its historical resistance levels then higher chances emerges to record farther prices. It's strongly encouraged to confirm price breakout with oscillator breakout since they have comparable effects to price breaking support and resistance levels; certainly short trades will have the same perception. Concept is based on find swing levels which based on number of bars by each side to confirm peak or
FREE

No Demand No Supply This indicator identifies No Demand –No Supply candles to your chart and plots volume bars colored according to the signal. It can be applied to all timeframes or to a specific one only. It can also be used as regular volume indicator with exceptional future of WEIGHTED VOLUME. Furthermore is has an alert notification, sound and email when a signals occurs. The indicator does not repaint but the alert will come on two candles back due to the definition of No Demand No Su

MA Crossover and Trend Alert Indicator Latest Updates: Fixed multiple buy and sell icons on each candle for cleaner signals. Optimized alert logic to prevent duplicate notifications. Enhanced compatibility – Now works with Heiken Ashi or regular candles. Updated print statement – Alerts now log directly to alerts.txt for future reference. Overview
The EMA Crossover and Trend Alert Indicator is a trend-following tool designed to assist traders in identifying moving average crossovers and short-
Special offer : ALL TOOLS , just $35 each! New tools will be $30 for the first week or the first 3 purchases ! Trading Tools Channel on MQL5 : Join my MQL5 channel to update the latest news from me Der Lineare Regressionskanal-Indikator ist ein leistungsstarkes technisches Analysewerkzeug, das Händlern hilft, Preistrends und mögliche Umkehrpunkte zu erkennen. Durch die Berechnung und Darstellung linearer Regressionskanäle, Bänder und zukünftiger Projektionen bietet dieser Indikator

The purpose of using Smart money index (SMI) or smart money flow index is to find out investors sentiment. The index was constructed by Don Hays and measures the market action. The indicator is based on intra-day price patterns. The beginning of the trading day is supposed to represent the trading by retail traders. The majority of retail traders overreact at the beginning of the trading day because of the overnight news and economic data. There is also a lot of buying on market orders and shor
FREE

The indicator shows Jake Bernstein's MAC (Moving Average Channel) System signals ---------------------------------------- System assumes several types of entering in trade, in this indicator only one type implemented - on closing of second trigger bar. It is recommended to start using this indicator together with Jake Bernstein's free lessons https://www.youtube.com/@JakeatMBH/videos Arrow shows signal bar - enter on closing or on opening of the next bar, cross - stop level, dot - minimum profi
FREE

Данный индикатор показывает объем каждого бара (видимый диапазон) в пунктах. Гибкие настройки отображения значений. Возможна настройка параметров показа. Индикатор создавался для личного пользования, анализа графиков. Параметры: Color - цвет текстовых меток; Position - позиция метки: 0 - снизу, 1 - сверху; FontSize - размер шрифта; Angle - угол наклона текста; GapPoints - отступ по вертикальной оси.
FREE

Price Range MT5 ist ein Indikator mit einer Historie des realen Handels. Er zeichnet automatisch alle Preisbereiche, berechnet Unterstützungen und Widerstände und legt den Stop-Loss-Preis für das Öffnen von Positionen gemäß verschiedenen Strategien fest. Live-Signal eines realen Kontos: https://www.mql5.com/de/signals/2278827 Handelsstrategien des Price Range-Indikators Range-Trading zwischen Unterstützung und Widerstand; Trading der Preisbereichsausbrüche; Trading von Rebounds vom vorherigen P

"Driver Road Bands" indicator that is designed to be used in the 1H, 4H and 1D timeframes in the most ideal way. If we compare timeframes to roads and streets; main streets and highways with high traffic volume are similar to high-time timeframes in technical analysis. If you can interpret the curvilinear and linear lines drawn by this indicator on the graphic screen with your geometric perspective and develop your own buy and sell strategies; you may have the key to being a successful trader.
FREE

This indicator gives full information about the market state: strength and direction of a trend, volatility and price movement channel. It has two graphical components: Histogram: the size and the color of a bar show the strength and direction of a trend. Positive values show an ascending trend and negative values - a descending trend. Green bar is for up motion, red one - for down motion, and the yellow one means no trend. Signal line is the value of the histogram (you can enable divergence sea
FREE
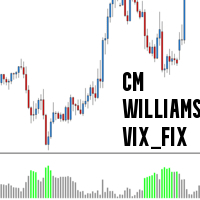
CM_Williams_Vix_Fix Indicator Description The CM_Williams_Vix_Fix is a sophisticated, volatility-based technical indicator designed to help traders identify potential market reversals by analyzing the relationship between current price lows and the highest closing prices over a specified period. Drawing inspiration from the Volatility Index (VIX)—often referred to as the "fear index"—and possibly incorporating concepts from trader Larry Williams, this indicator provides a unique perspective on
FREE
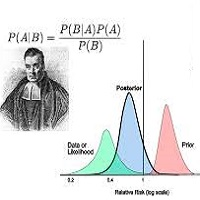
Bayesian methods can be effectively applied to predict price trends in financial markets, including Forex, stocks, and commodities. Here’s how Bayesian techniques can be used for trend prediction: 1. Bayesian Linear Regression Bayesian linear regression can be used to model the relationship between time and price. This method allows for the incorporation of prior beliefs about the trend and updates the trend as new data comes in. Example: Suppose you want to predict the price trend of a currency

Colors generated according to trading volume and market direction.
The analysis is carried out following the direction of the price and volume traded if the traded value exceeds the calculation base the system changes the color to green, informing you that the price direction is strong to buy, if the traded value is less than the calculation base the system changes to red, indicating that the price is strong for sale.
FREE

The TradeQL Indicator is a customizable tool that highlights specific trading patterns on candlestick charts. Users can define patterns through TradeQL queries, which the indicator then applies to the chart, visually representing matches and captured groups. Ideal for identifying complex trade setups in real-time.
TradeQL queries are specified using the TradeQL Language. See https://github.com/abdielou/tradeql for more details. This language is expressed as a regular expression. The language al
FREE

The indicator automatically builds Support/Resistance levels (Zones) from different timeframes on one chart.
Support-resistance levels are horizontal lines. As a rule, the market does not respond to a specific price level, but to a price range around the level, because demand and supply of market participants are not formed clearly on the line, but are “spread out” at a certain distance from the level.
This indicator determines and draws precisely such a price range within which strong positi

Indicator-forecaster. Very useful as an assistant, acts as a key point to forecast the future price movement. The forecast is made using the method of searching the most similar part in the history (pattern). The indicator is drawn as a line that shows the result of change of the close price of bars. The depth of history, the number of bars in the forecast, the patter size and the quality of search can be adjusted via the indicator settings.
Settings: PATTERN_Accuracy_ - quality of the search.
FREE

This Indicator works as a momentum oscillator however it is most used to surf the trends. Despite of being an oscillator, MACD (Moving Average Convergence/Divergence) doesn't work with over limit conditions (such as OverBought or OverSold). Graphically it's shown as two lines and an histogram with the diference of them. Standard metatrader has this indicator, however with only the two lines and without the histogram. This way it is much easier to read and uderstand it.
FREE

Investment Castle News Indicator will plot vertical lines before the news on the chart and categorized in three different colors in accordance with the news importance. You can choose to limit the news to the current chosen symbol or show all future news on the same chart. High impact news is marked in Red lines be default. Medium impact news is marked in Orange lines be default. Low impact news is marked in Yellow lines be default.
FREE

Multicurrency and multitimeframe modification of the Fractals indicator. Displays the last two fractals — their sequence (and which one is broken), or the distance between them. You can specify any desired currencies and timeframes in the parameters. Also, the panel can send notifications on a fractal's breakout. By clicking on a cell with a period, this symbol and period will be opened. This is MTF Scanner. The key to hide the dashboard from the chart is "D" by default.
Parameters Calculation

Have you ever wondered which currency is the strongest at any particular time? Or which currency pair is trending the most. Well, the currency strength meter helps with just that. It compares USD , EUR , AUD , CHF , GBP , CAD and NZD depending on the timeline you have chosen in settings, and ranks them on the number of pips each has moved compared to the rest. N/B: All currency charts of the above pairs must have loaded. You can do this by highlighting all major and minor currencies in
FREE

This indicator displays the wave structure of the market in the form several wave levels nested in each other. For each of these levels an automatic preliminary (draft) marking of waves in Elliott's style (123..., ABC... etc.) is created. This markup is completely automatic and absolutely univocal. The indicator is especially useful for beginner wave analysts, because among all the possible versions for wave marking, it allows you to immediately take the most adequate version as a ba

Box Range Indikator für MT5
Der Box Range Indikator für MT5 hilft Tradern, wichtige Preiszonen zu visualisieren, indem er Marktstrukturen automatisch erkennt und hervorhebt. Er zeichnet dynamisch obere, untere und mittlere Linien , basierend auf der Kursbewegung, und ist ein effektives Tool zur Erkennung von Unterstützungs- und Widerstandszonen, Ausbrüchen und Trendwenden .
Hauptmerkmale: • Automatische Bereichserkennung – Identifiziert Preisbereiche basierend auf Marktbewegungen.
FREE

When prices breakout resistance levels are combined with momentum oscillator breaks out its historical resistance levels then probability emerges to record farther higher prices. It's strongly encouraged to confirm price breakout with oscillator breakout since they have comparable effects to price breaking support and resistance levels; certainly short trades will have the same perception. Concept is based on find swing levels which based on number of bars by each side to confirm peak or trough
FREE

Historical Equity Flow Indicator (HEFI)
Description HEFI is an indicator for MetaTrader 5 that visualizes the dynamics of account balance and floating balance in real time. It helps traders analyze the historical effectiveness of their trading, as well as assess the current state of open positions.
What is it intended for?
Account balance tracking, taking into account closed transactions for the selected period.
Displaying a floating balance (balance + uncovered profits/losses).
Analysis o
FREE

This indicator works by plotting fractals on the chart as arrows that can be used as buy or sell signals. It is a great tool for both new and experienced traders as it provides a clear visual representation of the market and helps traders identify fractals. Although it repaints, it can be used quite effectively in conjunction with other tools to filter trading strategies.
We use this indicator in this way in our Royal Fractals EA, which you can purchase on the MQL5 Market: https://www.mql5.com
FREE
CLICK HERE TO JOIN OUR WHATSAPP GROUP.
This trading indicator Automatically identifies and plots contract blocks, which are essential zones marked by significant levels of support and resistance. This powerful tool provides traders with a clear and intuitive visualization of critical market points where prices are likely to bounce or reverse. The contract blocks, represented by distinct colored rectangles, highlight support zones (at the bottom) and resistance zones (at the top), enabling trad
FREE

Bill's Williams Awesome Oscillator signal from his book "Trading chaos 2nd edition" on bars. Normally this signal is being used for 2nd entry after 1st entry by Divergent bar ----------------------------------------------------------------------------------------------------------- Please make shure that you understand Bill's Williams system before trade with real money using this indicator. Ideal entry setup is: 1) Divergence with zero line AO crossing 2) Divergent bar on top of the final 5th
FREE

A tool for creating Bill Williams indicators Our tool provides the ability to set Bill Williams indicators on a chart with a mouse click. - The Awesome Oscillator (AO) indicator helps to assess the driving force of the trend. - Alligator indicator — determines the current state of the trend and possible entry and exit points. - Fractals indicator — helps to identify significant levels - Accelerator Oscillator (AC) indicator — shows the change in trend acceleration. - Market Facilitation Index
FREE

The script tries to determine the overall direction of the market, using smoothed Heiken Ashi candles. The coloring system (using bright and dark colors) is an attempt to detect strong market and weak market conditions. There's also an oscillator within the script
These are the features: Alert condition Features: You can now set alerts in the alert dialog for events like trend switch, trend strengthening and weakening; all for both Bullish and Bearish trend.
I also added the code for custom a
FREE

KF-BB
Professional Bollinger Bands with Alert.
Bollinger bands available in the market are mostly drawn based on simple moving average . KF-BB is the first bollinger bands that can draw the center line using all the usual methods simple , exponential, etc. A very professional indicator, it does not end here other advantages of this indicator include creating an alarm on the desktop and the mobile phone When the candlesticks hit one of the center lines or the upper and lower bands Download Demo V
FREE

This is a volume indicator with the addition of a threshold level that can be set to a fixed value chosen personally or obtained from the average of the volume values themselves. The type of averaging method can be selected in the input parameters.
The input parameters are easy to interpret but let's examine them:
1 - Volume type Here you can select the type of volume you want to see represented and there are 2 choices, either TICK volume or REAL volume. Keep in mind that for forex, for examp
FREE

The idea behind this indicator is to find all currency pairs that are over-bought or over-sold according to the RSI indicator at one go.
The RSI uses the default period of 14 (this can be changed in the settings) and scans all symbols to find the RSI level you will have specified. Once currency pairs that meet the specification are found, the indicator will open those charts for you incase those charts aren't open and proceed to write the full list of currencies on the experts tab.
FREE

InsideBarStop Indikator für den MT5
Dieser Indikator visualisiert den "Trailingstopp mit Innenstäben", den der bekannte deutsche Trader und Author Michael Voigt in "Das große Buch der Markttechnik" für den Bewegungshandel vorschlägt.
Der Trailingstopp wird als rote Linie im Chart angezeigt. Sie können den Trailingstopp zu Evaluierungszwecken an jeder beliebigen Kerze des Charts (Balken oder Kerzen) durch den Wert des Eingabeparameters "initialBarDateTime" starten
Sie können die Richtung de
FREE

The liquidity swings indicator highlights swing areas with existent trading activity. The number of times price revisited a swing area is highlighted by a zone delimiting the swing areas. Additionally, the accumulated volume within swing areas is highlighted by labels on the chart. An option to filter out swing areas with volume/counts not reaching a user-set threshold is also included.
This indicator by its very nature is not real-time and is meant for descriptive analysis alongside other com

This indicator scans for you up to 15 trading instruments and up to 21 time frames for occurrences of the high probability reversal patterns: Double Tops/Bottoms with fake breakouts . What this indicator detects: This indicator detects a special form of Double Tops and Bottoms, so called Double Tops/Bottoms with fake breakouts . For double tops with fake breakouts the highest price of the right shoulder must be higher than the left shoulder. For double bottoms with fake breakouts the lowest pric
FREE
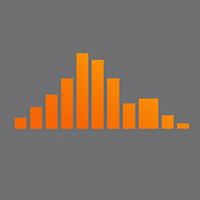
The indicator shows the price change of the current or any other instrument since the beginning of the day / week . You can choose to display it in points or as a percentage relative to the opening price of the beginning of the period . The indicator is made in the form of a histogram with two colors , for ascending and descending price changes . You can also choose which tool to show the data for . The data will be displayed on the current chart .
FREE

The indicator determines the ATR value (points) in a classic way (taking into calculation paranormal bars/candles) and more correctly - ignoring paranormal movements of the Instrument. Correctly it is excluding paranormal bars from the calculation, extremely small bars (less than 5%( customizable ) of the standard ATR) and extremely large bars (more than 150% ( customizable ) of the standard ATR) are ignored. This is a Extended version - allows you to set calculation parameters a

El indicador técnico Non Lag MA (Non-Lagged Moving Average) es una variante de la media móvil que busca reducir el retraso inherente a las medias móviles tradicionales.
Pros: - Menos retraso: Al estar diseñado para reducir el retraso, el Non Lag MA puede proporcionar señales más rápidas que las medias móviles tradicionales. - Tendencias claras: Las líneas del Non Lag MA muestran claramente las tendencias alcistas y bajistas, lo que facilita la interpretación de la dirección del mercado. - Pers
FREE

Highly configurable Force Index indicator. Features: Highly customizable alert functions (at levels, crosses, direction changes via email, push, sound, popup) Multi timeframe ability Color customization (at levels, crosses, direction changes) Linear interpolation and histogram mode options Works on strategy tester in multi timeframe mode (at weekend without ticks also) Adjustable Levels Parameters:
Force Index Timeframe: You can set the current or a higher timeframes for Force Index. Force Ind
FREE

MultiTrend Detector: System Overview The MultiTrend Detector is a comprehensive trend analysis tool that combines multiple technical indicators to identify trend direction, strength, and potential reversal points. Here's how the system works and how it can benefit traders: How the System Works Multiple Indicator Approach The system analyzes market trends using five key technical indicators: Supertrend: A volatility-based indicator that identifies the current trend direction and potential suppo
FREE
# Power Assisted Trend Following Indicator
## Overview
The PowerIndicator is an implementation of the "Power Assisted Trend Following" methodology developed by Dr. Andreas A. Aigner and Walter Schrabmair. This indicator builds upon and improves J. Welles Wilder's trend following concepts by applying principles from signal analysis to financial markets.
The core insight of this indicator is that successful trend following requires price movements to exceed a certain threshold (typically a mul
FREE

SHADOW vous donne des signaux d'achat et de vente solides avec un risque minimal. Vous pouvez voir dans quelle direction le prix évolue et la force du mouvement. Shadow filtre le bruit du marché et améliore radicalement les performances des traders.
Points forts: Détection visuelle efficace des tendances. Bruit du marché des filtres Ne repeint ni ne recalcule jamais. Signaux strictement sur "fermeture du bar". Fonctionne dans tous les symboles. Pop-up intégré, e-mail, notification push et
FREE

Der ATR Indikator Basierend auf Heiken Ashi ist ein einzigartiges Volatilitätsanalyse-Tool, das den Average True Range (ATR) mit Heiken Ashi-Kerzenberechnungen kombiniert, um eine stabilere und zuverlässigere Messung der Marktvolatilität bereitzustellen. Im Gegensatz zum herkömmlichen ATR, der Standard-Kerzen verwendet, nutzt dieser Indikator die Heiken Ashi-Formel, um Marktrauschen zu reduzieren und genauere Volatilitätssignale zu liefern.
Hauptmerkmale: • ATR-Berechnung basiere
FREE

Doji Engulfing Paths enables to get signals and data about the doji and the engulfing patterns on charts. It makes it possible to get opportunities from trends, and to follow the directional moves to get some profits on the forex and stocks markets. It is a good advantage to take all the appearing opportunities with reversal signals and direct signals in order to obtain some profits on the forex market. With the demo version, only the signals starting with the 20th candle or bar are available.
FREE

Trend Envelopes indicator is calculated based on a % of price change. That % is then used to determine if there is a new trend or trend remains the same.
This version is using Standard Deviation for the price change calculation instead and is adding prices smoothing prior to be used in calculations. The smoothing can be done using one of the 4 average types:
* Simple Moving Average
* Exponential Moving Average
* Smoothed Moving Average
* Linear Weighted Moving Average
Also, this
FREE

IQ FX Correlation Matrix is a powerful multi-timeframe dashboard that helps traders analyze real-time currency correlations across multiple forex pairs. With customizable settings, sleek design, and one-click symbol switching, it enhances trade accuracy, reduces risk, and identifies profitable correlation-based opportunities. Download the Metatrader 4 Version Message us here after purchase to get the Indicator Manual. Download Now! Offer valid only for next 10 Buyers. Price will increase gradua
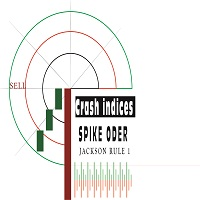
This is a powerful crash spike detector indicator. It design to work on crash only it might be crash 100 ,crash 500 or crash 300 .binary.com broker provide crash indices .on 1minete only make sure to take signals consistence .it have a notification that makes sound whenever the spike it about to shown ,it proven 98% correct since 2017 . Try it now. check the recent result on the screenshot.

I've combined two trading strategies, the Order Block Strategy and the FVG Trading Strategy, by utilizing a combination of the FVG indicators and Order Blocks. The results have been surprisingly effective.
This is a two-in-one solution that makes it easy for traders to identify critical trading zones. I've optimized the settings so that all you need to do is install and trade; it's not overly complex to explain further. No need for any usage instructions regarding the trading method. You shoul
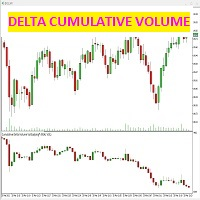
Dieser Indikator erkennt die Differenz zwischen den in Bid und Ask (Aggression) getroffenen Kontrakten für jede einzelne Kerze.
Der Indikator zeigt in dem dafür vorgesehenen Fenster unter dem Preischart Kerzen an, die genau durch die Differenz zwischen den verkauften und gekauften Kontrakten gegeben sind und die volumetrische Stärke des Marktes erzeugen.
Es ist möglich (siehe Screenshots), nur das kumulative Candlestick-Delta-Diagramm oder sogar eine Trendlinie der Kerzen selbst auszuwählen:

Dieser Indikator verfolgt effizient alle anderen Zeitrahmenkerzen, die Sie auf demselben Diagramm verfolgen möchten
1. Wählen Sie einen beliebigen höheren Zeitrahmen aus, um Balken im selben Diagramm zu laden
2. Passen Sie die Farben und den Stil der Kerzenständer an
3. Wählen Sie die Anzahl der Balken, um Kerzenhalter zu zeichnen
4. Verfolgen Sie vollständige Kerzen mit höherem Zeitrahmen zusammen mit Docht und Körper
5. Einfach und bequem für diejenigen, die nicht das Diagramm wechseln mö

MT4-Version https://www.mql5.com/en/market/product/129411 MT5-Version https://www.mql5.com/en/market/product/129412
Der Dashboard Scanner Kalman ist ein fortschrittliches Scan-Tool für mehrere Symbole und mehrere Zeitrahmen, das Ihren Handelsprozess durch Nutzung der leistungsstarken Kalman-Trendlevel- und Unterstützungs-Widerstandsberechnungen vereinfachen soll. Dieser Indikator kombiniert trendfolgende Algorithmen und präzise Unterstützungs-Widerstandsanalysen, damit Sie schnell optimale Han
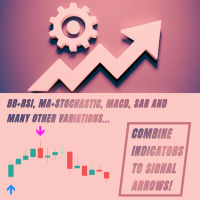
Dies ist ein Konstruktor. Das heißt, der Schöpfer von Strategien. Und nicht nur. Dies ist ein Signalindikator für die meisten standardmäßig in MetaTrader 5 integrierten Indikatoren. Kombinieren Sie Ihre Indikatoren zu einem Signalpfeil. Sie haben beispielsweise eine Strategie und müssen deren Rentabilität ermitteln, die erforderlichen Elemente in das Menü aufnehmen und Statistiken abrufen. Und wenn Sie keine Strategie haben, dann nutzen Sie sie im Internet oder erstellen Sie Ihre eigene. Rigonst

The indicator High Trend Pro monitors a big number of symbols in up to 4 timeframes simultaneously and calculates the strength of their signals. The indicator notifies you when a signal is the same in different timeframes. The indicator can do this from just one chart. Therefore, High Trend Pro is a multicurrency and multitimeframe indicator. High Trend Pro uses emproved versions of popular and highly demanded indicators for calculating its signals. High Trend Pro calculates the signal strength

Einführung in den Indikator Der Indikator basiert auf Formeln für gleitende Durchschnitte, die stabiler sind und weniger Verzögerungen aufweisen als RSI oder CCI. Der Indikator verfügt über drei Indikatorwerte, die Periode des gleitenden Durchschnitts und die Farben der Linie können manuell geändert werden. Was kann Ihnen dieser Indikator bringen? Präzise Einstiegssignale: Der Indikator zeichnet Auf- und Ab-Pfeilsignale. Mehrperioden-Trendanalyse: Wenn Sie diesen Indikator in ein großes Zei

Dieser Dashboard-Indikator mit mehreren Symbolen kann eine Warnung senden, wenn ein starker Trend erkannt wurde. Dies kann durch den Aufbau des Dashboards unter Verwendung der folgenden Indikatoren/Oszillatoren (im Folgenden nur als Indikatoren bezeichnet) erreicht werden: RSI, Stochastik, ADX, CCI, MACD, WPR (Williams Percent Range, auch Williams %R genannt), ROC (Preis). Änderungsrate) und ultimativer Oszillator. Es kann mit allen Zeitrahmen von M1 bis MN verwendet werden (es kann jeweils nur

Alert Stochastic plus delay and level Filter
A stochastic oscillator is a momentum indicator comparing a particular closing price of a security to a range of its prices over a certain period of time. We added many types of alerts plus the Level Cross Filter to aid in your search for better opportunities in the market. Product Features Sound alert Push Notification (Alerts can be sent to your mobile phone) Signs on chart Alert box Level Filter Delay Level Filter
Indicator Parameters K,D

Indikator für manuellen Handel und technische Analyse für Forex.
Es besteht aus einem Trendindikator mit dem Eröffnungsniveau des Handelstages und einem Pfeilindikator zur Bestimmung von Einstiegspunkten.
Der Indikator ändert seine Farbe nicht; er funktioniert, wenn die Kerze schließt.
Enthält verschiedene Arten von Warnungen für Signalpfeile.
Kann für die Arbeit mit jedem Diagramm, Handelsinstrument oder Zeitrahmen konfiguriert werden.
Die Arbeitsstrategie basiert auf der Suche nach Preisbewe
Der FVG-Zonenindikator MT5 ist ein leistungsstarkes Tool zur Identifizierung von Fair Value Gaps (FVG) auf dem Markt, das Preisungleichgewichte zwischen fairem Wert und Marktpreis aufzeigt. Diese präzise Identifizierung von Lücken ermöglicht es Händlern, potenzielle Markteinstiegs- und -ausstiegspunkte zu erkennen, was ihre Fähigkeit, fundierte Handelsentscheidungen zu treffen, erheblich verbessert. Mit seiner intuitiven und benutzerfreundlichen Oberfläche durchsucht der FVG Zone Ind

Divergenzen gehören zu den wichtigsten Signalen zur Vorhersage möglicher Kursumkehrungen. KT Stoch Divergence zeigt reguläre und versteckte Divergenzen zwischen dem Kurs und dem Stochastic-Oszillator.
Einschränkungen von KT Stoch Divergence
Die alleinige Nutzung von Stochastic-Divergenzen als Einstiegssignal kann riskant sein. Nicht jede Divergenz weist auf eine starke Trendumkehr hin. Für bessere Ergebnisse sollte sie mit der Preisaktion und dem Trend kombiniert werden.
Funktionen
Markiert r

The Engulf Seeker indicator is a powerful tool designed to detect engulfing candlestick patterns with precision and reliability. Built on advanced logic and customizable parameters, it offers traders valuable insights into market trends and potential reversal points.
Key Features and Benefits: Utilizes revised logic to analyze previous candles and identify strong bullish and bearish engulfing patterns. Convenient arrow-based alert system notifies traders of pattern occurrences on specific symbo

Cybertrade Double Bollinger Bands - MT5 The Bollinger Bands indicator shows the levels of different highs and lows that a security price has reached in a given duration and also their relative strength, where the highs are close to the upper line and the lows are close to the lower line. Our differential is to present this indicator in a double form, with the availability of its values to simplify automation.
It works on periods longer than the period visible on the chart. All values are
FREE
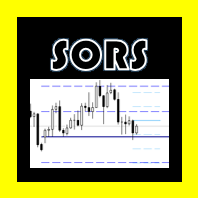
DIE SORS KOMPLEXE (Für Metatrader 5)
Dieser Indikator dient zum Zeichnen der SORS-Linien auf dem Chart. Dies ist die moderne Methode zur Berechnung von Marktpunkten, die normalerweise berücksichtigt werden. Sie bestehen aus Unterstützungen und Widerständen. Im Gegensatz zu den Klassikern werden diese jedoch aus der endogenen Volatilität und der Standardabweichung berechnet.
In der Konfiguration können Sie die Farbe jeder Ebene linear ändern und diejenigen ausblenden, die nicht benötigt werden
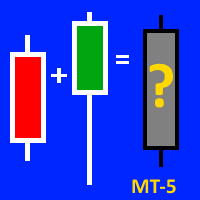
This indicator will be VERY USEFUL for anyone who works with candlestick patterns. This indicator is designed to display the average figure from two adjacent candles (current and previous). Accordingly, it shows IN CONTEXT the strength or weakness of bulls / bears (!). But please, don't forget about the classical basics of technical analysis (!). All indicators are just an auxiliary tool for reading a chart (!). A demo version on the example of mt-4 can be found here: https://www.mql5.com/ru/ma

The Mono Waves indicator is designed to display the wave behavior of the market on a chart. Its appearance is presented on slide 1. This indicator uses the PPPC (Point-Percent Price Channel) indicator, which can be downloaded for free from the Market . When the market moves up, the upper border of the price channel is built on High candlestick prices (for more details, see the description of the PPPC indicator at the link given above). The higher the High prices rise
FREE

Wir präsentieren den Volatility Doctor RSI, ein bahnbrechendes Tool, das auf dem vertrauenswürdigen RSI-Indikator aufbaut und entwickelt wurde, um Ihre Handelserfahrung wie nie zuvor zu verbessern.
Unser Indikator liefert nicht nur Echtzeit-RSI-Daten, sondern bietet auch eine präzise Prognose, wo der RSI-Wert in 10 Schritten in der Zukunft auf einem beliebigen Zeitrahmen und Symbol sein wird.
Adaptive Intelligenz: Dieses Tool lernt und passt sich jedem Markt an, integriert sich nahtlos in Ihre
FREE
Der MetaTrader Market ist die beste Plattform für den Verkauf von Handelsroboter und technischen Indikatoren.
Sie brauchen nur ein gefragtes Programm für die MetaTrader Plattform schreiben und schön gestalten sowie eine Beschreibung hinzufügen. Wir helfen Ihnen, das Produkt im Market Service zu veröffentlichen, wo Millionen von MetaTrader Benutzern es kaufen können. Konzentrieren Sie sich auf dem Wesentlichen - schreiben Sie Programme für Autotrading.
Sie verpassen Handelsmöglichkeiten:
- Freie Handelsapplikationen
- Über 8.000 Signale zum Kopieren
- Wirtschaftsnachrichten für die Lage an den Finanzmärkte
Registrierung
Einloggen
Wenn Sie kein Benutzerkonto haben, registrieren Sie sich
Erlauben Sie die Verwendung von Cookies, um sich auf der Website MQL5.com anzumelden.
Bitte aktivieren Sie die notwendige Einstellung in Ihrem Browser, da Sie sich sonst nicht einloggen können.