YouTubeにあるマーケットチュートリアルビデオをご覧ください
ロボットや指標を購入する
仮想ホスティングで
EAを実行
EAを実行
ロボットや指標を購入前にテストする
マーケットで収入を得る
販売のためにプロダクトをプレゼンテーションする方法
MetaTrader 5のためのテクニカル指標 - 29

Description: The Range Breakout Catcher Indicator is a powerful tool known for its non-repainting, non-redrawing, and non-lagging capabilities, making it suitable for both manual and robot trading. This indicator utilizes a smart algorithm to calculate ranges and generate early signals for Buy and Sell positions at the breakout of these ranges, facilitating the capture of trends during ranging consolidations. The range calculation involves a comprehensive system based on various elements, prov

Trap Play refers to a market situation where price initially makes a new high or low, luring traders into believing a strong trend is forming. However, the price quickly reverses and invalidates the breakout, trapping those traders who entered positions based on the initial move. This sudden reversal often results in a rapid exit of positions, leading to significant price movement in the opposite direction. Trap plays can occur in various financial markets and timeframes and are characterized

The indicator displays a matrix of indicators across multiple timeframes with a sum total and optional alert. Custom indicators can also be added to the matrix, in a highly configurable way. The alert threshold can be set to say what percentage of indicators need to be in agreement for an alert to happen. The alerts can turned on/off via on chart tick boxes and can be set to notify to mobile or sent to email, in addition to pop-up. The product offers a great way to create an alert when multiple

The indicator displays trend slowdown or possible end of trend and price reversal. The indicator has no parameters. When red bars appear and when they become shorter, we can talk about the approaching end of the downtrend. When green bars become shorter, we can expect the approaching end of the uptrend.
FREE

This indicator identifies short-term, medium-term and long-term highs and lows of the market according to the method described by Larry Williams in the book "Long-term secrets to short-term trading".
Brief description of the principle of identifying the market highs and lows A short-term high is a high of a bar with lower highs on either side of it, and, conversely, a short-term low of a bar is a low with higher lows on either side of it. Medium-term highs and lows are determined similarly: a
FREE
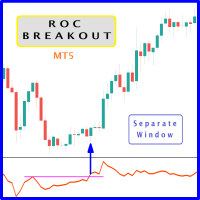
When prices breakout resistance levels are combined with Rate of Change oscillator "ROC" breaks out its historical resistance levels then higher chances emerges to record farther prices. It's strongly encouraged to confirm price breakout with oscillator breakout since they have comparable effects to price breaking support and resistance levels; certainly short trades will have the same perception. Concept is based on find swing levels which based on number of bars by each side to confirm peak or
FREE

No Demand No Supply This indicator identifies No Demand –No Supply candles to your chart and plots volume bars colored according to the signal. It can be applied to all timeframes or to a specific one only. It can also be used as regular volume indicator with exceptional future of WEIGHTED VOLUME. Furthermore is has an alert notification, sound and email when a signals occurs. The indicator does not repaint but the alert will come on two candles back due to the definition of No Demand No Su

MA Crossover and Trend Alert Indicator Latest Updates: Fixed multiple buy and sell icons on each candle for cleaner signals. Optimized alert logic to prevent duplicate notifications. Enhanced compatibility – Now works with Heiken Ashi or regular candles. Updated print statement – Alerts now log directly to alerts.txt for future reference. Overview
The EMA Crossover and Trend Alert Indicator is a trend-following tool designed to assist traders in identifying moving average crossovers and short-
Special offer : ALL TOOLS , just $35 each! New tools will be $30 for the first week or the first 3 purchases ! Trading Tools Channel on MQL5 : Join my MQL5 channel to update the latest news from me 線形回帰チャンネル指標 は、価格トレンドや潜在的な反転ポイントを捉えるための強力なテクニカル分析ツールです。線形回帰チャンネル、バンド、将来の予測を計算して表示することで、市場の動態に対する深い洞察を提供します。この指標は、買われ過ぎや売られ過ぎの状態、トレンドの方向を特定し、将来の価格動向に関する明確な視覚的手がかりを提供します。 MT4バージョンは以下で確認: Linear Regression Channel MT4 See more products at: https://www.mql5.com/en/users/ndhsfy/seller
主な

The purpose of using Smart money index (SMI) or smart money flow index is to find out investors sentiment. The index was constructed by Don Hays and measures the market action. The indicator is based on intra-day price patterns. The beginning of the trading day is supposed to represent the trading by retail traders. The majority of retail traders overreact at the beginning of the trading day because of the overnight news and economic data. There is also a lot of buying on market orders and shor
FREE

The indicator shows Jake Bernstein's MAC (Moving Average Channel) System signals ---------------------------------------- System assumes several types of entering in trade, in this indicator only one type implemented - on closing of second trigger bar. It is recommended to start using this indicator together with Jake Bernstein's free lessons https://www.youtube.com/@JakeatMBH/videos Arrow shows signal bar - enter on closing or on opening of the next bar, cross - stop level, dot - minimum profi
FREE

Данный индикатор показывает объем каждого бара (видимый диапазон) в пунктах. Гибкие настройки отображения значений. Возможна настройка параметров показа. Индикатор создавался для личного пользования, анализа графиков. Параметры: Color - цвет текстовых меток; Position - позиция метки: 0 - снизу, 1 - сверху; FontSize - размер шрифта; Angle - угол наклона текста; GapPoints - отступ по вертикальной оси.
FREE

Price Range MT5 は、実際の取引履歴を持つインジケーターです。すべての価格帯を自動的に描画し、サポートとレジスタンスを計算し、さまざまな戦略に従ってポジションを開くためのストップロス価格を設定します。 実際のアカウントのライブシグナル: https://www.mql5.com/ja/signals/2278827 Price Range インジケーターの取引戦略 サポートとレジスタンスの間のレンジ取引。 価格帯ブレイクアウトの取引。 以前の価格帯からのリバウンドの取引。 偽のブレイクアウト取引。 Price Range インジケーターの機能
インジケーターはすべての価格帯を自動的に描画するため、追加の描画ツールは必要ありません。表示されているすべての範囲を削除する場合は、チャートからインジケーターを削除します。 インジケーターによって構築された価格帯が十分に安定している場合、インジケーターはその中にサポートとレジスタンスを自動的に見つけます。これらは、価格が非常に高い確率で跳ね返る価格レベルです。 このインジケーターは、最後に見つかった価格帯に少なくとも 1 つのサポ

"Driver Road Bands" indicator that is designed to be used in the 1H, 4H and 1D timeframes in the most ideal way. If we compare timeframes to roads and streets; main streets and highways with high traffic volume are similar to high-time timeframes in technical analysis. If you can interpret the curvilinear and linear lines drawn by this indicator on the graphic screen with your geometric perspective and develop your own buy and sell strategies; you may have the key to being a successful trader.
FREE

This indicator gives full information about the market state: strength and direction of a trend, volatility and price movement channel. It has two graphical components: Histogram: the size and the color of a bar show the strength and direction of a trend. Positive values show an ascending trend and negative values - a descending trend. Green bar is for up motion, red one - for down motion, and the yellow one means no trend. Signal line is the value of the histogram (you can enable divergence sea
FREE
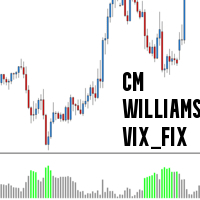
CM_Williams_Vix_Fix Indicator Description The CM_Williams_Vix_Fix is a sophisticated, volatility-based technical indicator designed to help traders identify potential market reversals by analyzing the relationship between current price lows and the highest closing prices over a specified period. Drawing inspiration from the Volatility Index (VIX)—often referred to as the "fear index"—and possibly incorporating concepts from trader Larry Williams, this indicator provides a unique perspective on
FREE
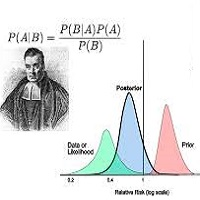
Bayesian methods can be effectively applied to predict price trends in financial markets, including Forex, stocks, and commodities. Here’s how Bayesian techniques can be used for trend prediction: 1. Bayesian Linear Regression Bayesian linear regression can be used to model the relationship between time and price. This method allows for the incorporation of prior beliefs about the trend and updates the trend as new data comes in. Example: Suppose you want to predict the price trend of a currency

Colors generated according to trading volume and market direction.
The analysis is carried out following the direction of the price and volume traded if the traded value exceeds the calculation base the system changes the color to green, informing you that the price direction is strong to buy, if the traded value is less than the calculation base the system changes to red, indicating that the price is strong for sale.
FREE

The TradeQL Indicator is a customizable tool that highlights specific trading patterns on candlestick charts. Users can define patterns through TradeQL queries, which the indicator then applies to the chart, visually representing matches and captured groups. Ideal for identifying complex trade setups in real-time.
TradeQL queries are specified using the TradeQL Language. See https://github.com/abdielou/tradeql for more details. This language is expressed as a regular expression. The language al
FREE

The indicator automatically builds Support/Resistance levels (Zones) from different timeframes on one chart.
Support-resistance levels are horizontal lines. As a rule, the market does not respond to a specific price level, but to a price range around the level, because demand and supply of market participants are not formed clearly on the line, but are “spread out” at a certain distance from the level.
This indicator determines and draws precisely such a price range within which strong positi

Indicator-forecaster. Very useful as an assistant, acts as a key point to forecast the future price movement. The forecast is made using the method of searching the most similar part in the history (pattern). The indicator is drawn as a line that shows the result of change of the close price of bars. The depth of history, the number of bars in the forecast, the patter size and the quality of search can be adjusted via the indicator settings.
Settings: PATTERN_Accuracy_ - quality of the search.
FREE

This Indicator works as a momentum oscillator however it is most used to surf the trends. Despite of being an oscillator, MACD (Moving Average Convergence/Divergence) doesn't work with over limit conditions (such as OverBought or OverSold). Graphically it's shown as two lines and an histogram with the diference of them. Standard metatrader has this indicator, however with only the two lines and without the histogram. This way it is much easier to read and uderstand it.
FREE

Investment Castle News Indicator will plot vertical lines before the news on the chart and categorized in three different colors in accordance with the news importance. You can choose to limit the news to the current chosen symbol or show all future news on the same chart. High impact news is marked in Red lines be default. Medium impact news is marked in Orange lines be default. Low impact news is marked in Yellow lines be default.
FREE

Multicurrency and multitimeframe modification of the Fractals indicator. Displays the last two fractals — their sequence (and which one is broken), or the distance between them. You can specify any desired currencies and timeframes in the parameters. Also, the panel can send notifications on a fractal's breakout. By clicking on a cell with a period, this symbol and period will be opened. This is MTF Scanner. The key to hide the dashboard from the chart is "D" by default.
Parameters Calculation

Have you ever wondered which currency is the strongest at any particular time? Or which currency pair is trending the most. Well, the currency strength meter helps with just that. It compares USD , EUR , AUD , CHF , GBP , CAD and NZD depending on the timeline you have chosen in settings, and ranks them on the number of pips each has moved compared to the rest. N/B: All currency charts of the above pairs must have loaded. You can do this by highlighting all major and minor currencies in
FREE

This indicator displays the wave structure of the market in the form several wave levels nested in each other. For each of these levels an automatic preliminary (draft) marking of waves in Elliott's style (123..., ABC... etc.) is created. This markup is completely automatic and absolutely univocal. The indicator is especially useful for beginner wave analysts, because among all the possible versions for wave marking, it allows you to immediately take the most adequate version as a ba

The Box Range Indicator for MT5 helps traders visualize key price zones by automatically detecting and highlighting market structures. It dynamically draws upper, lower, and middle levels based on price action, making it an effective tool for identifying support and resistance zones, breakouts, and trend reversals .
Key Features: • Automatic Box Detection – Identifies price ranges based on market movements. • Dynamic High and Low Updates – Adjusts in real time to reflect market conditions.
FREE

When prices breakout resistance levels are combined with momentum oscillator breaks out its historical resistance levels then probability emerges to record farther higher prices. It's strongly encouraged to confirm price breakout with oscillator breakout since they have comparable effects to price breaking support and resistance levels; certainly short trades will have the same perception. Concept is based on find swing levels which based on number of bars by each side to confirm peak or trough
FREE

Historical Equity Flow Indicator (HEFI)
Description HEFI is an indicator for MetaTrader 5 that visualizes the dynamics of account balance and floating balance in real time. It helps traders analyze the historical effectiveness of their trading, as well as assess the current state of open positions.
What is it intended for?
Account balance tracking, taking into account closed transactions for the selected period.
Displaying a floating balance (balance + uncovered profits/losses).
Analysis o
FREE

This indicator works by plotting fractals on the chart as arrows that can be used as buy or sell signals. It is a great tool for both new and experienced traders as it provides a clear visual representation of the market and helps traders identify fractals. Although it repaints, it can be used quite effectively in conjunction with other tools to filter trading strategies.
We use this indicator in this way in our Royal Fractals EA, which you can purchase on the MQL5 Market: https://www.mql5.com
FREE
CLICK HERE TO JOIN OUR WHATSAPP GROUP.
This trading indicator Automatically identifies and plots contract blocks, which are essential zones marked by significant levels of support and resistance. This powerful tool provides traders with a clear and intuitive visualization of critical market points where prices are likely to bounce or reverse. The contract blocks, represented by distinct colored rectangles, highlight support zones (at the bottom) and resistance zones (at the top), enabling trad
FREE

Bill's Williams Awesome Oscillator signal from his book "Trading chaos 2nd edition" on bars. Normally this signal is being used for 2nd entry after 1st entry by Divergent bar ----------------------------------------------------------------------------------------------------------- Please make shure that you understand Bill's Williams system before trade with real money using this indicator. Ideal entry setup is: 1) Divergence with zero line AO crossing 2) Divergent bar on top of the final 5th
FREE

A tool for creating Bill Williams indicators Our tool provides the ability to set Bill Williams indicators on a chart with a mouse click. - The Awesome Oscillator (AO) indicator helps to assess the driving force of the trend. - Alligator indicator — determines the current state of the trend and possible entry and exit points. - Fractals indicator — helps to identify significant levels - Accelerator Oscillator (AC) indicator — shows the change in trend acceleration. - Market Facilitation Index
FREE

The script tries to determine the overall direction of the market, using smoothed Heiken Ashi candles. The coloring system (using bright and dark colors) is an attempt to detect strong market and weak market conditions. There's also an oscillator within the script
These are the features: Alert condition Features: You can now set alerts in the alert dialog for events like trend switch, trend strengthening and weakening; all for both Bullish and Bearish trend.
I also added the code for custom a
FREE

KF-BB
Professional Bollinger Bands with Alert.
Bollinger bands available in the market are mostly drawn based on simple moving average . KF-BB is the first bollinger bands that can draw the center line using all the usual methods simple , exponential, etc. A very professional indicator, it does not end here other advantages of this indicator include creating an alarm on the desktop and the mobile phone When the candlesticks hit one of the center lines or the upper and lower bands Download Demo V
FREE

This is a volume indicator with the addition of a threshold level that can be set to a fixed value chosen personally or obtained from the average of the volume values themselves. The type of averaging method can be selected in the input parameters.
The input parameters are easy to interpret but let's examine them:
1 - Volume type Here you can select the type of volume you want to see represented and there are 2 choices, either TICK volume or REAL volume. Keep in mind that for forex, for examp
FREE

The idea behind this indicator is to find all currency pairs that are over-bought or over-sold according to the RSI indicator at one go.
The RSI uses the default period of 14 (this can be changed in the settings) and scans all symbols to find the RSI level you will have specified. Once currency pairs that meet the specification are found, the indicator will open those charts for you incase those charts aren't open and proceed to write the full list of currencies on the experts tab.
FREE

InsideBarStop Indicator for MT5
This indicator can be used to show and evaluate the trailing stop algorithm "Trailing Stop with Inside Bars" that was proposed by the famous German trader and author Michael Voigt ("Das grosse Buch der Markttechnik") to capture robust gains when trading strong price moves. The trailing stop price is shown as a red line. You can start the trailing stop anywhere on your chart (bars or candles) by setting the "initialBarDateTime" input parameter to the open time of
FREE

The liquidity swings indicator highlights swing areas with existent trading activity. The number of times price revisited a swing area is highlighted by a zone delimiting the swing areas. Additionally, the accumulated volume within swing areas is highlighted by labels on the chart. An option to filter out swing areas with volume/counts not reaching a user-set threshold is also included.
This indicator by its very nature is not real-time and is meant for descriptive analysis alongside other com

This indicator scans for you up to 15 trading instruments and up to 21 time frames for occurrences of the high probability reversal patterns: Double Tops/Bottoms with fake breakouts . What this indicator detects: This indicator detects a special form of Double Tops and Bottoms, so called Double Tops/Bottoms with fake breakouts . For double tops with fake breakouts the highest price of the right shoulder must be higher than the left shoulder. For double bottoms with fake breakouts the lowest pric
FREE
The indicator shows the price change of the current or any other instrument since the beginning of the day / week . You can choose to display it in points or as a percentage relative to the opening price of the beginning of the period . The indicator is made in the form of a histogram with two colors , for ascending and descending price changes . You can also choose which tool to show the data for . The data will be displayed on the current chart .
FREE

The indicator determines the ATR value (points) in a classic way (taking into calculation paranormal bars/candles) and more correctly - ignoring paranormal movements of the Instrument. Correctly it is excluding paranormal bars from the calculation, extremely small bars (less than 5%( customizable ) of the standard ATR) and extremely large bars (more than 150% ( customizable ) of the standard ATR) are ignored. This is a Extended version - allows you to set calculation parameters a

El indicador técnico Non Lag MA (Non-Lagged Moving Average) es una variante de la media móvil que busca reducir el retraso inherente a las medias móviles tradicionales.
Pros: - Menos retraso: Al estar diseñado para reducir el retraso, el Non Lag MA puede proporcionar señales más rápidas que las medias móviles tradicionales. - Tendencias claras: Las líneas del Non Lag MA muestran claramente las tendencias alcistas y bajistas, lo que facilita la interpretación de la dirección del mercado. - Pers
FREE

Highly configurable Force Index indicator. Features: Highly customizable alert functions (at levels, crosses, direction changes via email, push, sound, popup) Multi timeframe ability Color customization (at levels, crosses, direction changes) Linear interpolation and histogram mode options Works on strategy tester in multi timeframe mode (at weekend without ticks also) Adjustable Levels Parameters:
Force Index Timeframe: You can set the current or a higher timeframes for Force Index. Force Ind
FREE

MultiTrend Detector: System Overview The MultiTrend Detector is a comprehensive trend analysis tool that combines multiple technical indicators to identify trend direction, strength, and potential reversal points. Here's how the system works and how it can benefit traders: How the System Works Multiple Indicator Approach The system analyzes market trends using five key technical indicators: Supertrend: A volatility-based indicator that identifies the current trend direction and potential suppo
FREE
# Power Assisted Trend Following Indicator
## Overview
The PowerIndicator is an implementation of the "Power Assisted Trend Following" methodology developed by Dr. Andreas A. Aigner and Walter Schrabmair. This indicator builds upon and improves J. Welles Wilder's trend following concepts by applying principles from signal analysis to financial markets.
The core insight of this indicator is that successful trend following requires price movements to exceed a certain threshold (typically a mul
FREE

SHADOW vous donne des signaux d'achat et de vente solides avec un risque minimal. Vous pouvez voir dans quelle direction le prix évolue et la force du mouvement. Shadow filtre le bruit du marché et améliore radicalement les performances des traders.
Points forts: Détection visuelle efficace des tendances. Bruit du marché des filtres Ne repeint ni ne recalcule jamais. Signaux strictement sur "fermeture du bar". Fonctionne dans tous les symboles. Pop-up intégré, e-mail, notification push et
FREE

The ATR Indicator Based on Heiken Ashi is a unique volatility analysis tool that combines the Average True Range (ATR) with Heiken Ashi candlestick calculations to provide a smoother and more reliable measure of market volatility. Unlike the traditional ATR, which uses standard candlesticks, this indicator applies the Heiken Ashi formula to filter out market noise and deliver a clearer volatility signal.
Key Features: • ATR Calculation Based on Heiken Ashi Candlesticks – Offers a more stable v
FREE

Doji Engulfing Paths enables to get signals and data about the doji and the engulfing patterns on charts. It makes it possible to get opportunities from trends, and to follow the directional moves to get some profits on the forex and stocks markets. It is a good advantage to take all the appearing opportunities with reversal signals and direct signals in order to obtain some profits on the forex market. With the demo version, only the signals starting with the 20th candle or bar are available.
FREE

Trend Envelopes indicator is calculated based on a % of price change. That % is then used to determine if there is a new trend or trend remains the same.
This version is using Standard Deviation for the price change calculation instead and is adding prices smoothing prior to be used in calculations. The smoothing can be done using one of the 4 average types:
* Simple Moving Average
* Exponential Moving Average
* Smoothed Moving Average
* Linear Weighted Moving Average
Also, this
FREE

IQ FX Correlation Matrix is a powerful multi-timeframe dashboard that helps traders analyze real-time currency correlations across multiple forex pairs. With customizable settings, sleek design, and one-click symbol switching, it enhances trade accuracy, reduces risk, and identifies profitable correlation-based opportunities. Download the Metatrader 4 Version Message us here after purchase to get the Indicator Manual. Download Now! Offer valid only for next 10 Buyers. Price will increase gradua
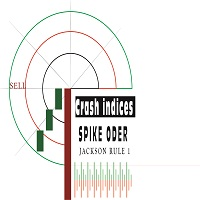
This is a powerful crash spike detector indicator. It design to work on crash only it might be crash 100 ,crash 500 or crash 300 .binary.com broker provide crash indices .on 1minete only make sure to take signals consistence .it have a notification that makes sound whenever the spike it about to shown ,it proven 98% correct since 2017 . Try it now. check the recent result on the screenshot.

I've combined two trading strategies, the Order Block Strategy and the FVG Trading Strategy, by utilizing a combination of the FVG indicators and Order Blocks. The results have been surprisingly effective.
This is a two-in-one solution that makes it easy for traders to identify critical trading zones. I've optimized the settings so that all you need to do is install and trade; it's not overly complex to explain further. No need for any usage instructions regarding the trading method. You shoul
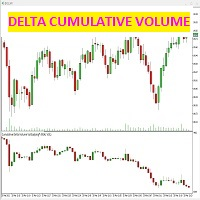
このインジケーターは、各ろうそくのビッドとアスク(アグレッシブ)で成立した契約の違いを検出します。
インジケーターは、価格チャートの下の専用ウィンドウに、販売された契約と購入された契約の違いによって正確に与えられたキャンドルを示します。これは、市場のボリュームの強さを生み出します。
累積ローソク足デルタチャートのみを選択する方法、またはキャンドル自体のトレンドラインを使用する方法も可能です。2番目のボックスu "NONE"を選択すると、トレンドラインは描画されませんが、色を選択すると、ボリュームキャンドルのトレンドラインは、それらと一緒にチャートに表示されます。
この指標は何のためのものですか?価格チャートをボリュームデルタチャートと比較すると、市場の真の強さを確認できます。2つのチャートの収束により、価格の正しい上昇/下降が決定されますが、価格とボリュームデルタの相違はシグナルアラートである必要があります。トレーダーにとっては、価格が逆転するはずだからです。この指標は、取引戦略と一緒に使用して、誤ったシグナルをフィルタリングし、価格と出来高の間の相違の段階で発生するシグナルを

このインジケーターは、同じチャート上で追跡したい他の時間枠のローソク足を効率的に追跡します。
1. 同じチャートにバーをロードするには、より高い時間枠を選択します
2.ローソク足の色とスタイルをカスタマイズする
3. ローソク足を描画するバーの数を選択します
4. 芯と本体とともにより高いタイムフレームの完全なキャンドルを追跡する
5. チャートを切り替えたくない人にとっては簡単で便利です。
このインジケーターは、同じチャート上で追跡したい他の時間枠のローソク足を効率的に追跡します。
1. 同じチャートにバーをロードするには、より高い時間枠を選択します
2.ローソク足の色とスタイルをカスタマイズする
3. ローソク足を描画するバーの数を選択します
4. 芯と本体とともにより高いタイムフレームの完全なキャンドルを追跡する
5. チャートを切り替えたくない人にとっては簡単で便利です。

MT4 バージョン https://www.mql5.com/en/market/product/129411 MT5 バージョン https://www.mql5.com/en/market/product/129412
ダッシュボード スキャナー カルマンは、強力なカルマン トレンド レベルとサポート レジスタンス計算を活用して取引プロセスを簡素化するように設計された、高度なマルチシンボルおよびマルチタイムフレーム スキャン ツールです。このインジケーターは、トレンド追跡アルゴリズムと高精度のサポート レジスタンス分析を組み合わせて、複数の通貨ペアとタイムフレームにわたって最適な取引機会をすばやく特定するのに役立ちます。
主な機能 1. カルマン ベースのトレンド分析 カルマン フィルターを使用して価格変動に動的に適応し、トレンドを平滑化しながらノイズを減らします。これにより、トレンド レベルと重要なゾーンを正確に特定できます。 2. サポートとレジスタンスの検出 - カルマン フィルターされた価格アクションに基づいて、主要なサポートとレジスタンス レベルを自動的に計算します
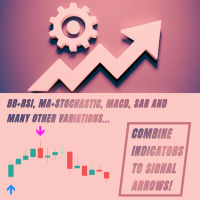
これはコンストラクターです。つまり戦略の立案者です。それだけではありません。これは、MetaTrader 5 のほとんどの標準組み込みインジケーターのシグナル インジケーターです。インジケーターをシグナル矢印に結合します。たとえば、戦略があり、その収益性を調べ、必要な項目をメニューに含めて統計を取得する必要があります。戦略がない場合は、インターネットで戦略を取得するか、独自の戦略を作成してください。 Rigonstruktor がこれらすべてをお手伝いします。このキットには、外国為替、スキャルピング、バイナリー オプション用の既成の戦略が含まれています。テキストによる説明書が付属しています。ビデオトレーニングレッスンはすでに準備が整っています。サポートやヘルプのための電報チャットもあります。インジケーターを取り出して接続します。矢を入手してください。戦略を探ります。統計を見て結論を導き出します。デザイナーはそのためにすべてを備えています。時間フィルターなど、さまざまなバリエーションがあります。サポートやヘルプ チャットでいつでも質問したり調べたりすることができます。コンストラクターのバ

The indicator High Trend Pro monitors a big number of symbols in up to 4 timeframes simultaneously and calculates the strength of their signals. The indicator notifies you when a signal is the same in different timeframes. The indicator can do this from just one chart. Therefore, High Trend Pro is a multicurrency and multitimeframe indicator. High Trend Pro uses emproved versions of popular and highly demanded indicators for calculating its signals. High Trend Pro calculates the signal strength

指標の紹介 このインジケーターは移動平均式に従って設計されており、RSI や CCI よりも安定しており、遅れが少ないです 。このインジケーターには 3 つのインジケーター値、移動平均期間、および線の色があり、手動で変更できます。 このインジケーターは何をもたらすのでしょうか? 正確なエントリーシグナル: インジケーターは上下の矢印シグナルを描画します。 複数期間のトレンド分析: このインジケーターを大きな時間枠チャートと小さな時間枠チャートにロードすると、使用の効果が向上します。大きな時間足チャートではインジケーターの色に従ってトレンドの方向を判断し、小さな時間足チャートではシグナルに従って市場にエントリーします。 高価格と安値セクションの判断: インジケーターの値は常に 0 から 100 の間であり、これに基づいて価格の相対的な位置を分析できます。トレンドラインが 80 より高い場合、価格が買われ過ぎのセクションにある場合、買いポジションをオープンする機会を選択できます。トレンドラインが 20 を下回っている場合、価格は売られ過ぎの セクション にあり、売りポジションをオープンす

このマルチシンボル ダッシュボード インジケーターは、強いトレンドが特定されたときにアラートを送信できます。これは、次のインジケーター/オシレーター (以下、インジケーターとしてのみ言及します) を使用してダッシュボードを構築することで実現できます: RSI、ストキャスティクス、ADX、CCI、MACD、WPR (ウィリアムズ パーセント レンジ、ウィリアムズ %R とも呼ばれます)、ROC (価格)変化率)と究極のオシレーター。 M1 から MN までのすべてのタイムフレームで使用できます (一度に 1 つのタイムフレームのみを表示できます)。勢い、ボラティリティ、買われすぎ/売られすぎなどについての視点が得られます。このインジケーターを独自のルールやテクニックと組み合わせることで、独自の強力なシステムを作成 (または強化) することができます。 特徴
ボタンをクリックすることで時間枠を切り替えることができます。 ダッシュボード内でトレンド強度ランクのソートを継続的に実行します。ただし、特定のシンボルを見つけやすくするために並べ替えを無効にすることもできます。シンボルは、[シンボル

Alert Stochastic plus delay and level Filter
A stochastic oscillator is a momentum indicator comparing a particular closing price of a security to a range of its prices over a certain period of time. We added many types of alerts plus the Level Cross Filter to aid in your search for better opportunities in the market. Product Features Sound alert Push Notification (Alerts can be sent to your mobile phone) Signs on chart Alert box Level Filter Delay Level Filter
Indicator Parameters K,D

Indicator for manual trading and technical analysis for Forex.
It consists of a trend indicator with the opening level of the trading day and a arrow indicator for determining entry points.
The indicator does not recolor; it works when the candle closes.
Contains several types of alerts for signal arrows.
Can be configured to work on any chart, trading instrument or time frame.
The work strategy is based on searching for price movements along the trend.
To make " Buy " transactions: The tre
の FVGゾーンインジケーターMT5 は、市場における公正価値ギャップ (FVG) を特定し、公正価値と市場価格の間の価格不均衡を浮き彫りにするように設計された強力なツールです。このギャップの正確な特定により、トレーダーは潜在的な市場参入および市場退出ポイントを見つけることができ、情報に基づいた取引決定を行う能力が大幅に向上します。 FVG ゾーン インジケーターは、直感的でユーザー フレンドリーなインターフェイスを備えており、チャート上の公正価値ギャップを自動的にスキャンして、価格チャートにこれらのゾーンをリアルタイムでマークします。これにより、トレーダーは、今後の価格修正やトレンドの継続を示唆する可能性のある潜在的な価格の不均衡を迅速かつ簡単に認識できます。 主な機能は次のとおりです。 リアルタイムギャップ検出: FVG が表示されると自動的に識別してマークします。 ギャップサイズをピップ単位で表示: このインジケーターは、特定された各ギャップのサイズをピップ単位で表示し、トレーダーがギャップの重要性を理解するのに役立ちます。 現在の価格からのピ

ダイバージェンス(乖離)は、市場における価格の反転を示す重要なシグナルのひとつです。KT Stoch Divergence は、価格とストキャスティクスオシレーターの間に発生するレギュラーおよびヒドゥンダイバージェンスを視覚的に表示します。
KT Stoch Divergence の注意点
ストキャスティクスのダイバージェンスだけをエントリーシグナルにするのはリスクがあります。すべてのダイバージェンスが反転を意味するわけではありません。プライスアクションやトレンドの方向と組み合わせて使用するのがおすすめです。
特徴
価格とストキャスティクス間のレギュラーおよびヒドゥンダイバージェンスをマーク。 トレンドの反転・継続両方に対応した戦略に使用可能。 エキスパートアドバイザー(EA)への組み込みに完全対応。 非対称なダイバージェンスは除外し、精度を向上。 エントリーだけでなく、エグジットにも利用可能。 すべてのMTアラート機能に対応。
そもそもダイバージェンスとは? 一般的に、価格が高値を更新するとき、オシレーターも高値を更新すべきです。同様に、安値を更新するときは、オシレーターも安

The Engulf Seeker indicator is a powerful tool designed to detect engulfing candlestick patterns with precision and reliability. Built on advanced logic and customizable parameters, it offers traders valuable insights into market trends and potential reversal points.
Key Features and Benefits: Utilizes revised logic to analyze previous candles and identify strong bullish and bearish engulfing patterns. Convenient arrow-based alert system notifies traders of pattern occurrences on specific symbo

Cybertrade Double Bollinger Bands - MT5 The Bollinger Bands indicator shows the levels of different highs and lows that a security price has reached in a given duration and also their relative strength, where the highs are close to the upper line and the lows are close to the lower line. Our differential is to present this indicator in a double form, with the availability of its values to simplify automation.
It works on periods longer than the period visible on the chart. All values are
FREE
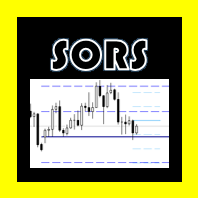
SORS COMPLEXES(Metatrader 5の場合)
このインディケータはチャート上にSORSラインを描くように設計されています。これらは通常尊重されるマーケットポイントを計算する最新の方法であり、サポートとレジスタンスで構成されていますが、クラシックとは異なり、これらはボラティリティの内因性と標準偏差から計算されます。
構成では、各レベルの線形の色を変更し、不要なレベルを非表示にすることができます。
A =年次。
M =毎月。
W =毎週
D =毎日。
SORS COMPLEXES(Metatrader 5の場合)
このインディケータはチャート上にSORSラインを描くように設計されています。これらは通常尊重されるマーケットポイントを計算する最新の方法であり、サポートとレジスタンスで構成されていますが、クラシックとは異なり、これらはボラティリティの内因性と標準偏差から計算されます。
構成では、各レベルの線形の色を変更し、不要なレベルを非表示にすることができます。
A =年次。
M =毎月。
W =毎週
D =毎日。
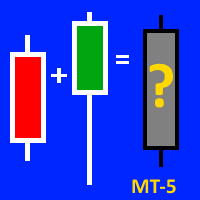
This indicator will be VERY USEFUL for anyone who works with candlestick patterns. This indicator is designed to display the average figure from two adjacent candles (current and previous). Accordingly, it shows IN CONTEXT the strength or weakness of bulls / bears (!). But please, don't forget about the classical basics of technical analysis (!). All indicators are just an auxiliary tool for reading a chart (!). A demo version on the example of mt-4 can be found here: https://www.mql5.com/ru/ma

The Mono Waves indicator is designed to display the wave behavior of the market on a chart. Its appearance is presented on slide 1. This indicator uses the PPPC (Point-Percent Price Channel) indicator, which can be downloaded for free from the Market . When the market moves up, the upper border of the price channel is built on High candlestick prices (for more details, see the description of the PPPC indicator at the link given above). The higher the High prices rise
FREE

Volatility Doctor RSIをご紹介します。これは、信頼できるRSI指標を基に構築された画期的なツールであり、これまでにないトレーディング体験を提供するために設計されています。
当社のインジケーターは、リアルタイムのRSI読みを提供するだけでなく、選択した時間枠と好きな取引シンボルにおいて、RSIの読みが将来の10ステップ先にどこに位置するかを正確に予測します。
適応型インテリジェンス:このツールは市場に適応し、あなたのユニークなトレーディング戦略にシームレスに統合され、意思決定プロセスを向上させます。
Volatility Doctor RSIで今日からトレーディングを高めましょう。
あなたに平和と繁栄、そして利益をもたらす取引を願っています。
Gamuchirai Zororo Ndawana
Volatility Doctor.
FREE
MetaTraderマーケットはトレーダーのための自動売買ロボットやテクニカル指標を備えており、 ターミナルから直接利用することができます。
MQL5.community支払いシステムはMetaTraderサービス上のトランザクションのためにMQL5.comサイトに登録したすべてのユーザーに利用可能です。WebMoney、PayPal または銀行カードを使っての入金や出金が可能です。
取引の機会を逃しています。
- 無料取引アプリ
- 8千を超えるシグナルをコピー
- 金融ニュースで金融マーケットを探索
新規登録
ログイン