Technische Indikatoren für den MetaTrader 4 - 20
IceFX VelocityMeter is a very unique indicator on MetaTrader 4 platform which measures the speed of the forex market. It's not a normal volume or other measurement indicator because IceFX VelocityMeter is capable to understand market speed movements which are hidden in ticks and those valuable information cannot be read in an ordinary way from the candles. The software monitors the received ticks (frequency, magnitude of change) within a specified time range, analyzes these info and defines, dis
FREE

Entdecken Sie die Macht der Volumenanalyse mit unserem Volumenprofil-Indikator für Metatrader! / MT5-Version
Basic Volume Profile ist ein Indikator, der speziell für manuelle Trader entwickelt wurde, die ihren Handel optimieren wollen. Der Volumenprofil-Indikator ist ein unverzichtbares Werkzeug für jeden ernsthaften Trader, der das Marktverhalten besser verstehen möchte. Mit unserer innovativen Lösung können Sie klar und übersichtlich darstellen, wie sich das Handelsvolumen auf die Preise ve

An indicator from the zigzag family with levels. First of all, I will point out arguments in favor of the advisability of using a level indicator. They give the trader the following benefits:
Alternative points of view - the level indicator helps to look at the levels from the side, compare them with several automatic systems, identify errors;
Saving time - reducing the cost of effort for self-building lines;
Exact mathematical calculation - quick calculation of levels, ratios of indicato

Relative Volume or RVOL is an indicator that averages the volume of X amount of days, making it easy to compare sessions volumes.
The histogram only has 3 colors:
Green - Above average volume
Yellow - Average volume
Red - Below average volume
The default setting is 20 days, which corresponds more or less to a month of trading.
With the data obtained from this indicator you can better gauge the commitment behind a move. For example, you will be better equipped to judge if a bre
FREE
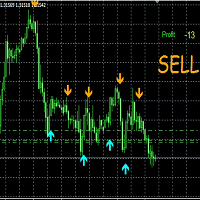
Your money-making tool is here!! This is an indicator that provides analysis and identification of the current trend in any time frame of any trading market, Product now free, please register by link here: Broker recommened exness , Channel live trading Signals Vip :
Signal https://www.mql5.com/en/signals/2229365 EA https://www.mql5.com/en/market/product/104810 Profit from 10% to 30% per month, try it now with 5k-10k$ to have good income
Only copy and profit will auto
FREE
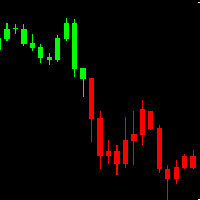
AH Candles MT4 AH Candles MT4 is a new product that allows identifying the current market phase (uptrend and downtrend ).
This indicator paints bars in different colors depending on the current state of the market trend ( Green and Red )
AH Candles MT4 is use for trading currencies
Advantages Suitable for intraday and swing trading. The indicator base on EMA method to calculate Period Parameters It can be used as a standalone tool or together with other indicators.
How to use
FREE

Smoothed oscillator based on basic DeMarker indicators. Shows the volatility of the price direction. Can be used to determine intraday entry and exit points from the market.
Suitable for use on all time frames and trading instruments. It is recommended to use on M5, M15 and M30.
The green line shows the price direction up, the blue line shows the price direction down. The red line is a smoothed representation of the price. Input parameters
Period - Period of the main indicator DeMarker
FREE

McS Super Trend -This is one of the most popular classic trend indicators. It has a simple setting, allows you to work not only with the trend, but also displays the stop loss level, which is calculated by this indicator. Benefits:
Instruments: Currency pairs , stocks, commodities, indices, cryptocurrencies. Timeframe: М15 and higher. Trading time: Around the clock. Shows the direction of the current trend. Calculates the stop loss. It can be used when working with trading. Three types of no
FREE

VR Cub ist ein Indikator für den Erhalt hochwertiger Einstiegspunkte. Der Indikator wurde entwickelt, um mathematische Berechnungen zu erleichtern und die Suche nach Einstiegspunkten in eine Position zu vereinfachen. Die Handelsstrategie, für die der Indikator geschrieben wurde, hat sich seit vielen Jahren bewährt. Ihr großer Vorteil liegt in der Einfachheit der Handelsstrategie, die es auch unerfahrenen Händlern ermöglicht, erfolgreich damit zu handeln. VR Cub berechnet Positionseröffnungspunkt
Индикатор Free Pro Level предназначен для автоматического построения уровней поддержки и сопротивления. Преимущества индикатора: подходит как для опытных трейдеров, так и для новичков; простота в использовании; уровни не перерисовываются; вероятность реакции цены при касании уровня более 80%; бесплатный. Индикатор Free Pro Level имеет всего 5 пунктов входных параметров: Минимальная длина свечи в пунктах по 5 знаку - основной параметр, на основании которого происходит анализ и поиск уровней по
FREE

updated hidden market support and resistance. this indicator is made for new current market that has new support and resistance that some traders struggle to see. The indicator works on all timeframes from the 1-minute timeframe to the monthly One Trading tip to use When price is at resistance and the indicator appears wait for a bearish candle to close then enter a sell trade. Same applies for a buy trade when price reaches support level, and the indicator appears wait for the bullish candle
FREE
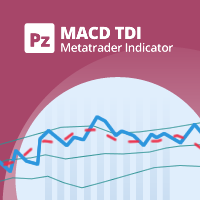
This indicator implements the logic behind Traders Dynamic Index to the classic MACD Indicator. It helps to find powerful trende changes and ignore meaningless ones. It is simply the classic MACD indicator plotted with volatility bands on top designed with the sole purpose of being able to ignore trend changes that do not follow an over-extension or over-contraction of the market. The indicator alerts on trend changes after the volatility bands have been breached and implements alerts of all ki
FREE

This is a multi timeframe version of the Supply and Demand indicator . It allows you to analyze a chart using the law of supply and demand on three different timeframes at a time. You will see zones of sales and purchases and determine the most profitable points to open positions. The indicator is based on the principle of market fractality. Supply and demand zones show places where a strong buyer or seller has made the price reverse and change its direction. The indicator has several types of
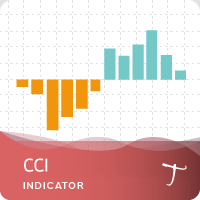
28 symbols, multi-time frame powerful Dashboard for the full market view Customizable Buy/Sell alerts, push alerts, email alerts, and visual on-screen alerts. Marked buy/sell signals Two color trend histogram. The commodity channel index (CCI) is an oscillator originally introduced by Donald Lambert in 1980. CCI measures current price level relative to an average price level over a given period of time. CCI is high when prices are above the average price, and low when the prices are below the a
FREE

Divergenzen sind schwierig zu finden und seltener anzutreffen. Sie sind eines der zuverlässigsten Handelsszenarien. Dieser Indikator sucht automatisch mit Ihrem bevorzugten Oszillator nach regelmäßigen und versteckten Abweichungen. [ Installationsanleitung | Update-Anleitung | Fehlerbehebung | FAQ | Alle Produkte ]
Einfach zu handeln
Findet regelmäßige und versteckte Abweichungen Unterstützt viele bekannte Oszillatoren Implementiert Handelssignale basierend auf Ausbrüchen Zeigt geeignete

[Abweichung jedes Indikators MT4] ist eine Sammlung von 18 Indikatoren, von denen einer beliebig ausgewählt werden kann, um an der Berechnung teilzunehmen. Es kann die Abweichungsform jedes Indikators berechnen und einen Alarm auslösen.
Parametereinstellungsbeschreibung:
Bei [Indikatoren] wird einer der 18 Indikatoren ausgewählt, um an der Berechnung teilzunehmen (dieser Parameter ist sehr wichtig) .
[period] ist ein gemeinsamer Zyklus für jeden Indikator.
[Method] ist der MA-Modus ein
FREE

This indicator evaluates the market sentiment using raw price action measurements, and it is an amazing trading confirmation. It can be used to take a trend-trade approach or a contrarian approach using reversal patterns. [ Installation Guide | Update Guide | Troubleshooting | FAQ | All Products ] Find early reversals Confirm short-term trades Detect indecision on the market Take contrarian trades near support and resistance levels Trade inside bars confirmed by overall direction of the market T
FREE

A classical MACD indicator where both the MACD line and the Signal line are displayed as lines. The difference between MACD and Signal line is displayed as a histogram. A user can change the color and thickness of histogram lines. So, histogram lines can be grouped into four different groups: positive ascending, positive descending, negative descending and negative ascending. Multi-currency Dashboard for the indicator is available https://www.mql5.com/en/market/product/72354
FREE

I recommend you to read the product's blog (manual) from start to end so that it is clear from the beginning what the indicactor offers. This multi time frame and multi symbol supply and demand zone dashboard indicator sends alerts when the price has reached a supply/demand zone. It is also possible to use it to be alerted about regular double tops/bottoms instead of zones. It can be used with all time frames from M1 to MN. It is possible to use RSI, divergence (MACD, OsMA, RSI or Awesome) a

A simple and effective trend indicator. It will be a good assistant when trading. A minimum of understandable settings. Put it on a chart and set it up Good to combine with other indicators. I will post another trend indicator soon. The combination of these two indicators gives good results. Works on all timeframes. Suitable for any couple. Experiment, adjust, observe. Filter by higher timeframes.
FREE

This is a unique Gold Indicator On channel trading pullbacks and gives accurate entries on gold and major Fx Pairs on M15tf. It has the ability to pass any prop firm Challenge and get accurate entries on gold and major fx pairs.
EA FOR PROP FIRM AND CHANNEL INDICATOR IS FREE ALONG WITH THIS POWERFUL INDICATOR ALONG WITH THE BEST SET FILE FOR FIRST 25 USERS. Strategy tester report is in comment section. INDICATOR FEATURES: INDICATOR IS BEST ON M15 GIVES ACCURATE ENTRIES EA AND CHANNEL INDICAT

3 Level ZZ Semafor Scanner:
This is a Dashboard indicator which uses 3LZZ Indicator in the background to find semafors. It will give priority to the semafors3 because they specify a strong signal. So, even if there is a sem1 or 2 on current bar, and if Sem3 was within "Check Previous Bars for Sem 3". Then it will show Sem3 instead. Read about this in detailed post: https://www.mql5.com/en/blogs/post/758250
And get all extra Indicators/Template from above link.
Please note: Number of setti

This indicator is the translated version of Kıvanç ÖZBİLGİÇ's PMAX Indicator, developed on the Matriks Data Terminal, into the MQL4 language. It is a trend-following indicator and quite successful. Its usage will be free and unlimited for a lifetime. You can click on my profile to access the MQL5 version of this indicator. You can also get your programming requests for MQL4 and MQL5 languages done at İpek Bilgisayar with an invoiced service. You can reach İpek Bilgisayar at www.ipekbilgisayar.or
FREE
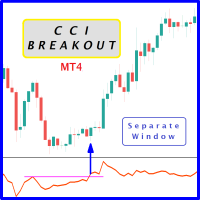
Probability emerges to record higher prices when Commodity Channel Index breaks out oscillator historical resistance level when exhibit overbought values. Since, oscillator breakout of support and resistance have similar effect as price breaks support and resistance levels, therefore, its highly advised to confirm price breakout with oscillator breakout; certainly, will have the same output in short trades. Concept is based on find swing levels which based on number of bars by each side of peak
FREE
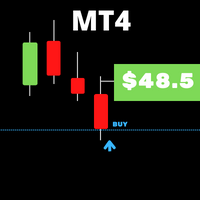
When you work with several assets and have several open positions in assets, it is a little complicated to visualize when profit or profit each active problem is giving, so with this in mind, we develop this indicator where it facilitates the visualization of operations in assets, where you you will be able to open several different resources and you will be able to visualize the individual result of each asset and speed up your decision making in your business.
FREE

This indicator shows the direction of the trend and trend change. Ganesha Trend Viewer is a trend indicator designed specifically for gold and can also be used on any financial instrument. The indicator does not redraw. Recommended time frame H1. Ganesha Trend Viewer is perfect for all Meta Trader symbols. (currencies, metals, cryptocurrencies, stocks and indices..) MT5 Version here!
Parameter setting
MA Short Period ----- Moving Average short period MA Long Period ----- Moving Average l
FREE

A simple but effective helper that will allow you to track both global and local market trends. The indicator combines the work of two oscillators: Stochastic and RSI. Both indicators can be set to any timeframe.
Advantages of Use Multitimeframe - you can adjust both indicators to the desired timeframes. To obtain the entry points, you can use the Elder's triple screen system. Highly customizable - you can configure not only the parameters of the indicators, but also their appearance (color an
FREE

Apollo Striker ist ein effektiver BUY/SELL-Pfeilindikator, der die Richtung der Preisbewegung vorhersagt. Dieser Indikator ist für absolut alle Händler geeignet, unabhängig von der bevorzugten Strategie oder dem bevorzugten Währungspaar, Zeitrahmen. Dieser Pfeilindikator kann mit absolut jedem Handelsinstrument verwendet werden, seien es Währungen, Metalle, Indizes, Aktien oder sogar Kryptowährungen. Darüber hinaus kann ein Händler die Indikatorsignale für jedes Handelspaar und jeden Zeitrahmen

Fibonacci Retracement object is an object that has been provided by metatrader 4 platform. But Fibonacci Retracement object doesn't automated adjust the chart. You have to put and manage it manually to the chart. Because of that, this indicator was created. If you like using filbonacci retracement indicator, highly recommended to use Automated Fibonacci Retracement Indicator if you want to get better result in here:
https://www.mql5.com/en/market/product/95515
LT Automated Fibonacci Retrace
FREE

The BinaryFortune indicator has been developed and adapted specifically for trading short-term binary options. The algorithm of the indicator analyzes numerous factors before generating a signal. The indicator is installed in the conventional way. The indicator consists of an information window, which displays the name of the trading instrument, support and resistance levels, and the signal itself ( BUY , SELL or WAIT ). A signal is accompanied by a sound and a pop-up Alert. Advantages of the in
FREE

This indicator is stand alone version from MP Pivot Levels (All in one) containing Demark's Pivots.
Calculations: PP = X / 4 R1 = X / 2 - LOWprev S1 = X / 2 - HIGHprev Uses: When the pair currency price may change the direction of movement. Possible constraints of support and resistance that creates plateaus for the currency pair prices. Tendency identification by comparing the present prices according to current day's pivot point and also the prior day's pivot points. ___________
FREE

This indicator applies the biquad high pass filter to the price-chart data, and displays the filter output for the OHLC as candlesticks. The candlesticks corresponds to the actual calculations of the filter value during the formation of each price bar (not from all historical highs lows or closes). The shape of the bars therefore corresponds directly to the shape of each price bar. High pass filters are an underappreciated type of oscillator that are seldom used in technical analysis in the st
FREE

This indicator uses digital filters to analyze data. The indicator colors the chart candles in accordance with the current trend.
Digital filters are (simplistically) a way of smoothing data. Unlike traditional moving averages, a digital filter will be more effective in most cases. This indicator allows you to identify the difference between the current price and its expected value calculated by an adaptive digital filter. Moments of divergence are moments of price movement that can be used to
FREE

Market Insider is an excellent indicator for scalping the trend and also trading market breakouts and reversals. It is based on a ATR measured volatility channel and the CCI indicator. The green trend line and green bars indicates an uptrend and the red trend line and red bars indicates a downtrend. An intensive price breakout of some of the trend lines indicates a market breakout and a potential new opposite trend. In choppy-range behaving market and in low liquidity conditions the breakout sig
FREE

With this system you can spot high-probability trades in direction of strong trends. You can profit from stop hunt moves initiated by the smart money!
Important Information How you can maximize the potential of the scanner, please read here: www.mql5.com/en/blogs/post/718109 Please read also the blog about the usage of the indicator: Professional Trading With Strong Momentum This FREE Version of the indicator works only on EURUSD and GBPUSD. The full version of the indicator can be found here:
FREE
This indicator detects Sandwich Bars of several ranges, an extremely reliable breakout pattern. A sandwich setup consists on a single bar that engulfs several past bars, breaking and rejecting the complete price range. [ Installation Guide | Update Guide | Troubleshooting | FAQ | All Products ] Easy and effective usage Customizable bar ranges Customizable color selections The indicator implements visual/mail/push/sound alerts The indicator does not repaint or backpaint The indicator could not b
FREE

A unique author's strategy that simultaneously determines the trend reversal, entry points and estimated profit levels for each transaction. The indicator can determine entry points on any trading period, starting with the M5 chart to W1. At the same time, for the convenience of the user, an arrow is always drawn at a certain point and the recommended profit levels (Take Profit1, Take Profit2, Manual Take Profit) the Stop Loss level is also displayed.
A great advantage of the indicator Trend S

Wir stellen Ihnen Ms. Fibonacci vor, einen leistungsstarken und kostenlosen Indikator, der das Zeichnen und Anpassen von Fibonacci-Levels in Ihrem Diagramm vereinfacht. Dieser Indikator identifiziert und markiert automatisch die neuen höchsten und niedrigsten Fibonacci-Werte und gewährleistet so eine genaue und präzise Platzierung. Eines der Hauptmerkmale von Ms. Fibonacci ist seine Fähigkeit, Fibonacci-Ebenen Punkt für Punkt korrekt zu zeichnen und die entsprechenden Preisniveaus zu markier
FREE

Investment Castle Support and Resistance Indicator has the following features: 1. Dictates the direction of Buy or Sell trades based on Support and Resistance Levels automatically . 2. Candles stick colors will change to Red for Sell and Blue for Buy (Default settings, user can change from the inputs). 3. This indicator is built-in the Support & Resistance based Investment Castle EA which works with Psychological Key Levels "Support & Resistance".
FREE
The presented indicator is a development of the ideas contained in the Bulls or Bears AM indicator. This indicator displays the difference between the maximum and minimum prices for the current period of time and the values of the channel built using the maximum and minimum prices for a longer period. An increase in indicator values above zero indicates that the maximum price for the current period is greater than the average value of the maximum prices for the period selected as an indicato
FREE
TMA Stochastic is an indicator based on stochastic oscillator and tma bands indicator , this indicator is based on a reversal strategy . Recommended time frame : 15 and above Recommended settings : lower values for scalping , higher values for swing trading WORKS ONLY ON EURUSD , GET THE FULL VERSION : https://www.mql5.com/en/market/product/108378 ======================================================================= Parameters : tma history : how many bars back to show tma bands on stochas
FREE

Der Chart-Overlay- Indikator zeigt die Kursbewegungen mehrerer Instrumente auf demselben Chart an, sodass Sie auswerten können, wie unterschiedlich die Währungspaare im Verhältnis zueinander schwanken. [ Installationsanleitung | Update-Anleitung | Fehlerbehebung | FAQ | Alle Produkte ]
Finden Sie leicht überkaufte oder überverkaufte Währungspaare Zeichnen Sie bis zu sechs Währungspaare auf ein und demselben Diagramm Zeigen Sie bei Bedarf invertierte Symbole an An Diagrammgröße, Zoom und Zei
FREE

Renko Charts with Heiken Ashi Filter now have the alerts and the Win-rate . Now you can know which signal will give you that edge your trading needs. Risk to Reward Settings Wins versus Losses Count There are four alert types to choose from for notification on screen, email or phone notification. The alert types also have buffers for use with automation. This indicator can be incorporated with any system that requires renko charts. The four (4) alert types are: Three-bar Formation ; Pinbar

Download the free version here.
A Full Concept of BUY/SELL Scalping Strategy Trend detection is one of the basic challenges of every trader. Finding a way to tell when to enter a trade is very important, timing is a game changer, not too early and not too late. Sometimes, due to not knowing the market conditions, the trader closes his positions with a small profit or allows the losses to grow, these are the mistakes that novice traders make. Indicator Trend Whipper is a complete trading st
Highly configurable Trader Dynamic Index (TDI) indicator.
Features: Highly customizable alert functions (at levels, crosses, direction changes via email, push, sound, popup) Multi timeframe ability (higher and lower timeframes also) Color customization (at levels, crosses, direction changes) Linear interpolation and histogram mode options Works on strategy tester in multi timeframe mode (at weekend without ticks also) Adjustable Levels Parameters:
TDI Timeframe: You can set the lower/higher
FREE
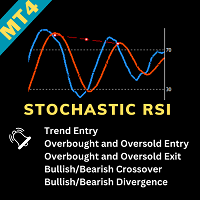
Stochastic RSI Indicator - Master the Art of Timing Elevate your trading game with the "Stochastic RSI Indicator." This powerful tool marries the Stochastic oscillator with the Relative Strength Index (RSI), offering precise insights into market dynamics. It's your key to mastering the art of timing in trading. About the Indicator : The Stochastic RSI Indicator combines two robust indicators - Stochastic and RSI - to provide traders with an exceptional tool for identifying entry and exit points
FREE

CPR Pivot Lines It Will Draw Pivot Point R1,R2,R3 S1,S2,S3 Tc Bc Best Part Is That You Can Even Add Values Of High,Low,Close Manually Also To Get Your All Levels On Chart. So If Your Broker Data Of High ,Low ,Close Is Incorrect Then You Don’t Have To Depend On Them Anymore. You Can Even Modify All Lines Style. It Will Show Line In Floating Style And Not Continues Mess.
FREE

This indicator is the basis for an Expert Advisor that can be categorized as "almost Grail". See details below. This indicator displays the projection of the Renko chart on the price chart. This projection is displayed as a stepped line, not as "bricks" (rectangles). See slides 1 and 2. Abbreviated name of the indicator: LRC – L ine of R enko on the price C hart. The principle of its construction is very simple. First, a grid of horizontal lines (levels) is bu
FREE

This is a smooth and responsive accelerometer which reveals the market trend and strength. [ Installation Guide | Update Guide | Troubleshooting | FAQ | All Products ]
Two moving averages indicate trend direction The histogram represents strength of the price movement It draws buy and sell zones as colored vertical lines Should be used as a confirmation indicator Customizable line widths and colors It implements alerts of all kinds This indicator is similar to MACD but aims to react faster t
FREE
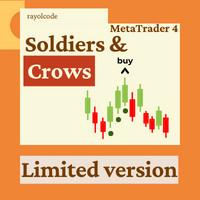
This indicator accurately identifies and informs market reversals and continuation patterns by analyzing and signaling the Three White Soldiers / Three Black Crows pattern. User-friendly interface and multi-asset compatibility Fully customizable parameters and colors Does not repaint Can be easily convert its signals into an Expert Advisor. Full support granted.
FOR MT4 FULL VERSION: CLICK HERE
What is the Three White Soldiers / Three Black Crows price action pattern The Three White Soldi
FREE

The Trend Finding Channels indicator was developed to help you determine the trend direction by drawing channels on the graphical screen. It draws all channels that can be trending autonomously. It helps you determine the direction of your trend. This indicator makes it easy for you to implement your strategies. The indicator has Down trend lines and Up trend lines. You can determine the price direction according to the multiplicity of the trend lines. For example , if the Down trend lines s
FREE
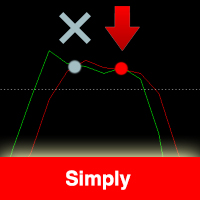
The indicator is based on the Stochastic indicator. I also recommend to see my EA Night Zen Strategy: It contains a strategy for crossing the K and D lines in the overbought (for sales) and oversold (for purchases) zones. The indicator gives a signal at the second intersection.
The signals are not rewritten, they appear after confirming the intersection of the K and D lines.
Settings: Stochastic Indicator Settings Indicator period Notification and Alert Settings
FREE

This is one of my first indicators. Slightly improved. The indicator is based on point and figure chart, but their period is equal to ATR indicator values. Parameters: ATRPeriod - ATR period for calculation of steps. XOPips - manual pararmetr, ATR ignoring. Note: The indicator uses closes price, thus it is recommended to consider completed bars. There is a more visual, with the display of lines on the chart and alerts, paid version of XOatrline
FREE

Was: $49 Now: $34 Blahtech Better Volume provides an enhanced version of the vertical volume bars. Each bar is compared to the previous 20 bars. Depending on its volume, range and volume density it will be assigned a state and colour. Low Volume – Minimum volume High Churn – Significant volume with limited movement Climax Neutral – High volume with unclear direction
Climax Up – High volume with bullish direction Climax Dn – High volume with bearish direction Climax Churn – High vol

Set TP and SL like Financial Institutions
Traders' TP expectations do not often occur and their SL often hits when they only rely on primitive indicators like pivot-points and Fibonacci or classic support or resistance areas. There are a variety of indicators for support/resistance levels, whereas they are seldom accurate enough. Classical support/resistance indicators, often present miss levels and are not noteworthy based on current market volatility dynamic. Fibonacci is good but not enou
Drawdown Alerts Free ! Meta Trader 4 Indicator. Please leave a review about this product to help other users benefit from it. This Drawdown Alerts indicator shows the drawdown percentage in real time and alerts you when the limit you specify is reached. Calculation of drawdown depends on the amount of the trade balance. You can customize Drawdown Alerts for Corner - Left , Right , Up , Down X Y Color Number of decimal digits Popup messages and sound - Turn on / off notifications Notification
FREE

The Spots Indicator can be used for Entering and Exiting your trades based on the common candlestick patterns such as: engulfing, hanging man, doji etc. It is designed to publish desktop and mobile notification every time a signal is triggered. However, it is worth noting that this indicator is recommended to be used with other indicator for confirming the entries. It is best to use it with the Investment Castle Trend Lines indicator and the Supply and Demand indicator
FREE

The VWAP indicator is our version of the popular Volume-Weighted Average Price indicator. The VWAP is the ratio between the value traded (price multiplied by the number of volume traded) and the total volume traded over a specific time period. As a result, it measures the average price of the instrument much better than the simple moving average. Although there are many ways to use the VWAP, most investors use it to calculate the daily average.
The indicator works in five modes: Moving

The indicator displays two Moving Average lines on the chart with parameters specified in the settings. It issues a signal in the form of arrows and a sound at the intersection of these Moving Average. In the indicator settings, you can set the period of fast Moving Average ( Fast MA Period ) and slow Moving Average ( Slow MA Period ). And also Shift, Applied Price, Method and Timeframe for two Moving Averages separately. Important:
The main difference from oth
FREE
The Currency Strength Lines (CSL) indicator is a very useful tool for both beginners and experienced traders. It is able to calculate the strength of single currencies and show them on a chart, so that you can see the trend and spot trading opportunities.
How does it work? The CSL Indicator will run calculations on all the 28 pairs, resulting in the overall strength across the market of individual currencies at any given moment. You can use this data to spot currencies that are strong, getting
FREE

Donchian channels are a tool in technical analysis used to determine the relative volatility of a market and the potential for price breakouts.
Can help identify potential breakouts and reversals in price, which are the moments when traders are called on to make strategic decisions. These strategies can help you capitalize on price trends while having pre-defined entry and exit points to secure gains or limit losses. Using the Donchian channel can thus be part of a disciplined approach to manag
FREE

The indicator is a T3 and Rsi based oscillator with color change.
The indicator repaints.
Check out my indicators and Expert Advisors - https://www.mql5.com/en/users/ptr777/seller
The values and colors can be changed as preferred.
Please play around with the settings to get better signals.
The fast line gives earlier signals but if you want confirmation wait for the cross or slow line to change color also.
Buy when lines is closer to the 20 line and sell closer to the 80 line.
Sy
FREE

ChannelRSI4 Der Relative Strength Index (RSI) Indikator mit dynamischen Niveaus von überkauften und überverkauften Zonen.
Dynamische Niveaus ändern sich und passen sich den aktuellen Veränderungen des Indikators und der Preise an und stellen eine Art Kanal dar.
Anzeigeeinstellungen period_RSI - Mittelungsperiode für die Berechnung des RSI-Index. angewandt_RSI - Der angewendete Preis. Es kann eine der Preiskonstanten sein: PRICE_CLOSE - Schlusskurs, PRICE_OPEN - Eröffnungspreis, PRICE_HIGH -
FREE

A trend indicator is a hybrid of several well-known indicators that process data sequentially with signaling a trend change. Final processing of the AMka indicator data. The indicator is conventionally not drawing - upon restarting, it can change some of the chart data, but if you do not touch it, it will not redraw. It is possible to issue an alert, sound, send an e-mail or a message to another terminal when the trend changes.
FREE

MACD Display is a MACD disaplay and cross monitoring indicator,which can works on 6 timeframe at same time. Indicator advantage: 1. Deviation from the point can be drawn on the main picture and indicator drawing. It is convenient to observe and can be hidden or displayed by parameter setting. 2. Deviation from the entry point is clearly indicated by the arrow in the drawing. 3. Cross-cycle monitoring can simultaneously monitor the MACD deviation and the golden dead fork of the six-cycle framewor

Dieser Indikator scannt mehrere Paare in mehreren Zeitrahmen nach RSI-Werten und zeichnet in Echtzeit grüne Aufwärtspfeile für überkaufte RSI-Werte und rote Abwärtspfeile für überverkaufte RSI-Werte.
Merkmale •Animiertes Zeilenplotten •Der Größe veränderbar •Repositionierbar •Minimierbar •Mehrere Dashboard-Designs •Mehrere Zeitrahmen •Sie können ein Paar öffnen, indem Sie darauf klicken •Aktuelles Diagrammpaar durch eine andere Farbe gekennzeichnet •Verwenden Sie Marktbeobachtungspaare oder I
FREE

FZR indicator determines fractal zigzag reversal pattern of all the time frames of the chosen symbol and shows the information in the Info label. Indicator draws the detected pattern in the chosen time frame and also you can select in the menu to draw the trend line according to FZR peaks. What it is FZR? See the first picture in the screenshots. As you can see for every peak of FZR the AO indicator must cross zero line. FZR indicator determines the trend direction.
How to use FZR for trading?
FREE
This is a custom indicator based on the Exponential Moving Average (EMA) angle, typically used to measure the trend angle of EMA lines. Here are the main parameters and functions of this indicator: Main Parameters: md1: Fast period for EMA, default value is 12. md2: Slow period for EMA, default value is 26. md3: Period for the MACD signal line, default value is 9. Functions: The indicator calculates the MACD indicator and categorizes data into different buffers based on the direction and angle o
FREE

BB & RSI Candle Color: Technical Analysis Indicator on MetaTrader 4 The "BB & RSI Candle Color" indicator is a powerful technical analysis tool designed for MetaTrader 4 traders looking for an effective visual representation of market conditions. Created by 13 Crow Trading Club, this indicator combines the popular Bollinger Bands and the Relative Strength Indicator (RSI) to provide clear and accurate visual signals. This indicator offers three key aspects: Candle Color: Normal candles are displa
FREE

Important!! ZO Trend can't work on MN timeframe. /*--------------------------------------------------------------------------------------------------------------------------------------------------------------------------------------------- ZO Trend an indicator used to search for entry point. With the session candle algorithm on many timeframe, ZO Trend creates an area for traders find good Entry Point. ZO SYSTEM BASIC SETUP : https://www.youtube.com/watch?v=qdNOXHWozNw ZO TREND User guide :
Ist Ihnen bekannt, warum der MetaTrader Market die beste Plattform für den Verkauf von Handelsstrategien und technischer Indikatoren ist? Der Entwickler braucht sich nicht mit Werbung, Programmschutz und Abrechnung mit Kunden zu beschäftigen. Alles ist bereits erledigt.
Sie verpassen Handelsmöglichkeiten:
- Freie Handelsapplikationen
- Über 8.000 Signale zum Kopieren
- Wirtschaftsnachrichten für die Lage an den Finanzmärkte
Registrierung
Einloggen
Wenn Sie kein Benutzerkonto haben, registrieren Sie sich
Erlauben Sie die Verwendung von Cookies, um sich auf der Website MQL5.com anzumelden.
Bitte aktivieren Sie die notwendige Einstellung in Ihrem Browser, da Sie sich sonst nicht einloggen können.