Technische Indikatoren für den MetaTrader 4 - 7

Индикатор строит блоки заказов (БЗ) по торговой системе (ТС) Романа. Поиск блоков осуществляется одновременно на двух таймфремах: текущем и старшем (определяемым в настройках). Для оптимизации и игнорирования устаревших блоков в настройках задается ограничение количества дней в пределах которых осуществляется поиск блоков. Блоки строятся по правилам ТС состоящем из трех шагов: какую свечу вынесли (что?); какой свечой вынесли (чем?); правило отрисовки (как?).
FREE

** All Symbols x All Timeframes scan just by pressing scanner button ** *** Contact me after the purchase to send you instructions and add you in "ABCD scanner group" for sharing or seeing experiences with other users. Introduction This indicator scans AB=CD retracement patterns in all charts. The ABCD is the basic foundation for all harmonic patterns and highly repetitive with a high success rate . The ABCD Scanner indicator is a scanner reversal ABCD pattern that helps you identify when the p

Contact me after payment to send you the User-Manual PDF File. How To Test
You can test the indicator by free version, to get the free version please contact me ( the free version scans charts in W1 and MN1 time-frames ) it's free.
123 Pattern Breakout
Trend is your friend, trade along the trend, but how do we identify trends? Sometimes the simplest methods have the best results. Pattern 123 is based on the breakout important price levels, when the price is trying to break the previou
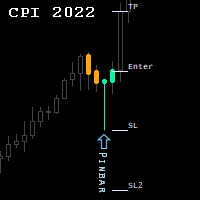
Candlestick Patterns Indicator.
NEW! FREE Candlestick Patterns Expert Advisor > https://www.mql5.com/en/market/product/105634?source=Site +Profile
The Indicator draws colored candlestick patterns, their description and future levels of Stop Loss / Take Profit. Combined with other market analysis, can greatly improve trading results. Indicator can be highly customized by the user including change of colors, fonts, levels, candle sizes etc...
developed, tested and optimized on " VantageM
FREE

FREE Heiken Ashi Smoothed indicator is fully adjustable, easy to use and comes with possibility to access the indicator via iCustom function so you can use it in your own trading software. Indicator can also pop up alerts when signal changes or send push notifications. For Metatrader 5 version click here: https://www.mql5.com/en/market/product/70825 For detailed information click: >>HERE<< Features
Easy to use Accessible via iCustom Fully adjustable Alerts and Push notifications Possi
FREE
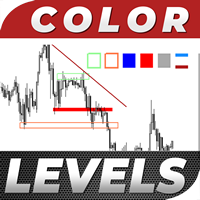
Color Levels is a convenient tool for traders using a Trendline and a Rectangle in their technical analysis. It allows setting two empty rectangles, three filled ones, and two tredlines. The indicator parameters are very simple and divided into numbered blocks: The ones beginning with 1 and 2 - empty rectangle (frame) parameters; 3, 4, and 5 - filled rectangle parameters; 6 and 7 - trendline parameters. Simply click a desired object and it will appear in the upper left corner. Main Adjustable Pa
FREE

The Breaker Blocks with Signals indicator aims to highlight a complete methodology based on breaker blocks. Breakout signals between the price and breaker blocks are highlighted and premium/discount swing levels are included to provide potential take profit/stop loss levels.
This script also includes alerts for each signal highlighted.
SETTINGS
Breaker Blocks
Length: Sensitivity of the detected swings used to construct breaker blocks. Higher values will return longer te

uGenesys AI - 90% Accurate Daytrading Indicator
Introducing the ultimate forex trading indicator system, uGenesys AI, powered by cutting-edge AI technology and advanced analytical techniques, including Time-Series Analysis and Genetic Algorithms. Our AI-powered trading system leverages the power of time-series analysis to identify trends and patterns in historical price data, allowing traders to make informed predictions about future market movements. By analyzing vast amounts of data, our sys
Super Trend Pro Its simple. as you see in product picture you can find out how it work. We Use Several MA and use Statistics and Probability inside the code to draw nice, great and pure Trend Detection. Do you like it? Yes me too Here, Super trend pro with 100% non-repainting indicator
Input Parameter is clear and simple.
Inputs Period 1 --------------------------->>>> Use for mathematical calculating
Period 2 --------------------------->>>> MA Period
Indicator Type ------------------->>>>
FREE
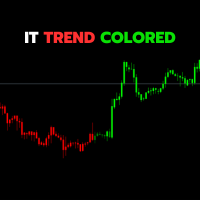
The IT Trend Colored indicator is a powerful tool designed by IT Trading (InfiniteTrades Software Corp) to assist traders in visually and effectively identifying market trends. This version is a custom indicator for the MetaTrader 4 trading platform.
Key Features:
• Trend Identification: The indicator uses a combination of simple moving averages (SMA) to determine the direction of the market trend.
• Intuitive Coloring: Upward trends are represented by bold green histograms, downward tren
FREE

"The VIX Fix is a powerful indicator that detects market bottoms for any asset " The VIX (volatility index) is a ticker symbol of implied volatility of the S&P 500, calculated by the Chicago Board Options Exchange. VIX is a popular measure of market risk, and is one of the best measures of market bottoms that currently exists. Unfortunately, it only exists for the S&P 500... The VIX Fix was published by Larry Williams in 2007, and it synthesizes a VIX volatility index for any asset (not just the
A Powerful Solution That Analyze The Renko And The Standard Charts And Filters Out The Noise Or The Narrow Range Moves And Gives Entry And Exit Signals. A statistics window is included to show the net points gained from these signals taking into considerations the spread of the pair and to evaluate accurately the overall performance.
Advantages It Provides A Clear Buy and Sell signals with take profit and stoploss levels. A Statistical analysis that offers an accurate image of net gained point

Ultimate Renko is a full implementation of a robust Renko style charting solution for MT4. It enables creating custom live charts resembling Median Renko , Mean Renko , Turbo Renko , and Better Renko candles as well as Vanilla Renko and Renko with wicks , PointO charts, and many more. This all-in-one package provides all of the signals needed by day traders, scalpers, and even long-term traders. You can apply all of the standard and custom indicators and technical studies as well as templates to
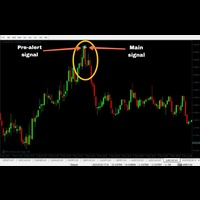
100% non-repaint MT4 indicator with advance pre alert
Recommended candle timeframe M15
Trade expiry 15 minutes
Call buffer 0
Put buffer 1
Intrabar
Pros Neural Network based Advance price action algorithms Advance trend filtering algorithms Advance consolidation filtering algo
Pre-alert (get ready) signals
Non-delay indications
Auto-trading supported
100% Non repaint
100% No lag
No recalculating
Lifetime license
Cons Very few signals
Instructions to use
1 Do not ente
FREE

great tool for any trader for both Forex and binary options suitable for any trader no need to configure anything, everything has been perfected by time and experience The tool combines 5 indicators and 3 proprietary strategies works great during flats and trends It indicates a trend reversal at its very beginning, it works well with the trend Trading Recommendations The signal is formulated on the current candle You should enter the trade at the next Possible recount (rare)

缠中说禅在MT4的应用,该指标自动识别分型,划笔,划线段,显示笔中枢,线段中枢,也可以根据需求在参数中设置显示自己所需要的。 1.笔采用条件较为宽松的新笔。 2.当前分型与前面分型不能构成笔时,若与前面笔同向且创新高或新底时会延伸笔,若与前面笔异向且符合替换条件则去除倒数第一笔,直接倒数第二笔。 3.线段的终结第一类情况:缺口封闭,再次创新高或新底新低,则判为终结,同时破坏那一笔的右侧考虑特征序列包含。 4.线段终结的第二类情况,缺口未封闭,考虑后一段特征序列分型出现新的顶底分型,同时做了包含处理。 5.中枢必须有退出段才进行显示,中枢的进入段和退出段必须同向。 中枢的进入段起始点 ( 上下上结构的) 必须高于GG,或( 下上下结构的)必须 低于DD; 中枢的退出段结束点 (下上下结构的) 必须高于GG,或 (上下上结构的) 必须低于DD。

The Swing Hit Perfect Master Indicator for MT4 displays accurate buy and sell signals on the chart and is no repaint and can be used on any pair, gold and indices. It's all in one the best indicator Swing and trend detection and is able to make precise entries. The indicator for MT4 points dots on the chart arrow after the swing high and low is maintained and takes perfect entries with the trend. The template shows the lows and highs of the market. They mark good entry and exit points. The blue

ATR Scanner Pro is a multi symbol multi timeframe volatility scanner that monitors and analyzes Average True Range indicator value in up to 28 symbols and 9 timeframes in 3 modes : ATR value: As a volatility dashboard it shows the ATR indicator value in all pairs and timeframes and signals when the ATR value reaches a maximum or minimum in a given duration. Short term ATR/Long term ATR ratio: It shows ratio of 2 ATRs with different periods. It's useful in detecting short term volatility and e

Features Supports the creation of Monthly, Weekly, Daily, 4 Hours, 1 Hours and 30 Minutes Market Profile. Daily Profile can have custom start time. Merge and Split of Market Profile Market Profile References Point can be exported to CSV format for any further analysis.
Indicator Parameters Indicator Update Interval - Choose indicator calculation period from 250 milliseconds to 2.5 seconds Indicator Setting ID - An ID for this particular indicator setting. Profile Number - The Number of Market

SMARTMASS INDICATOR This indicator is different from all known volume indicators. It has a significant distinction; it is an algorithm that relates price movement to volume, attempting to find proportionality and efficient movement while filtering out noise and other movements that are more random and do not follow a trend or reversal. Ultimately, it reveals the true strength of the movement, indicating whether it has genuine support from bulls or bears or if it's merely a high-volume movement

This information indicator will be useful for those who always want to be aware of the current situation on the account. The indicator displays data such as profit in points, percentage and currency, as well as the spread for the current pair and the time until the bar closes on the current timeframe.
VERSION MT5 - More useful indicators
There are several options for placing the information line on the chart:
1. To the right of the price (runs behind the price);
2. As a comment (in the up
FREE

RSI divergence indicator is a multi-timeframe and multi-symbol indicator that help us find divergences between price chart and RSI indicator. Always use the divergence indicators with other technical assets like support resistance zones, candlestick patterns and price action to have a higher possibility to find trend reversals. This indicator will identify the peaks and troughs of both price and the RSI indicator. You can adjust the parameters to adjust the strength and weakness of these peaks a
FREE

"It's not about how much you do, but how much love you put into what you do that counts." - Mother Teresa Today you have the ability to unlock the most powerful trading Indicator.In my trading Carrier,I have been using this indicator to take a perfect entry and exit with nice safe profit.And with full trust,Today I'm sharing this secret strategy with you.Great fund manager never risk their trade on one single order,instead they take more trade orders at different instrument to build an effec
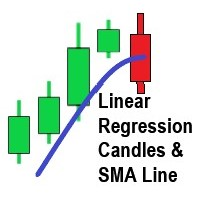
Dieser Indikator für MT4 basiert auf dem derzeit beliebten Indikator auf Trading View mit ähnlichem Namen.
4 (OHLC) Arrays werden mit linearen Regression-Werten für jeden Preis gefüllt. Die Periode der linearen Regression ist eine Eingabe, die größer als 2 sein muss (sie wird standardmäßig auf 2 gesetzt, wenn Sie versuchen, eine 1 einzugeben).
Die Periode der linearen Regression ist abhängig von den Marktbedingungen einstellbar. Der SMA hat auch eine Periodenanpassung.
Kerzen werden mit G

This indicator identifies and displays zones, as it were areas of strength, where the price will unfold. The indicator can work on any chart, any instrument, at any timeframe. The indicator has two modes. The indicator is equipped with a control panel with buttons for convenience and split into two modes. Manual mode: To work with manual mode, you need to press the NEW button, a segment will appear. This segment is stretched over the movement and the LVL button is pressed. The level is displayed
The brand new trading indicator using TRIX strategy is exclusive presented by KING.Ai. Exclusive Functions including Mobile Push Notification . This indicator with Three-mode alerts is developed by KING.Ai ONLY. It is probably impossible that you could find a TRIX indicator like this one. It is very difficult for you to trade with the Trix strategy as there is limited time for traders to monitor every currency. However, the Trix strategy is very profitable especially using in DAY CHAT. It

MT4-Erkennungsanzeige für Auftragsblöcke mit mehreren Zeitrahmen.
Eigenschaften
- Vollständig anpassbar auf dem Diagrammbedienfeld, bietet vollständige Interaktion.
- Verstecken und zeigen Sie das Bedienfeld, wo immer Sie möchten.
- Erkennen Sie OBs in mehreren Zeiträumen.
- Wählen Sie die anzuzeigende OB-Menge aus.
- Verschiedene OBs Benutzeroberfläche.
- Verschiedene Filter an OBs.
- OB-Näherungsalarm.
- ADR High- und Low-Leitungen.
- Benachrichtigungsdienst (Bildschirmwar

The Market Structures MT4 indicator finds and shows the Break Of Structures (BoS) pattern on the chart. The pattern is an important part of the Smart Money Concepts (SMC) system.
The appearance of a pattern means that the price breaks the last peak of an uptrend, or the last bottom of a downtrend. This indicates a change in the existing trend structure and the beginning of a new movement.
BOS is a technical analysis tool used to identify trend reversals.
The set of input parameters is simple
FREE
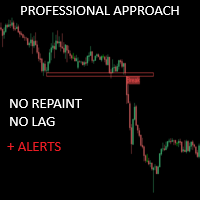
Critical Zones wurde speziell für manuelle Händler entwickelt, die nach präziseren Markteinstiegen suchen. Dieser Indikator nutzt fortschrittliche Algorithmen, um interessante Bereiche zu erkennen, indem er die wichtigsten Unterstützungs- und Widerstandszonen auf dem Chart sowie deren Ausbrüche und Wiederholungen berechnet. Dieser Indikator kann so konfiguriert werden, dass er Warnungen und Benachrichtigungen sendet, wenn potenziell lukrative Kauf-/Verkaufsgelegenheiten erkannt werden, so dass

Entdecken Sie, wo große Institutionen handeln und optimieren Sie Ihre Investitionen mit dem kostenlosen VWAP-Anker-Indikator für MetaTrader 4. Entdecken Sie den Preis, zu dem große Institutionen Geschäfte tätigen, mit unserem kostenlosen VWAP-Anker-Indikator für MetaTrader 4! Jetzt können Sie wertvolle Zeit sparen, indem Sie das Plotten Ihrer verankerten VWAPs automatisieren, indem Sie sie an den Tops und Böden des Marktes verankern. Unsere kostenlose Version ermöglicht es Ihnen, die VWAP in Ech
FREE
Anzeige der Zeit bis zum Ende der Kerze. Zeigt die Zeit bis zum Ende der Kerze sowie die Serverzeit an. Text kann den Trend oder die Richtung der Kerze anzeigen, akustische Benachrichtigungen sind integriert Besonderheiten:
Zeigt die Zeit bis zum Ende der aktuellen Kerze sowie andere Zeitrahmen an, die bei Bedarf angepasst oder deaktiviert werden können AW Candle Time kann die Richtung der aktuellen Kerze oder des Trends mit dem AW Super Trend Indikator auswählen Die Trendstrategie wird in der
FREE
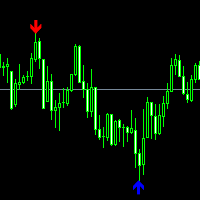
AMS Scalper
An excellent indicator for the entry point into the market; we use indicator signals only according to the trend.
Settings:
Range - 50 (range size for signal search.)
Maximum candles Back - 3 (after how many candles to set a signal)
P.S. For the signal to appear on the zero candle, set 0.
We recommend a trend indicator - Trend Arrow Super
Still have questions? do you need help?, I'm always happy to help, write to me in private messages or
In telegram
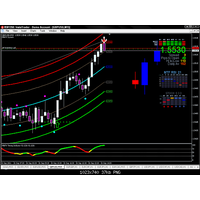
Gravity Timing Indicator -GTI-
Der GTI-Indikator ist der bisher einfachste und genaueste Indikator. Er nutzt Unterstützung und Widerstand auf Schwerkraftbasis. Die Arbeit daran ist so einfach, dass er aus 7 Linien besteht, von denen die stärksten die niedrigste und die höchste Linie sind Der Indikator erholt sich, es ist die beste Zeit für einen Einstieg.
es funktioniert bei allen Paaren ohne Ausnahme
Für den Zeitrahmen bevorzuge ich kleine Zeitrahmen wie 5 Minuten und 15 Minuten für da
FREE
Der RSI Pro Analyzer Indicator ist ein leistungsstarkes Tool für Händler, die fundierte Entscheidungen über mehrere Zeiträume gleichzeitig treffen möchten. Dieser Indikator nutzt den RSI, um Überkauft-, Überverkauft- und Trendsignale bereitzustellen und so die Identifizierung von Markteintrittsmöglichkeiten zu erleichtern. Sein Hauptvorteil ist die einfache Lesbarkeit dank der klaren und eindeutigen Farbcodes, die auf unterschiedliche Marktbedingungen hinweisen.
Der Indikator zeigt RSI-Werte

Volume Champion ist ein Indikator, der das Volumen des Marktes analysiert und die Daten in Form eines Histogramms anzeigt. Sie müssen sich nicht in die Theorie der Marktanalyse vertiefen. Sie können einfach den Indikatorwerten folgen. Die Indikatorbalken zeigen die potenzielle Richtung der Preisbewegung basierend auf der Analyse der Marktvolumenstruktur. Dieser Indikator ist für die Verwendung in höheren Zeitrahmen wie H4, D1, W1 konzipiert. SIGNALE WERDEN NICHT BEREITGESTELLT! Technisch gesehen

MACD Intraday Trend ist ein Indikator, der durch eine Adaption des ursprünglichen MACD von Gerald Appel in den 1960er Jahren entwickelt wurde.
Im Laufe der Jahre des Handels wurde beobachtet, dass wir durch die Änderung der Parameter des MACD mit Fibonacci-Proportionen eine bessere Darstellung der Kontinuität der Trendbewegungen erreichen, wodurch es möglich ist, den Beginn und das Ende eines Preistrends effizienter zu erkennen.
Aufgrund seiner Effizienz bei der Erkennung von Kurstrends ist
FREE

FOLLOW THE LINE GET THE FULL VERSION HERE: https://www.mql5.com/en/market/product/36024 This indicator obeys the popular maxim that: "THE TREND IS YOUR FRIEND" It paints a GREEN line for BUY and also paints a RED line for SELL. It gives alarms and alerts of all kinds. IT DOES NOT REPAINT and can be used for all currency pairs and timeframes. Yes, as easy and simple as that. Even a newbie can use it to make great and reliable trades. NB: For best results, get my other premium indicators for more
FREE

Der Indikator « Identify Trend » („Trend erkennen“), bei dem relativ einfache, aber robuste Filtermethoden (basierend auf dem sich bewegenden Median - XM-Algorithmus und komplexer, vom Autor entwickelt, Algorithmen XC, XF, XS, vier Arten von gleitenden Durchschnitten ohne Verzögerung SMAWL, EMAWL, SSMAWL, LWMAWL ) verwendet werden, ermöglicht sehr genau und vor allem mit einer geringen Verzögerung (1) den Beginn der tatsächlichen Trendbewegung und (2) die Identifizierung der W
FREE

The Omega Trend Indicator is an advanced tool that has been specifically designed to detect market trends early, and follow them efficiently. The indicator draws two lines. The main (thicker) Trend Line represents the presumed lower or upper volatility limits of the current market trend. A break in the main Trend Line indicates a potential reversal or shift in the movement of the trend. The Trend Line also indicates the best point to place a stop loss order. In Omega Trend Indicator, the Trend L
FREE

In statistics, Regression Channel is a approach for modelling the relationship between a scalar response (or dependent variable) and one or more explanatory variables (or independent variables).We Applied relative strength index(rsi) values to develop regression models of various degrees in order to understand relationship between Rsi and price movement. Our goal is range prediction and error reduction of Price divergence , thus we use Rsi Regression

This is Free product you are welcome to use for your needs! Also I very appreciate your positive feedbacks! Thanks a lot! // More great Expert Advisors and Indicators are available here: https://www.mql5.com/en/users/def1380/seller // Also you are welcome to join to profitable , stable and reliable signal https://www.mql5.com/en/signals/1887493 Forex Indicator: Heiken Ashi Candles for MT4. No Repaint. Heiken_Ashi_Candles has great combination with Trend Line MA indicator https://
FREE

Info Plus is a simple tool that displays the current status on an asset class. The information displayed by Info Plus includes: Bid Price The high and low of the day. Candle time left. Current spread. Selected timeframe. Asset class selected (Symbol). Pip value. Open Positions. Total pips booked. Pips per trade. Session times (they may not be accurate and are subject to changes). Date and time.
How it Works When loaded onto any chart, Info Plus automatically gets the following parameters: Bid
FREE
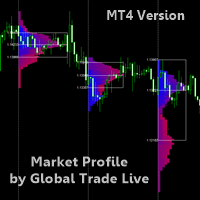
READ THE DESCRIPTION ITS IMPORTANT - ONLY TAKES 2 MINUTES - THIS IS A TOOL NOT A TRADING STRATEGY
Market Profile By Global Trade Live A Market Profile is a graphical representation that combines price and time information in the form of a distribution. A Market Profile is used to determine elapsed time, number of ticks and volumes traded at specific prices, or over a price interval, over a given period. A Market Profile also makes it possible to identify prices accepted or rejected by the ma
FREE
MT5 Version Available Here: https://www.mql5.com/en/market/product/50255
Telegram Channel & Group : https://t.me/bluedigitsfx
V.I.P Group Access: Send Payment Proof to our Inbox
Recommended Broker: https://eb4.app/BDFXOsprey
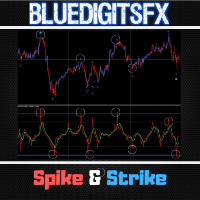
* Breakthrough Solution For Reversal Trading And Filtering With All Important Features Built Inside One Tool! BlueDigitsFx Spike And Strike Reversal is a mixed oscillator that mixes the readings of a number of indicators, which makes it potential to preci

ENIGMERA: Der Kern des Marktes https://www.enigmera.com
Einführung Dieser Indikator und dieses Handelssystem sind ein bemerkenswerter Ansatz für die Finanzmärkte. ENIGMERA nutzt die fraktalen Zyklen zur genauen Berechnung von Unterstützungs- und Widerstandsniveaus. Er zeigt die echte Akkumulationsphase an und gibt Richtung und Ziele vor. Ein System, das funktioniert, egal ob wir uns in einem Trend oder in einer Korrektur befinden.
Wie funktioniert es? ENIGMERA besteht aus drei Linien: der

5/10 Kopien zu 30$ ---> nächste 50$ // MT5 Version
Forex Vigor ist ein technischer Indikator, der die Momentumstärke der 8 Hauptwährungen (EUR, GBP, AUD, NZD, USD, CAD, CHF, JPY) bewertet. Der Indikator stützt sich auf mathematische Berechnungen, die den Mangel an Korrelation zwischen 28 Währungspaaren messen. Zur Berechnung der Werte wird die prozentuale Differenz zwischen den Schlusskursen mit der Methode der linear gewichteten Mittelwertbildung (LWMA) und einem statistischen System analysi

The balance of supply and demand is a simple and effective market analysis method. The supply and demand diagram can show you in advance, even before the trend reversal, where the supply ends and the demand is already emerging, where the demand ends and the supply is emerging, while substantially increasing the probability of making a deal in the right direction and with a high profit factor.
Indicator Signals The indicator uses the price/volume values to generate signals: ED – excess demand.

"Adjustable Fractals" - is an advanced version of fractal indicator, very useful trading tool! As we know Standard fractals mt4 indicator does not have settings at all - this is very inconvenient for traders Adjustable Fractals has resolved that issue - it has all necessary settings: Adjustable period of indicator (recommended values - above 7) Adjustable distance from Highs/Lows of price Adjustable design af fractal arrows // More great Expert Advisors and Indicators are available he
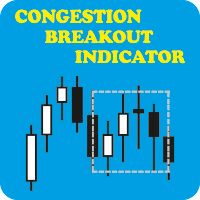
CONGESTION BREAKOUT INDICATOR: When you see a sideways price movement in a meaningless market, what goes through your mind? Is it a danger, an opportunity or completely a vacuum? Let's see if we can avoid the latter and focus on using it to our advantage. The ability to read price action through the display of rectangles on the chart could be the boost you need to achieve your trading goals. What is congestion? Congestion is a market situation where the price is trading around a particular leve
To get access to MT5 version please click here . This is the exact conversion from TradingView: "UT Bot Alerts" by "QuantNomad". This is a light-load processing and non-repaint indicator. Buffers are available for processing in EAs. Candle color option is not available. You can message in private chat for further changes you need. Here is the source code of a simple Expert Advisor operating based on signals from UT Bot Alerts . #property strict input string EA_Setting= "" ; input int magic_numb

Торговля пивотами:
1.pp pivot
2. r1 r2 r3, s1 s2 s3 Necessary for traders: tools and indicators Waves automatically calculate indicators, channel trend trading Perfect trend-wave automatic calculation channel calculation , MT4 Perfect trend-wave automatic calculation channel calculation , MT5 Local Trading copying Easy And Fast Copy , MT4 Easy And Fast Copy , MT5 Local Trading copying For DEMO Easy And Fast Copy , MT4 DEMO Easy And Fast Copy , MT5 DEMO
Empfehlen dringend Trendindikatoren,
FREE
A personal implementation of the famous Bollinger bands indicator as a trend following mechanism, which uses a moving average and the standard deviation to define what a trend is and when it changes. Bollinger bands are usually used as an oversold/overbought indicator only, but in my opinion, the trading approach is more complete using the trend variant as an exit strategy. [ Installation Guide | Update Guide | Troubleshooting | FAQ | All Products ] Easy to trade Customizable colors and sizes It
FREE

This indicator presents an alternative approach to identify Market Structure. The logic used is derived from learning material created by DaveTeaches (on X)
When quantifying Market Structure, it is common to use fractal highs and lows to identify "significant" swing pivots. When price closes through these pivots, we may identify a Market Structure Shift (MSS) for reversals or a Break of Structure (BOS) for continuations. The main difference with this "protected" logic is in how we determine

The indicator analyzes the volume scale and splits it into two components - seller volumes and buyer volumes, and also calculates the delta and cumulative delta. The indicator does not flicker or redraw, its calculation and plotting are performed fairly quickly, while using the data from the smaller (relative to the current) periods. The indicator operation modes can be switched using the Mode input variable: Buy - display only the buyer volumes. Sell - display only the seller volumes. BuySell -
FREE

Supply Demand Zone Pro Indicator works with all products and timeframes. It is using a new calculation method, and now you can select the desired zone on any timeframe! Strongest Zones are already enabled by default This is a great advantage in trading.This indicator has a built in backtester enabled by default, just move the chart.
Supply and Demand ?
Supply is a price zone where sellers outnumbered buyers and drove the price lower. Demand is a price zone where buyers outnumbers sellers and

Calculation of Lot Size for many traders is a big challenge.
A case that is very important in money management. What many traders ignore.
Choosing an appropriate Lot Size in trades can improve results and it will ultimately lead to success.
This indicator calculates the authorized Lot Size for your trades.
The indicator uses the following values to get the appropriate Lot Size for positioning:
The distance of Stop Loss.
The Pip Value.
The amount of Risk Allowed For Each Trade.
T
FREE
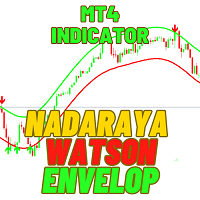
The Nadaraya Watson Envelope is a technical indicator available in the MetaTrader 4 (MT4) platform. It uses a non-parametric method to estimate the underlying trend of a financial asset based on its past price movements. The envelope is created by calculating a weighted average of the asset's past prices, with more recent prices being given greater weight. This produces a smooth curve that represents the estimated trend of the asset. The envelope is then drawn around this curve, with upper and l
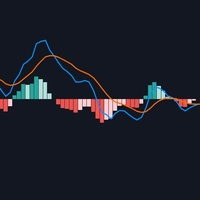
Moving average convergence divergence (MACD) is a trend-following momentum indicator that shows the relationship between two moving averages of a security’s price. The result of that calculation is the MACD line. A nine-day EMA of the MACD called the "signal line," is then plotted on top of the MACD line, which can function as a trigger for buy and sell signals. Traders may buy the security when the MACD crosses above its signal line and sell—or short—the security when the MACD crosse
FREE
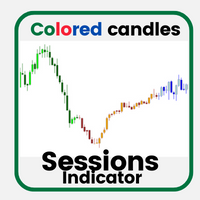
This indicator shows trading sessions using colored candles. It's made for volume profile and supply/demand traders to quickly see when specific candles are formed during different times or trading sessions.
Take a look at the screenshots for a usage example.
Core Features: Different colors for bullish and bearish candles, allowing users to distinguish between bullish/bearish candles.
FREE

The indicator is designed to work on any trading platform. The program is based on proprietary algorithms and W.D.Ganna's mathematics, allowing you to calculate target levels of price movement based on three points with the highest degree of certainty. It is a great tool for stock trading. The indicator has three buttons: NEW - call up a triangle for calculation. DEL - delete the selected triangle. DELS - completely remove all constructions. The probability of achieving the goals is more than 80

Display your Local Time on your charts
Display your local time instead of (or along with) MT4 server time.
Display crosshair which highlights current candle time.
Automatically adjusts based on chart zoom (zooming in or out).
Displays on every timeframe (M1 – Month), and auto-adjusts as chart timeframe is changed.
Handles special ½ hour time zones , such as India.
Renders fast (no lag) as you scroll charts.
Customize the font family, font size, background color, and crossh
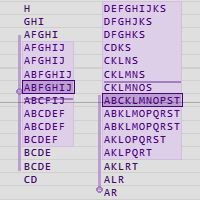
Market Profile is a graphic representation that shows price and time information as a distribution. The benefits of Market Profile include: Determine amount of time, number of ticks and volume traded at specific price levels or price ranges during a period Identify prices perceived as fair by the market Identify support and resistance levels to anticipate future price movements Each group of letters shows the price or price range where trades occured, usually in the 30 minutes chart timeframe. T

Contact me for instruction, any questions! Introduction V Bottoms and Tops are popular chart patterns among traders due to their potential for identifying trend reversals. These patterns are characterized by sharp and sudden price movements, creating a V-shaped or inverted V-shaped formation on the chart . By recognizing these patterns, traders can anticipate potential shifts in market direction and position themselves accordingly. V pattern is a powerful bullish/bearish reversal pattern
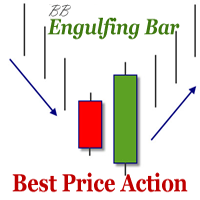
The indicator defines the Bullish and Bearish Engulfing Bar. The pattern has greater reliability when the open price of the engulfing candle is well above the close of the first candle, and when the close of the engulfing candle is well below the open of the first candle. For an engulfing bar to be valid it must fully engulf at least one previous bar or candle - includes all the body and the wick. The engulfing bar can engulf more than one bar as long as it completely engulfs the previous bar.
FREE

This dynamic indicator allows you to measure retracements of price between any two points in either direction. It displays the price points, percentages and also displays the extension levels.
User may Modify and Add addition levels and extensions." User may also Add multiple Fibonacci indicators on the chart and change their colors, style and sizes.
Can be used on any timeframe.
This is the only Fibonacci Tool you'll need to measure and trade on Structure.
MT5 Version Available as we
FREE

Trend Hunter ist ein Trendindikator für die Arbeit am Forex-Markt. Ein Merkmal des Indikators ist, dass er sich selbstbewusst mit dem Trend bewegt, ohne das Signal zu ändern, wenn der Preis die Trendlinie leicht durchbricht. Der Indikator zeichnet nicht neu, das Signal zum Eintritt in den Markt erscheint, nachdem der Balken geschlossen wurde.
Trend Hunter ist ein fairer Indikator. Fahren Sie mit der Maus über das Indikatorsignal, um den potenziellen Gewinn des Signals anzuzeigen.
Für den Ha
Indikator konvertiert von einer anderen Plattform, die von LuxAlgo codiert wurde.
Ich fügte Moving Average verschiedenen Typ auch Quelle Daten Vielfalt. In der ursprünglichen Version gleitender Durchschnitt ist SMA und Datenquelle aus dem Markt gesammelt nur aus dem Abschluss der Kerzen.
In dieser Version können Sie viele gleitende Durchschnittstypen und auch Datenquellen wie Hoch/Tief/HL2/HLC/HLC2/... auswählen.
Hier sind einige Details vom ursprünglichen Entwickler:
Der Range Detecto

Advanced version of CyberZingFx Volume Plus, the ultimate MT4 indicator for traders seeking highly accurate buy and sell signals. With an additional strategy and price action dot signals that enhances its effectiveness, this indicator offers a superior trading experience for professionals and beginners alike. The CyberZingFx Volume Plus Advanced version combines the power of volume analysis and historical price data with an additional strategy, resulting in even more precise and reliable signals
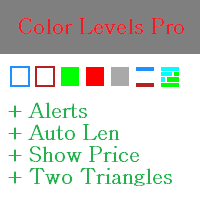
Color Levels Pro is a new version of the normal Color Levels. It allows setting two empty rectangles, three filled ones, two tredlines, and two triangles.
The indicator parameters are very simple and divided into blocks:
The ones beginning with 1 and 2 - empty rectangle (frame) parameters; 3, 4, and 5 - filled rectangle parameters; 6 and 7 - trendline parameters; 8 and 9 - triangle parameters. Simply click a desired object and it will appear in the corner.
Main Adjustable Parameters : C
FREE

Nehmen Sie am Handel mit dem WolfeWaveBuilder-Indikator teil! Dies ist ein einzigartiges Tool, das speziell dafür entwickelt wurde, die erfolgreichsten und profitabelsten Investitionsentscheidungen zu treffen. Es ist ideal für Live-Konten und profitiert von einer gründlich getesteten und praktisch garantierten Handelsstrategie. Verpassen Sie nicht Ihre Gelegenheit! Fangen Sie an, mit dem WolfeWaveBuilder-Indikator Geld zu verdienen!
MT5-Version https://www.mql5.com/ru/market/product/82360
I
MetaTrader Market - der einzige Shop, in dem man Handelsroboter als Demoversion herunterladen und testen sowie anhand historischer Daten optimieren kann.
Lesen Sie die Beschreibung und Bewertungen anderer Kunden über das gewünschte Produkt, laden Sie es direkt ins Terminal herunter und erfahren Sie, wie man einen Handelsroboter vor dem Kauf testet. Nur bei uns können Sie ein Programm testen, ohne dafür zu bezahlen.
Sie verpassen Handelsmöglichkeiten:
- Freie Handelsapplikationen
- Über 8.000 Signale zum Kopieren
- Wirtschaftsnachrichten für die Lage an den Finanzmärkte
Registrierung
Einloggen
Wenn Sie kein Benutzerkonto haben, registrieren Sie sich
Erlauben Sie die Verwendung von Cookies, um sich auf der Website MQL5.com anzumelden.
Bitte aktivieren Sie die notwendige Einstellung in Ihrem Browser, da Sie sich sonst nicht einloggen können.