Смотри обучающее видео по маркету на YouTube
Как купить торгового робота или индикатор
Запусти робота на
виртуальном хостинге
виртуальном хостинге
Протестируй индикатор/робота перед покупкой
Хочешь зарабатывать в Маркете?
Как подать продукт, чтобы его покупали
Технические индикаторы для MetaTrader 4 - 20

Индикатор позволяет анализировать изменения тиковых объемов в виде кумулятивных дельта-баров (свечей). Он вычисляет на каждом баре тиковые объемы для покупок и продаж (раздельно), а также их разницу. Кроме того, он может выводить объемы в разбивке по кластерам (ячейкам) цен внутри указанного бара (обычно это последний бар). Данный индикатор производит вычисления аналогично VolumeDelta , но предоставляет иное отображение результатов. Имеется версия для МетаТрейдер 5 - VolumeDeltaBars . Это ограни
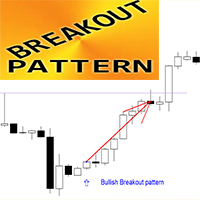
Индикатор Crypto_Forex "Breakout Pattern" для MT4.
- Индикатор "Breakout Pattern" - очень мощный индикатор для торговли Price Action: без перерисовки, без задержки. - Индикатор обнаруживает комбинацию баров Breakout, также называемую "3 изнутри" на графике: - Модель Bullish Breakout - сигнал синей стрелки на графике (см. рисунки). - Модель Bearish Breakout - сигнал красной стрелки на графике (см. рисунки). - С оповещениями на ПК, мобильных устройствах и электронной почте. - Индикатор "Breakout

Тестирование демо-версии не принесёт пользы. Вы ничего не поймёте, глядя на мигающие цифры. Это панель мониторинга. Постарайтесь понять идею, и я помогу вам с остальным.
Символы должны быть разделены запятыми (,) и введены в параметры точно так, как они отображаются у вашего брокера, чтобы их можно было распознать на панели мониторинга. Эти символы будут использоваться для анализа индикатором.
С одним кликом можно открыть любую пару на любом таймфрейме прямо с панели мониторинга.
MA Speedome
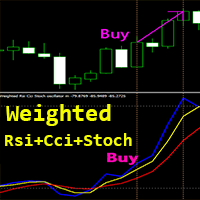
Индикатор Crypto_Forex «Взвешенный RSI Cci Stoch Oscillator» для MT4, без перерисовки.
- Этот уникальный индикатор объединяет 3 в 1: RSI, CCI и Stochastic для расчета! - Точные возможности импульсной торговли с этим программным обеспечением - см. примеры на картинках. - Индикатор состоит из 3 линий: - Сам Weighted Rsi Cci Stoch Oscillator (синий цвет); - Быстрая скользящая средняя осциллятора (желтый цвет); - Медленная скользящая средняя осциллятора (красный цвет); - Зона выше 50 - зона переку
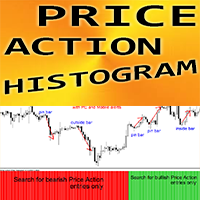
Crypto_Forex Индикатор "Price Action Filter Histogram" - эффективный вспомогательный торговый инструмент для торговли по Price Action! Не перерисовывается.
- Этот индикатор подсказывает трейдеру направление входа. Затем трейдеру просто нужно искать сигналы Price Action в этом направлении. - Price Action Filter Histogram следует сочетать с паттернами Price Action и уровнями поддержки/сопротивления. - Зеленая гистограмма - Ищите входы на покупку. - Красная гистограмма - Ищите входы на продажу. -

FALCON ZONES , OPORTUNIDADES EN EL MERCADO PARA COMPORAR O VENDER
Características Destacadas: Identificación de Patrones de Velas: Reconoce una amplia gama de patrones de velas, desde patrones simples hasta formaciones más complejas. Proporciona una visión completa de la psicología del mercado encapsulada en las velas. Alertas Personalizadas: Configura alertas a medida para los patrones de velas que más te interesan o que se alinean con tu estrategia. Recibe notificaciones instantáneas cuando s
FREE
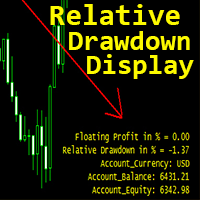
Crypto_Forex Indicator "Relative Drawdown Display" для MT4, полезный торговый инструмент.
Это ОБЯЗАТЕЛЬНЫЙ индикатор для трейдеров, использующих системы торговли по сетке!!!
- Индикатор Relative Drawdown Display показывает текущую относительную просадку или плавающую прибыль в % на вашем счете. - Встроенные оповещения для ПК и мобильных устройств с регулируемым уровнем срабатывания. - Индикатор также показывает баланс и капитал счета. - Можно расположить значения индикатора в любом углу графи
Данный индикатор, интерпретируя данные ADX и ATR, наглядно и точно идентифицирует текущий тренд, позволяя трейдеру получать максимум результата из сильных движений цены. Применение индикатора интуитивно понятно: смена направления линии - смена направления тренда; изменение цвета линии предупреждает о скорой смене направления. Индикатор не перерисовывается и позволяет направлять уведомления о своих сигналах на мобильный терминал и электронную почту. Настраиваемые параметры: ADX_Medium_Coefficient
FREE
Ultimate Follow Line v3
Идеальный индикатор для точного следования тренду! Откройте для себя Ultimate Follow Line v3 — индикатор, созданный для MetaTrader 4, который помогает четко определять направление рынка. Разработанный на MQL4, он сочетает простой и эффективный дизайн с передовыми технологиями, предлагая трейдерам мощный и интуитивно понятный инструмент. Основные характеристики: Интуитивное отображение: Динамические линии, которые адаптируются к движению цены, выделяя ключевые зоны развор

The XR Gartley Pattern MT4 is an indicator which displays and alerts Gartley pattern detected on the candlestick chart. It also displays potential trade with calculated Take Profit and Stop Loss, Timeframe H1. After purchasing XR Gartley Pattern, you can immediately download this indicator from the MT4-MT5 Market and start using it because all features are set to default, is not necessary to change any parameter. In addition, we have created a private group for customers who have purchased one
FREE

This simple indicator paints with a darker color on the volume bar when the quantity traded is above the average of select number of periods of the volume itself, highlighting the moments when there was a large volume of deals above the average. It is also possible to use a configuration of four colors where the color tone shows a candle volume strength. The indicator defaults to the simple average of 20 periods, but it is possible to change to other types of averages and periods. If you like t
FREE

Обзор:
Индикатор Цветной Parabolic SAR – это визуально улучшенный торговый инструмент, разработанный для облегчения следования за трендом и идентификации сделок. Этот настраиваемый индикатор предоставляет четкие визуальные подсказки с цветными сигналами для бычьих (покупка) и медвежьих (продажа) трендов прямо на вашем графике MT4. Основные особенности: Цветные сигналы: Лаймовый зеленый символ "o" для сигналов на покупку. Красный символ "o" для сигналов на продажу. Настраиваемые параметры: Регул
FREE

Индикатор показывает на графике круглые уровни . Их еще называют психологическими , банковскими или уровнями основных игроков. На этих уровнях происходит настоящая борьба быков и медведей, накопление множества ордеров, что приводит к повышенной волатильности. Индикатор автоматически подстраивается под любой инструмент и таймфрейм. При пробитии и последующем тесте уровня 80 - покупаем . При пробитии и последующем тесте уровня 20 - продаём . Цель - 00. Внимание. Из-за сильных уровней
FREE
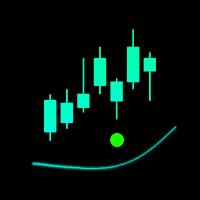
Индикатор предназначен для быстрого скальпинга. Принцип работы индикатора построен на направлении Moving Average. Период и чувствительность Moving Average можно настроить под себя в настройках индикатора. Рекомендую посмотреть моего советника - Night Zen EA
Подпишись на мой telegram канал, ссылка в контактах моего профиля . Преимущества индикатора: Бесплатная версия полная, никаких дополнительных покупок нет Стрелки не перерисовываются, сигнал приходит после подтверждения стратегии Все виды о
FREE
Dynamic Trading Dashboard for MT4 This powerful MT4 trading dashboard offers traders a comprehensive view of current and historical trading performance in an intuitive and visually organized format. With its precision-engineered design, the dashboard provides a seamless blend of real-time insights and historical analysis. This trading dashboard is perfect for meticulous traders who seek a precise, all-encompassing tool to manage open and closed positions while gaining insights into past perform
FREE

Целью этой новой версии стандартного MT4 индикатора, входящего в поставку платформы, является отображение в подокне нескольких таймфреймах одного и того же индикатора. См. пример, приведенный на рисунке ниже. Однако индикатор отражается не как простой индикатор MTF. Это реальное отображение индикатора на его таймфрейме. Доступные настройки в индикаторе FFx: Выбор таймфрейма для отображения (от M1 до MN) Установка ширины (количество баров) для каждого окна таймфрейма Всплывающее оповещение/звуков
FREE

The Pivot Indicator is a vital tool for technical analysis used by traders in the financial markets. Designed to assist in identifying potential reversal points or trend changes, this indicator provides valuable insights into key levels in the market. Key features of the Pivot Indicator include: Automatic Calculations: The Pivot Indicator automatically calculates Pivot Point, Support, and Resistance levels based on the previous period's high, low, and close prices. This eliminates the complexity
FREE

Этот индикатор является основой для эксперта, который можно отнести к категории "почти Грааль". См. подробности ниже. Этот индикатор отображает проекцию графика ренко на ценовой график. Эта проекция отображается в виде ступенчатой линии, а не в виде "кирпичей" (прямоугольников). См. слайды 1 и 2. Сокращённое название индикатора: LRC – L ine of R enko on the price C hart . Принцип его построения очень прост. Сначала строится сетка горизонтальных линий (уровн
FREE

Канал Supernatural channel определяется по специальному алгоритму, используются маркерные точки, для определения движения канала. Supernatural channel состоит из двух линий, красной и синей, которые составляют канал. Простое, визуальное и эффективное использование. Можно использовать для торговли внутри канала. Индикатор не перерисовывается и не запаздывает. Работает на всех валютных парах и на всех таймфреймах.
Индикатор предназначен для разметки ,фибо уровней и фибо зон.Также есть возможность удаления и редактирования уровней на текущем графике. При установке нескольких индикаторов (FIBO-ZONES)на график,не забывайте менять имя в поле (NAME).В утилите также есть возможность менять цвет зон, толщину линий и стиль линий уровней фибо. При установке индикатора ,зоны выстраиваются автоматически.
FREE
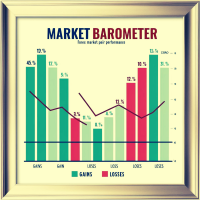
Market Barometer is a cheat code for trading, it acts as a "barometer" for market sentiment across various pairs, showcasing their changes. You can tell right away what to trade. You can trade trends or reversals. MT5 Version: https://www.mql5.com/en/market/product/127467 Market Barometer is a powerful tool designed to track and visualize the percentage changes across multiple currency pairs. By analyzing the price shifts of different forex pairs, it helps you understand how they are correlat
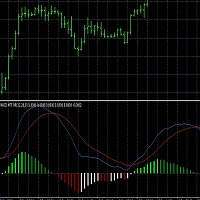
This script generates a MACD with 6 color-coded histogram bars based on the position (above or below zero) and direction (rising or falling) of the histogram. It provides multi-time frame support , allowing users to view the MACD from different time frames on a single chart. The indicator uses customizable settings for MACD periods, histogram width, and vertical scaling. This script could be useful for traders who want a visually enhanced MACD with clearer trend and momentum representation acro
FREE

An indicator that determines the point levels of price resistance. The arrows indicate price bounces in the indicated directions.
Arrows are not redrawn formed on the current candle, shown on the previous candle for convenience.
It has one setting - the formation intensity:
If the parameter is smaller, most of the signals are formed in a wide trend. If the parameter is larger, signals are formed in a narrower trend.
Input parameters
Formation Intensity - Arrow Formation Intensity Number B

Multi Time Frame Indicator acts as a Scanner based on the Ichimoku Trading System. The outcome is displayed on a board. This helps you to make "at a glance" a mental picture of the System without having to open the chart. Up to 10 Currencies can be watched. Scanned elements And Legend "KUMO Futur" - Green : The Kumo Futur is Bullish. "KUMO Futur" - Red : The Kumo Futur is Bearish. "PRICE Cross KJ" - Green : The Price is Above the Kijun Sen. "PRICE Cross KJ" - Red : The Price is Below the Kijun
FREE

THE SCALPER SIGNALS BUY AND SELL ENTRIES / REENTRIES , BASED ON THE PRICE ACTION OF BARS
IT HAS MULTIPLE MODES AS SELECTED , Which will provide different price action signals . The Signals are further filtered using Higher Time Frame Trend Analysis. For Example - (1) The Signals Of reversal points entries of the Higher Time frame can are plotted over any lower time frame , Giving robust signals (2) The Signal Of Lower time Frame - plotted only when the higher time frame is also in tha

Индикатор First RSI level создан для анализа и отображения на ценовом графике уровня, на котором произошло первое пересечение максимального или минимального значения стандартного индикатора RSI, для последующего определения сильных тенденций. Индикатор позволяет отслеживать начало тенденции, не подчиняющейся сигналам стандартной стратегии торговли по индикатору RSI. Когда, к примеру, после достижения уровня перепроданности, цена идет не вверх, а устремляется вниз, тем самым как бы "продавливая"
FREE

Trend Filter Pro
Индикатор фильтрации тренда. Очень хороший фильтр для вашей торговой системы, рекомендую использовать совместно с - System Trend Pro или Quantum Entry PRO
Индикатор не перерисовывается и не изменяет свои данные.
Настройки: Меняйте параметр Period для лучшей фильтрации ( по умолчанию стоит - 90)
Остались вопросы? нужна помощь?, я всегда рад помочь, пишите мне в личные сообщения
FREE

Note : The slow loading of the indicator issue has been addressed . This new version loads fast and does not slow the platform.
Version 1.3 : We have updated the indicator to include an historical bar scanning option . So instead of scanning all bars in the history (which can make the indicator slow sometimes ) , you can select the maximum number of bars it can scan which can increase the performance and make the indicator faster.
This indicator scans the 1-3 Trendline pattern . The indicato
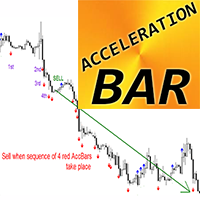
Индикатор Crypto_Forex Acceleration Bar для MT4 — способен улавливать огромные тренды.
- Индикатор "Acceleration Bar" — очень мощный инструмент для торговли по тренду — влияние флэта на рынке сведено к минимуму. - Bullish Acceleration Bar (синий) — это бар на графике, у которого Max выше, чем max предыдущих 5 баров, и Min ниже, чем min следующих 5 баров. - Bearish Acceleration Bar (красный) — это бар на графике, у которого Min ниже, чем min предыдущих 5 баров, и Max выше, чем max следующих 5 б

Lisek Stochastic oscillator indicator with Alarm, Push Notifications and e-mail Notifications. The Stochastic indicator is a momentum indicator that shows you how strong or weak the current trend is. It helps you identify overbought and oversold market conditions within a trend. The Stochastic indicator is lagging indicator, which means it don't predict where price is going, it is only providing data on where price has been !!!
How to trade with Stochastic indicator: Trend following: As long
FREE

Abiroid Profit Percent Series 1: Arrows Indicator Stochastic Ichimoku with ATR
Get the Scanner for free. For getting Profit Percentages for Multiple Timeframes and Multiple Pairs. And read detailed description about this indicator and all the settings here. And get extra Indicators, Templates and settings for download: https://abiroid.com/product/profit-percent-stoch-ichimoku-with-atr
Watch the tutorial video here: https://youtu.be/C45-9kWPE2Q
About The Strategy:
This strategy has 3 main par
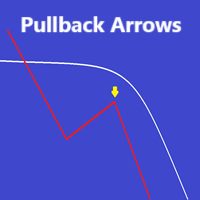
Индикатор предоставляет стрелки покупки и продажи со скользящей средней и цветом бара на основе EMA.
Над скользящей средней показаны только стрелки покупки, а ниже скользящей средней показаны только стрелки продажи.
Стрелки основаны на алгоритме разворота и, следовательно, пытаются найти точки отката.
Оповещения можно активировать по желанию
Подходит для любого таймфрейма и инструмента по выбору.
Пожалуйста, протестируйте в демо-версии перед покупкой
Наслаждаться
----------

Шаблон развертки это передовой инструмент, предназначенный для определения как вращения медвежьего тренда, так и вращения бычьего тренда с беспрецедентной точностью,
давая вам возможность принимать обоснованные торговые решения и оставаться на шаг впереди рынка. Версия MT5: WH Sweep Pattern MT5 Особенности шаблона развертки:
Он автоматически обнаруживает и отображает на графике вращение медвежьего и бычьего тренда, используя разные цвета и стили. Он отправляет вам оповещение (звуковое,

Информация об индикаторе MACD доступна по этой ссылке .
Описание программы Этот индикатор способен отображать 1-2 индикатора MACD на разных таймфреймах и с разными настройками. Имеется бесплатная версия, которая использует для расчетов EMA. Данная версия Pro использует все 4 типа скользящих средних для расчетов: простая, экспоненциальная, сглаженная и линейно-взвешенная. Активные индикаторы могут подавать всплывающее, звуковое, push-сообщение или оповещение по электронной почте. В бесплатной ве

Line Breakouts - Система для торговли по тренду.
Содержит определитель тренда, который можно адаптировать к любому графику и торговому инструменту с помощью периода и функции сглаживания.
И определитель уровней поддержки и сопротивления. При нахождении цены ниже линии сопротивления - открывать сделки Sell, а при нахождении цены выше линии поддержки - открывать сделки Buy. Стоп-лосс ставить в несколько пунктов от линий, Тейк-профит фиксировать через несколько свечей(3-10-15), исходя из тайм-фрей

Индикатор создан чтобы отобразить на графике данные ценовые уровни: Максимум и минимум прошлого дня. Максимум и минимум прошлой недели. Максимум и минимум прошлого месяца. В настройках индикатора, для каждого типа уровней, можно менять стиль линий, цвет линий, включить и отключить нужные уровни. Верcия точно такого же индикатора но только со звуковыми оповещениями тут - Time Levels with Alerts .
Настройки ----Day------------------------------------------------- DayLevels - включение / отключени
FREE

Indotrend is a Smart indicator to detects the Trend and also view support & resistance, multiple timeframe to get validate the trend. it can be use for Forex,Index,Metal,Stock and Crypto. Parameters: Alerts - show popup alert message on Metatrader Hi Lo H1 Timeframe - Show LIne Hi/Low Price base on H1 timeframe Show Fibonaci level - Show Fibonaci retracement level
Show Support Resistance, - Show Support & Resistance H1 timeframe.
FREE
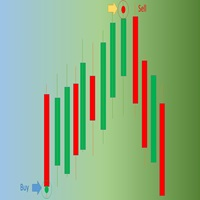
Wave_Entry_Alerts_In_EUR.mq4 is a custom indicator developed by Azad Gorgis for MetaTrader 4. This indicator is designed to provide alerts based on ZigZag patterns, specifically tailored for trading on the (EUR/USD) symbol.
Key Features: - Chart Window Indicator: The indicator is designed to be displayed on the main chart window. - Arrow Signals: The indicator generates arrow signals on the chart, indicating potential reversal points based on ZigZag patterns. - Customizable Parameters: Traders
FREE

Market Cycles это уникальный авторский индикатор, который использует нейросеть для определения текущей рыночной фазы. Для обучения нейронная сеть используют циклические (разворотные) паттерны. Валютные рынки имеют тенденцию циклически двигаться от медвежьих периодов к бычьим и обратно. В этом продукте мы объединили паттерны с четырех таймфреймов (M5, M15, M30, H1), это позволило значительно увеличить точность сигналов! Market Cycles нужно использовать на валютной паре EURUSD, таймфреме M30 !

The Donchian channel is an indicator that takes a series of user-defined periods and calculates the upper and lower bands. Draw two lines on the graph according to the Donchian channel formula. This straightforward formula is based on:
The top line is the highest price for the last periods n The bottom line is the lowest price for the last periods n
Trend systems follow periods when support and resistance levels are broken. in this case when the price breaks the upper line or the lower line o
FREE

Индикатор поддержки и сопротивления Waddah Attar Binary. Индикатор строит на графике очень мощные уровни поддержки и сопротивления. Он рассчитывает данные уровни на основе двоичных значений цены. Более сильные уровни окрашены в синий и красный цвет, имеют большую ширину. Цвет и ширину таких линий можно изменить в окне свойств индикатора. Этот индикатор работает только на инструментах с пятью знаками после запятой.
FREE

Have you ever wanted to be able to catch a trend just as it is beginning? This indicator attempts to find the tops and bottoms of a trend. It uses in-built indicators and studies their reversal patterns. It cannot be used on its own it requires Stochastic(14) to confirm signal. Red for sell, Blue for buy. There are no parameters required just attach to a chart and it is ready to go. Check out other great products from https://www.mql5.com/en/users/augustinekamatu/seller A Winning Trading Stra
FREE

The indicator is based on identifying engulfing candlestick patterns within the current timeframe. When such patterns are found, it generates buy and sell signals represented by up and down arrows, respectively. However, the user is responsible for determining the prevailing trend. Once the trend is identified, they should trade in line with the corresponding signal that aligns with the trend direction.
FREE

ATSCStrategy is a versatile indicator designed for both binary options and forex markets. Empower your trading strategies with this dynamic tool, providing valuable insights for making informed decisions in the fast-paced world of binary options and forex trading.
-Forex Market
-Binary Option Market
-Binary use timeframe 1M - 5M
-Forex use timeframe M30 or high
FREE

Simple Trading System Update !!! Follow this link to see our 2024 Strategy !!! ( Download the EAs scanner )
INTRODUCTION : The strength meter is an trading tool that is used to identify trending and consolidating markets based on the percentage rate.
HOW TO USE IT :
You can use this indicator with Deal Trading Trend >> Click Here << To use this trading tool to identify trending and consolidating markets (the most important part)
FREE

Этот индикатор использует индикаторы "Канал Дончиана" и ATR. Эта трендовая система использует исторические данные для открытия сделок на покупку и продажу. Индикатор не перерисовывается. Точка, на которой подается сигнал, не меняется. Его можно использовать на любом графике. Его можно использовать на любой валютной паре. Этот индикатор подает сигналы на вход и на выход в виде стрелок и оповещений. Открывайте длинные сделки на синих стрелках Открывайте короткие сделки на красных стрелках Если sl_
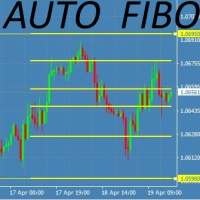
This Fibonacci Indicator is showing fibo retracement lines on chart for EA trading same as the default tool from Metatrader's menu, except this one is fully automatic and changes along with the chart (with modes B and C, then mode A is always fixed by set levels)
AND it also offers the line levels for the Expert Advisors to read (buffers) , so you can set your trades based on crossover\crossunder on those fibo lines.
You can choose from 3 modes for selecting the max HIGH and min LOW limit,
and
FREE
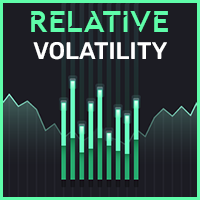
Like most things that work in trading, it's really simple. However, it's one of the most powerful tools I have that makes entries of many systems much more precise.
In its essence, it measures the recent volatility against the medium-term average. How does it work? Markets tend to be prone to strong trending movements when relative volatility is low and tend to be mean-reverting when relative volatility is high.
It can be used with both mean-reversion systems (like the Golden Pickaxe) and mo
FREE
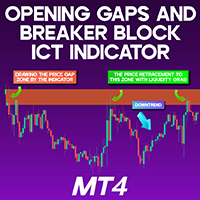
Opening Gaps and Breaker Block ICT Indicator MT4 The Opening Gaps and Breaker Block ICT Indicator MT4 is an advanced trading tool for MetaTrader 4, designed to detect daily price gaps that serve as dynamic support and resistance areas. This indicator is particularly useful for identifying key zones where price reversals may occur. Green markers indicate support gaps , while red markers highlight resistance gaps . If price moves through these zones and creates a Breaker Block (turning former supp
FREE

MA And Oscillation — это простая система, способная разобраться в путанице на рынке, просто наблюдая за скользящей средней и стохастиком. Сигнал подается при совпадении направления скользящей и осциллятора. Скользящая средняя, пожалуй, самый простой, но наиболее эффективный инструмент при торговле на старших таймфреймах. Мы используем скользящую и осциллятор для своевременного входа в рынок.
Особенности Способ упрощения рынка, которые порой бывает запутанным. Выбор получения сигнала только при
FREE

Candle Volume Strength — это расширенный индикатор анализа объема, который дает представление о текущей битве между покупателями и продавцами. Он рассчитывает и визуализирует изменения объема в реальном времени, помогая трейдерам подтверждать прорывы, тренды, откаты и развороты с большей точностью.
Основные характеристики: Подтверждение на основе объема — индикатор отслеживает изменения тикового объема и оповещает о смене рыночной власти между покупателями и продавцами. Проверка тренда и про
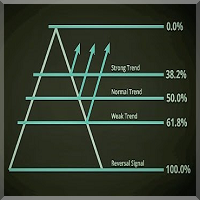
Introduction
The Fibonacci Level Professional indicator is a great tool for every day trading as a complement to other indicators for better confirmation of trade setups and where the market tends to move. This indicator is easy to setup and works on all currency pairs and time frames, M15-W1 is recommended. Purpose of this indicator is to show the Fibonacci levels on chart, the daily, upper & lower lines. As an additional function this indicator also draws the retrace and expansion lines to yo

The "Dagangduit Spread Indicator" is a versatile tool designed to provide traders with essential information about the current spread in the chart window. This indicator offers customizable features, including font parameters, display location on the chart, spread normalization, and alerts to enhance your trading experience. Key Features: Real-time Spread Display : The indicator displays the current spread in real-time on your trading chart, allowing you to stay informed about the cost of execut
FREE
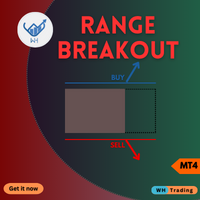
ткройте новое измерение торговли с нашим передовым индикатором MQL4 Range BreakOut MT4.
Этот мощный инструмент предназначен для выявления и извлечения выгоды из движений цен, когда они выходят за пределы установленных диапазонов.
предоставляя вам точность и уверенность, необходимые для процветания в динамичном мире финансовых рынков.
Версия MT5 : WH Range BreakOut MT5
Функции:
Точное определение диапазона. Сигналы прорыва в реальном времени. Настраиваемые параметры. Инструменты управле
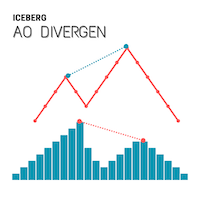
Iceberg Divergence Indicator will help traders to find divergent patterns that occur on the charts very easily and simply This indicator will visualize divergences pattern that occur on the chart by combining it with an awesome oscillator indicator
Key Features
Easy to use : The Iceberg divergent indicator is made as simple as possible so that it is easy to use Pattern Visualization : Divergent patterns will be visualized on the live chart Precision : The indicator detects divergent patterns wi
FREE
Get FREE Advanced Online Course and Learn About Our Advanced Trading System, Link in the Bio! Click Here.
Our Mission and Vision: Why Am I Even Here? Here is The Deal Brother, We Offer: Premium Quality Indicators: The Highest Quality Possible Algorithms. Unlimited Activations: Can be used on Unlimited number of Computers, MT4s and MT5s for lifetime. Inexpensive Prices: 30$ is the lowest price possible, Knowing that more than 50% of our Indicators are 100% FREE.
But Why Am I telling You this?

Индикатор является мультитаймфреймовой версией индикатора Supply and Demand . Он позволяет анализировать график, используя закон спроса и предложения на трех разных таймфреймах одновременно. Вы сможете увидеть, в каких ценовых зонах происходили покупки и продажи, и определить наиболее выгодные места для открытия позиций. В качестве основы индикатора используется принцип фрактальности рынка. Зоны на графике отображают места, где наличие сильного покупателя либо продавца заставило цену развернутьс
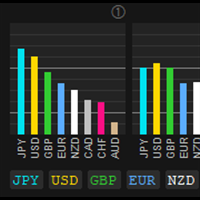
CS Info [Currency Strength Information] CS Info is the real-time MTF calculation of 28/34 symbols for the strength of 8 currencies/XAU - AUD, CAD, CHF, EUR, GBP, JPY, NZD, USD and XAU. It analyses the trend or momentum/strength of all 8 currencies and XAU to determine high probability currency combinations and trading opportunities.
Key Features Floating position - with click on Control to select and move
Mode A/Mode B for presentation of CS Calculation FX or FX/XAU to change FX or FX/XAU Ac

Investment Castle Indicator has the following features: 1. Dictates the direction of the trend in different Timeframes . 2. Shows the hit rate and winning rate on the chart. 3. This indicator does not repaint the chart. 4. This indicator is built-in the Support & Resistance based Investment Castle EA which works with Psychological Key Levels "Support & Resistance" Indicator.
FREE

Key Levels + Zones
Indicator cleanly displays even numbered price levels: “00s” and “50s” . Additionally, you can display “Mid-Lines” which are preset distance levels on both sides of the even numbered price levels (set to 12.5 pips by default). This 25-pip zone that straddles each even numbered price relates to where many traders place their stops and therefore can be a risk “Zone” to steer clear of when placing your stops. The zone also acts as support and resistance. Indicator p rovide
FREE
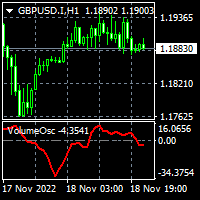
To download MT5 version please click here . The Volume Oscillator measures volume by analyzing the relationship between two Moving Averages. The Volume Oscillator indicator subtracts a fast MA from slow MA. The fast and slow MA periods are configurable via input tab. Volume indicators are an ingredient of trading systems to avoid entry in thin liquidity markets. Having set a threshold on Volume Oscillator you can avoid entering chop. Buffers are available to access via EA.
FREE
Unlike a standard moving average, trendy traders unique algorithm will show you a less choppy signal resulting in a smoother and easier trend to follow thereby making your trading decisions more confident. Put simply when price moves above the average it signals a bullish trend and when price moves below the average it signals a bearish trend. The trader is then given 2 levels of take profit and a stop loss on each new signal. It can also be added to other trend-following systems for better per
FREE

Индикатор ищет зоны покупки и продажи, где можно открыть сделку с минимальным стоп-лоссом и лучшим соотношением риск/прибыль (Risk Reward Ratio). В основе индикатора - качественный поиск паттерна Двойная вершина/Двойное дно. Эта версия работает только на паре USDCAD! Полностью рабочую версию индикатора можно купить здесь - https://www.mql5.com/ru/market/product/29820
Принцип работы индикатора Ищет локальные вершинки/низинки, которые потенциально смогут стать Разворотной зоной Ожидает импульсное
FREE

Существует огромное количество свечных моделей, но действительно знать нужно только некоторые из них. Индикатор Candlestick Pattern Filter распознает и выделяет наиболее надежные свечные паттерны. Учтите, что эти паттерны могут быть полезны, только если вы понимаете, что происходит в каждом из них. Для наилучших результатов их следует использовать совместно с другими формами технического анализа. Включены следующие модели: Молот / Повешенный Перевернутый молот / Падающая звезда Бычье / медвежье
FREE
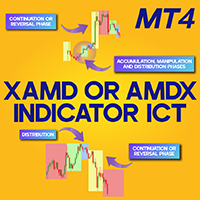
XAMD/AMDX Indicator ICT MT4
The XAMD/AMDX ICT indicator is a specialized tool for MetaTrader 4, designed to highlight possible market trend shifts. It segments price movement into three distinct phases—Accumulation (red), Distribution (blue), and Manipulation (green)—using a color-coded box system. Unlike the traditional AMD ICT indicator, this version introduces an additional "X" phase, which serves as a marker for either trend continuation or reversal.
XAMD/AMDX Indicator Specifications
Bel
FREE

Индикатор фрактал - один из основных в различных стратегиях. Индикатор Volume Fractals расширил функциональность стандартной версии, получил настройки фильтрации фракталов и отображение объемных фракталов, где объемный фрактал - это экстремум не только по цене, но и максимум по объему.
Применение Установка стоп-лоссов Сигнал на разворот Установка отложенных ордеров на пробой фрактала
Настройки Bars of history - количество баров графика, для которых рисуется индикатор Left side minimum bars - м
FREE

Three Bar Break основан на одном из методов торговли Линды Брэдфорд Рашке, который мне показался хорошим в определении потенциальной будущей волатильности цены. Индикатор ищет те моменты, когда High текущего бара ниже High второго бара, а также Low текущего бара выше Low второго бара. Это свидетельствует о возможности прорыва рынка на новый уровень в течение 2-3 следующих баров. Индикатор следует применять в основном на дневных графиках, чтобы помогать определять потенциальные движения в ближайш
FREE
Данный индикатор отображает на графике цены сигналы основанные на данных классического индикатора - Индекс денежных потоков (Money Flow Index - MFI). При расчете значений MFI учитывается объем. MFI может использоваться для определения на рынке зон перекупленности или перепроданности. Данный индикатор позволяет отображать на графике цены сигналы трех типов: выход MFI из зоны перекупленности или перепроданности; вход MFI в зону перекупленности или перепроданности; пересечение MFI середины между зо
FREE

Индикатор Correct Entry отображает на графике некоторые относительно корректные точки потенциального входа в рынок. В его основе лежит гипотеза о нелинейности движения цены, согласно которой цена движется волнообразно. И индикатор на основе некоторых моделей движения цены, а также технических данных отображает указанные точки.
Параметры индикатора: Сorrectness – Параметр, характеризующий степень точности сигналов входа. Может варироваться от 0 до 100. По умолчанию - 100. При снижении данного

Эта система поможет найти высоковероятностные сделки в направлении сильных трендов. Возможность заработать прибыль появляется с помощью поиска завершения движения в одну сторону.
Важная информация Для максимального использования потенциала сканера прочитайте полное описание (на английском языке): www.mql5.com/en/blogs/post/718109 Использование индикатора описано в записи в логе (на английском): Professional Trading With Strong Momentum Бесплатная версия индикатора работает только на парах EURUS
FREE
MetaTrader Маркет - лучшее место для продажи торговых роботов и технических индикаторов.
Вам необходимо только написать востребованную программу для платформы MetaTrader, красиво оформить и добавить хорошее описание. Мы поможем вам опубликовать продукт в сервисе Маркет, где его могут купить миллионы пользователей MetaTrader. Так что занимайтесь только непосредственно своим делом - пишите программы для автотрейдинга.
Вы упускаете торговые возможности:
- Бесплатные приложения для трейдинга
- 8 000+ сигналов для копирования
- Экономические новости для анализа финансовых рынков
Регистрация
Вход
Если у вас нет учетной записи, зарегистрируйтесь
Для авторизации и пользования сайтом MQL5.com необходимо разрешить использование файлов Сookie.
Пожалуйста, включите в вашем браузере данную настройку, иначе вы не сможете авторизоваться.