Kostenlose Handelsroboter und Indikatoren für den MetaTrader 4 - 13
This automated VOLUME SCALPING INDICATOR can be utilized to manage trades and identify potential areas of support and resistance for both buying and selling. It is designed to identify zones for Sell/Buy trades based on the volume analysis and can be effectively used in conjunction with other indicators, such as order block indicators, and more. Currently designed for MT4, it will later be adapted to function on MT5. We also offer the opportunity to customize the robot according to your trading
FREE

Draconis Expert Working best with GOLD - M30 Require minimal 500$ for 0.01 (AutoLot feature inside) Optimize update monthly. stay in Comment Live trade @ https://t.me/lullfrx
Indicators and Concepts Quantitative Qualitative Estimation (QQE): QQE is an advanced version of the Relative Strength Index (RSI) that includes a volatility filter. It consists of a fast and a slow line, which help in identifying trends and potential reversals. The QQE indicator smooths out the price action and provide
FREE
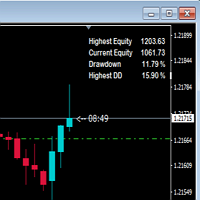
This indicator shows drawdown based on highest equity. Usually drawdown is used to show performance of a trading account especially when someone participate in a trading contest. If drawdown exceed a determined number, the contest account will be disqualified. So, I hope, this indicator will warn us in maintaining the drawdown and the account still be saved.
FREE

Fully Automated And ready just follow the instructions below to see it work right. Enjoy! MINIMUM ACCOUNT SIZE - $500 RECCOMENDED ACCOUNT SIZE - $1000 For EurUSD Trade On 15M Candle For IG broker Another broker it works on is OANDA but I run mine on IG
Comes ready as is all you need to do is make sure the above is correct and then run it on EUR USD (15M)
Goes off of equity in the account
I have worked on this EA on and off and now I think it has enough data and backtesting to give to you al
FREE

The indicator builds a Renko chart in the sub window for the current symbol. The bars are formed from live data and the desired bar size can be set in the inputs tab. Most importantly, because the Renko chart only uses price to construct bars and ignores time, the indicator can be applied to any time frame and same results can be achieved. Recommended usage
As Renko charts are famous for eliminating noise so traders can use this tool to see clear picture of the trend to help their analysis, entr
FREE

This indicator identifies swing highs and swing lows in the price chart by comparing the Highs and lows of each candle to a specified number of candle before and after it. Once it has identified the swing highs and swing lows, it can use them to determine potential support and resistance levels. A support level is formed when the price drops and bounces back up from a swing low, indicating that there is buying pressure at that level. A resistance level is formed when the price rises and reve
FREE
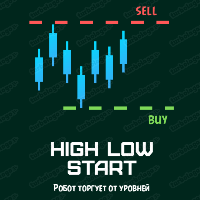
TRADE FROM LEVELS ACCORDING TO YOUR PARAMETERS! This Expert Advisor trades from support and resistance levels. The maximum and Minimum prices are set in the input parameters.
Input parameters: Selecttimeframe - setting the timeframe for the maximum and minimum prices How does it work? It's very simple - if you set a Monthly One, then the robot will trade at Max. and Min. prices that were last month For example, if you trade in the month of June, then the robot will find the maximum and minimum
FREE

This indicator uses the Zigzag indicator to identify swing highs and swing lows in the price chart. Once it has identified the swing highs and swing lows, it can use them to determine potential support and resistance levels. A support level is formed when the price drops and bounces back up from a swing low, indicating that there is buying pressure at that level. A resistance level is formed when the price rises and reverses downward from a swing high, suggesting selling pressure at that leve
FREE
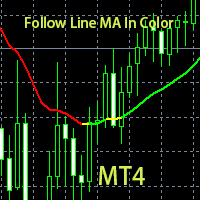
Das ist die eigene indikatoren auf der grundlage der farbe erkennen.
Wenn die farbe grün Lange single.
Wenn farbe IST ROT, Kurz allein.
Wenn die farbe Gelb, sagte zitate zu umkehr, die besten positionen oder die Short - positionen.
Das ist nach einer Langen phase der single folgen Hohe Genauigkeit bei der Hand, geschrieben, dann nach einer farbe Guter indikator indikator für die richtung der beschränkungen, keine Zeit, Geld. Aktuellen index am besten auf 15 minuten, 30 minuten, 1 stunde, 4 s
FREE

Genauigkeitsmesser Einführung:
Das Genauigkeitsmessgerät ist ein leistungsstarkes Tool, mit dem Sie den Gewinn% der Strategien bestimmen können. Um Ihnen alle Trades-Ein- und Ausstiegspunkte wie den Meta-Trader-Strategietester anzuzeigen, können Sie einen einfachen Strategietester als Indikator auf dem Chart haben, ihn an verschiedene Paare und Zeitrahmen anhängen und herausfinden Ihre Strategiegenauigkeit in Prozent, ändern Sie den Stop-Loss und das Risiko, um den Faktor zu belohnen, und sehen
FREE

Expert Advisor Description EA TugOfWar will open both buy and sell positions at different times according to the triggered signal, the most positions and in accordance with the market direction that will win and profit. Profit target per war is 1% to 5%. Warmode normal = Longterm strategy Warmode extreme = Shortterm strategy
Parameter Description StartTrade = Time to start trading / open position EndTrade = Time to end trading / open position WarMode = 1 -> Normal, 2 -> Extreme (lots of tr
FREE

GTAS S-Trend is a momentum indicator that helps to determine trends using combination of MACD, RSI and moving averages. This indicator was created by Bernard Prats Desclaux, proprietary trader and ex-hedge fund manager, founder of E-Winvest.
Description The indicator oscillates between -65 and +65 with a neutral zone between -25 and +25 around a 0 equilibrium line. S-Trend between -25 and +25 indicates congestion zones with a bullish bias between 0 and +25, and a bearish bias between 0 and -25.
FREE

Trend Power Bot is a unique combination between highly efficient breakout detecting algorithm and very effective drawdown compensation money management. The money management could be considered a martingale, but used with low risk, the strategy survives 20+ years trading with acceptable drawdown. The default /safe/ risk is 0.2% (0.02 lots per $10k account equity) and this is extremely safe. However, if you decide to try your luck, you can bump the risk up to 1% (0.1 lot per $10k account equity)
FREE

The indicator looks for buying and selling zones, where a deal can be opened with a minimal stop loss and a better Risk Reward Ratio. The indicator is based on qualitative search of the Double top/Double bottom pattern. This version works only on USDCAD! The full version of the indicator can be purchased here - https://www.mql5.com/en/market/product/29820
Indicator operation principle Looks for local tops/bottoms which can potentially become a Reversal zone It waits for an impulse movement that
FREE

Read more about my products
EA Gap Cather - is a fully automated trading algorithm based on the GAP (price gap) trading strategy. This phenomenon does not occur often, but on some currency pairs, such as AUDNZD, it happens more often than others. The strategy is based on the GAP pullback pattern.
Recommendations:
AUDNZD TF M1 leverage 1:100 or higher minimum deposit 10 USD
Parameters:
MinDistancePoints - minimum height of GAP PercentProfit - percentage of profit relative to GAP level
FREE

Trading Notes is an innovative tool designed for traders to streamline their decision-making process by allowing them to write and display important reminders or short details directly over their trading charts. This essential feature ensures that traders have quick access to their personalized checklist before opening any positions, enhancing their trading efficiency and accuracy. MT5 Version - https://www.mql5.com/en/market/product/120617 Key Features: Five Customizable Input Fields: Trading
FREE

Main: Not martingale, not a grid; Working on all symbols;
Signals: There is a good rational algorithm. Work of two indicators: Stochastic and OsMA (you can set a separate Timeframe for each indicator)
Stop Loss/Take Profit: There is a good money management system (there are several type for trailing stop loss); There is virtual levels of Stop Loss / Take Profit; There is smart lot (percent by risk) or fix lot
Important: EA can work on closed candles, and on current candles; Quickly opti
FREE
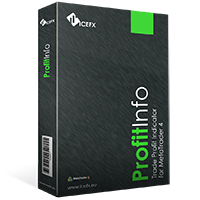
The goal of this indicator is to give you a quick & comprehensive view of your current profit. IceFX’s ProfitInfo is a utility indicator which displays the profit which is calculated from the actual trades on the chart(s). The indicator displays on a daily / weekly / monthly and yearly breakdown and shows the profit in pips / currency and percentage.
Main features: You can easily adjust IceFX’s ProfitInfo to display profit on the current open chart / current trade or even the profit of the enti
FREE

The "Dagangduit EA Auto_SLTP" is an Expert Advisor (EA) developed by the Dagangduit Core Team for MetaTrader 5. This EA is designed to provide automated management of Stop Loss (SL) and Take Profit (TP) levels for your trades, as well as other advanced features to enhance your trading experience. Key Features: Automated SL and TP Management : The EA automatically manages the Stop Loss (SL) and Take Profit (TP) levels of your open positions, allowing you to protect your profits and limit pote
FREE

Expert Advisor = MA Line with Filter Executor = Crossing Candle and Moving Avereage Line Filter = Moving Average, Stochastic, Parabolic SAR
Parameter Information: Lot Mode --> 1 = Fixed Lot, 2 = Freeze%Balance Lot, 3 = Martingale System Position Type --> 1 = Every time there is a signal ea will open a position, 2 = Only one position per trade
you can choose filter some, all or nothing
FREE
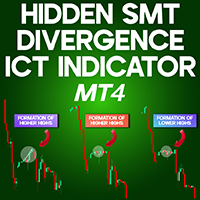
Hidden SMT Divergence Indicator for MT4 The Hidden SMT Divergence Indicator is a powerful analytical tool designed to detect divergences between three different trading instruments. Based on the Smart Money Trading (SMT) concept, this indicator helps traders identify potential price imbalances and liquidity shifts.
By marking divergences directly on the chart, it provides a visual representation of market inefficiencies, enabling traders to better understand institutional trading behavior. Hid
FREE

All traders should know the trend before making their decision when placing the buy or sell orders. The first step always starts with supply and demand , rising and falling channels , trend lines, engulfing candles etc. All the above contribute to what is called “Price Action” and that is the best and most reliable way in trading and catching the trend and making profits, without stress. The Investment Castle Trend Line Indicator will automatically draw the trend lines on the MT4 for you. An
FREE

Current indicator shows the trading sessions for the major financial centres: London New York Tokyo Sydney There are available two types of displaying zones: in sub window below the chart and on the chart. When the subwindow is selected, the sessions are shown in the form of bars. If the sessions are shown on the main chart, they are displayed in the form of lines at the open price of the session that may also act as a support and resistance for further price action during the trading day. The
FREE

RaysFX Supertrend + Alert RaysFX Supertrend è un indicatore di tendenza superiore progettato per i trader che desiderano avere un vantaggio nel mercato. Questo indicatore utilizza una combinazione di CCI (Commodity Channel Index) e ATR (Average True Range) per identificare le tendenze del mercato e fornire segnali di trading accurati. Caratteristiche principali Indicatori CCI e ATR: Utilizza due degli indicatori più popolari e affidabili per identificare le tendenze del mercato e generare segnal
FREE

Highly configurable Macd indicator.
Features: Highly customizable alert functions (at levels, crosses, direction changes via email, push, sound, popup) Multi timeframe ability Color customization (at levels, crosses, direction changes) Linear interpolation and histogram mode options Works on strategy tester in multi timeframe mode (at weekend without ticks also) Adjustable Levels Parameters:
Stochastic RSI Timeframe: You can set the lower/higher timeframes for Stochastic RSI. Stochastic RSI
FREE

The LexusBO indicator is recommended for trading binary options . Signals are generated when the RSI, ADX, CCI indicators cross the customizable levels. The indicator displays signals using "up/down" arrows on the chart. Their values are available in the buffer arrays (buffer with index 0 - "up" arrow, with index 1 - "down" arrow). This makes the indicator easy to use for automated trading through specialized Expert Advisors. The recommended timeframe is M5. The indicator has a built-in counter
FREE

Индикатор рисует уровни Фибоначчи с выделенными Ценовыми метками.При установке индикатора на график необходимо создать трендовую линию с именем указанным в поле" Unique name of trend line to place fib on ". По умолчанию имя=" Unique name of trend line to place fib on" = "+" .В индикаторе можно заменить уровни фибоначчи по своему усмотрению.Также меняются цвет,стиль,толщина линий и т. д.
FREE
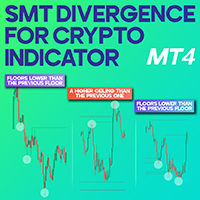
Smart Money Technique Divergence for Crypto Indicator MT4
The Smart Money Technique (SMT) Divergence Indicator for MetaTrader 4 is crafted based on divergence analysis and Smart Money principles. It identifies divergence patterns when three or more correlated financial instruments, including currency pairs, indices, or digital assets, exhibit varying price behaviors. Such discrepancies often indicate shifts in institutional money flow, hinting at potential trend reversals or diminishing momentu
FREE
Forex Trade Manager MT4 simplifies managing open orders in MetaTrader 4. If you open a new order, the manager automatically sets Stop Loss and Take Profit. When price will move, then the program could move Stop Loss to Break Even (stop loss = open price) or continuously moving Stop Loss (Trailing Stop) to protect your profits. Forex Trading Manager is able to control orders for only current symbols (where EA works) or for all opened orders (regardless symbol) and hide the Stop Loss and Take Prof
FREE
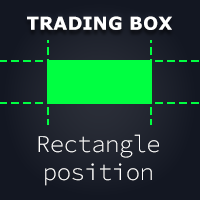
Rectangle position changer tool ( rectangle indicator) is used for precise/accurate rectangle positioning by time or price only. You can move each side of rectangle separately with lines created around selected rectangle. This tool will replace classical grid because it is like dynamical chart grid for rectangle grid. This tool allows you to adjust your rectangles, from all 4 sides, with ease and makes your technical analysis that much faster.
This tool is handy when corner points for changin
FREE

Dieser Indikator findet technische Analysemuster "Double Bottom" und "Double Top", zeigt sie auf dem Chart eines Währungspaares an und kann signalisieren, ob das Muster kürzlich gebildet wurde. Diese Muster sind umkehrbar, oft nach dem Auftreten des Trends kehrt sich der Trend um oder es tritt eine Korrektur ein. Um nicht selbst danach zu suchen, genügt es, den Indikator zum Chart hinzuzufügen, danach können Sie verschiedene Zeitrahmen ändern, um solche Zahlen schnell auf einem der Zeitrahmen zu
FREE

Investment Castle Indicator has the following features: 1. Dictates the direction of the trend in different Timeframes . 2. Shows the hit rate and winning rate on the chart. 3. This indicator does not repaint the chart. 4. This indicator is built-in the Support & Resistance based Investment Castle EA which works with Psychological Key Levels "Support & Resistance" Indicator.
FREE
TimeZone In Chart - Benutzerdefinierte Zeitzonen-Horizontalskala für MT4 Übersicht Wir präsentieren den TimeZone In Chart - Benutzerdefinierte Zeitzonen-Horizontalskala-Indikator für MT4, ein nützliches Tool, das Ihr Handelserlebnis verbessert, indem es die horizontale Zeitskala basierend auf Ihrer bevorzugten Zeitzone anpasst. Perfekt für Trader, die ihre Handelsaktivitäten mit verschiedenen Zeitzonen in Einklang bringen müssen, stellt dieser Indikator sicher, dass Sie keinen wichtigen Moment
FREE

A fully automated Expert Advisor for making permanent profits in the Forex market with minimal risk.
Trading is based on building a channel using moving averages and analyzing the bars for the presence of setups for entry. Please see all my products: https://www.mql5.com/en/users/en_coding/seller
Not used : grids, hedging, and other high-risk trading strategies, such as staying a drawdown by saving losing trades.
Each order is protected by a fixed stop loss. The money management system is bas
FREE

Highly configurable Stochastic indicator.
Features: Highly customizable alert functions (at levels, crosses, direction changes via email, push, sound, popup) Multi timeframe ability Color customization (at levels, crosses, direction changes) Linear interpolation and histogram mode options Works on strategy tester in multi timeframe mode (at weekend without ticks also) Adjustable Levels Parameters:
Stochastic Timeframe: You can set the lower/higher timeframes for Stochastic. Stochastic Bar Sh
FREE

Fractal is one of the main indicators in a number of strategies. Volume Fractals has expanded the functionality of the standard indicator version. The product features fractals sorting and displaying fractals representing both price and volume extreme points.
Application Stop losses Reversal signals Placing pending orders for a fractal breakout
Options Bars of history - number of chart bars the indicator is displayed for Left side minimum bars - minimum number of bars to the left of the fracta
FREE

Currency Strength Matrix (CSM) is an indicator that will show you the current strength of the major currencies in several timeframes, allowing you to sort the currencies for strength and spot possible trading setups. This indicator is ideal for scalping and in all those events of sudden big moves.
How does it work? The CSM compares the value of the current moving average with the same moving average in the previous candle for all the 28 pairs and all 9 timeframes, producing a Matrix of Strength
FREE
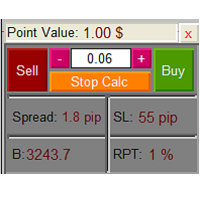
The Lot Calculation FJD is an expert for risk management for Meta Trader 4. This expert calculates the value of lot size for every position based on Trader’s given balance, Risk, and Stop loss. This expert is really user friendly, and calculates lot size with just a few clicks which helps traders specially the scalpers to open a position as quick as possible with respect to the Risk management.
The following inputs can be changed by the user: 1. Percentage of Risk per Trade (RPT %) 2. Balance
FREE

Check my p a id tools they work perfect please r ate Here is an Upgraded version with Bonus Ea in case of purchase it costs 30$ only and you get Ea as Bonus: https://www.mql5.com/en/market/product/96835 This indicator is experimetal, it shows TMA channel arrows with Volatility filter built in to avoid lagging. Try to experiment with it, search for better conditions of use. It is possible to adjust different timeframes for TMA and for Volatility filter Same time on the current chart, so it ma
FREE

USDJPY H1 Check out the Gold version https://www.mql5.com/en/market/product/136716 Erweiterter gleitender Durchschnitt Martingale EA für MT4
Dieser leistungsstarke Expert Advisor kombiniert eine flexible Crossover-Strategie mit gleitendem Durchschnitt mit fortschrittlichen Geld- und Risikomanagement-Tools. Passen Sie Ihre schnellen/langsamen MAs an, aktivieren Sie die Trendfilterung und wählen Sie, ob Sie Trades bei Crossovers eröffnen oder schließen möchten. Unterstützt sowohl feste Charge
FREE
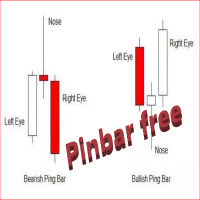
The Free Pin Bar MT4 indicator identifies Pin Bars It will even give you sound or email alerts if want them. If you download it and like it please leave a review! It would be wonderful
Pin Bars are purely based on price action as reflected by the candle formations created by Forex price movements. input Parameters are maximum allowed body/length ratio for the Nose bar. Nose body should be position in top (bottom for bearish pattern) part of the Nose bar. tells the indicator that the Left Ey
FREE

Super Buy Sell is a combination of Hedging and Martingale strategy. Buy and Sell at the same time and open order every 20 pips (default setting) with customized Target Profit. It was backtested and optimized using real ticks with high quality. The Expert Advisor has successfully passed the stress test with slippage approximate to the real market conditions. This EA can run on several instruments simultaneously. This EA is recommended for cent accounts.
Real account monitoring https://www.mql5.
FREE

Vorteile der Verwendung eines EAs mit Management-Buttons
1. Zeiteffizienz
Der EA ermöglicht es den Händlern, mehrere Aktionen (alle Positionen schließen, Verlustpositionen schließen und Gewinnpositionen schließen) mit einem einzigen Klick schnell auszuführen und so wertvolle Zeit zu sparen.
Beispiel: Anstatt jede der 20 Positionen in einer Basket-Strategie manuell zu schließen, kann der Händler alle Positionen gleichzeitig mit dem Button „Alle Positionen schließen“ schließen.
2. Reduzierter emot
FREE

Key Levels + Zones
Indicator cleanly displays even numbered price levels: “00s” and “50s” . Additionally, you can display “Mid-Lines” which are preset distance levels on both sides of the even numbered price levels (set to 12.5 pips by default). This 25-pip zone that straddles each even numbered price relates to where many traders place their stops and therefore can be a risk “Zone” to steer clear of when placing your stops. The zone also acts as support and resistance. Indicator p rovide
FREE

The UZFX - Delete All Drawing and Objects on Chart Instantly is a simple yet powerful MetaTrader 4 (MT4) script designed to instantly remove all drawing objects from the active chart. This script is useful for traders who need to quickly clear their charts from technical analysis drawings, trend lines, Fibonacci tools, text labels, and other objects without manually deleting them one by one. (Visit Profile & Checkout All Other MT4/MT5 Products)
(Please Don't Forget to Give Review)
Features
FREE

Trading with the help of the MACD indicator has become even more convenient. Flexible settings will help you choose what you really need in your trading. Use the strategy that you need - the indicator uses 3 strategies. Download the demo right now! I recommend watching my advisor - Night Zen EA Subscribe to my telegram channel, link in my profile contacts - my profile See also my other products on mql5.com - my products Advantages of the indicator: In this indicator, the interpretation of th
FREE
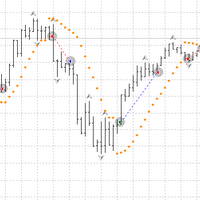
Hello! Robot Lovec Trend MT4. Designed exclusively for working with the trend on the weekly chart W1.
I offer you an Advisor, my own development. The settings are universal for all currency pairs. Most instruments are suitable, especially trending currency pairs with JPY, CHF, GBP. And also futures and indices. Entries are made exclusively at the opening of the candle, which gives the same ideal execution as in the tester and without slippage. Exit from the transaction based on a set of conditi
FREE
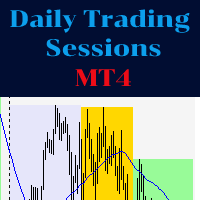
The indicator represents the session boxes for the Asian, European and American sessions. It is possible to change the time of each session, such as color. It is also possible to disable the display of each session. You will find in input parameters variables to modify time sessions in format hh:mm and the color of boxes of each sessions. If you need some implementations please contact me.
FREE
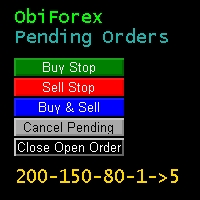
Obiforex - Pending Orders Specialized for trading during news events and at any other time in the market, Obiforex - Pending Orders is a program designed to enhance your trading experience. By utilizing pending orders, you can seize market opportunities with precision and efficiency. Buy Stop: Place a pending purchase order at a higher price ("stop" price) than the current price. The Buy Stop order will be executed if the sale price ("Ask") quoted on the platform is equal to or higher than the o
FREE

Konto-Dashboard-Statistiken
Es handelt sich um ein Tool, das Ihnen dabei hilft, einen fokussierten Überblick über die Gewinne und Verluste Ihres Kontos zu erhalten, damit Sie den Überblick behalten. Außerdem bietet es eine Drawdown-Analyse, um auch das erhaltene Risiko zu ermitteln Nachdem Sie es heruntergeladen und in Ihrem Konto aktiviert haben, müssen Sie es an ein beliebiges Symbol anhängen, zum Beispiel EURUSD H1. Von diesem Moment an beginnt das Tool mit der Überwachung Ihrer Statistiken
FREE

Gold TL MTF - this is a fine stock technical indicator. The indicator algorithm analyzes the movement of the asset price and reflects trend lines along the fractals of a specific timeframe (TF).
Benefits of the indicator: The indicator produces signals with high accuracy. The confirmed signal of the indicator does not disappear and is not redrawn. You can trade on the MetaTrader 4 trading platform of any broker. You can trade any assets (currencies, metals, cryptocurrencies, stocks, indices e
FREE
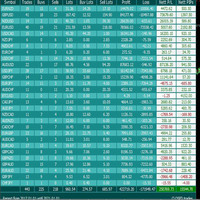
Very good tool for statistics, shows the moment and history, you can observe instant profit, profit - loss in pips, money, etc. I still have a lot of useful indicators for free, if anyone wishes you can write to me. You can keep your records by magic number, also only for a specific hour or year or day. For more information, welcome to our Telegram Group. https://t.me/InfinXx
FREE

The ADX Indicator is known to be used to determine the trend direction. Not only that, but it also has deviation (+DI and -DI) that determine the direction of the trend as well. The role of the indicator is to spot the trend and its direction and generate signals accordingly.
Indicator Settings: - ADX period : default is 14 periods (it works best with the timeframe H1). - Signal Width : the size of signals arrows. - Signal Distance : the distance of the signal arrow from the candle. - Signal co
FREE

Display Order box list from Trading box Order Management tool. Find contacts and manual links on my profile . This dashboard gives you an edge in forex trading because in few seconds you can decide which pair and timeframe is worth to watch more closely. This is how you will not be distracted by all other forex pairs that you trade, and you will not miss great opportunities to trade the best price.
Trading Dashboard (order box overview panel and Trading box Order management extension)
FREE
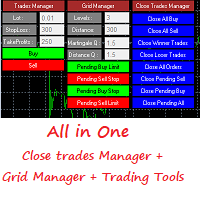
This is a demo version . Download the full version from this link https://www.mql5.com/fr/market/product/84850
Full version Allows you to : Set the number of levels (trades). Lot size and you can do Martingale to raise the lot size for each level. Set distance between levels, and you can manage the distance for each level using Distance Q. Static TP and SL for each level. You can open : BUY STOP / BUY LIMIT / SELL STOP / SELL LIMIT (levels in one click). Close all buy orders. Close all s
FREE

Limited time offer! For the launch of NextBot Scalper EA , the price of this indicator will drop to FREE !
Introducing a pragmatic and innovative tool for MetaTrader 4 (MT4) traders: the Linear Regression Next channel indicator, enhanced with the determination coefficient R 2 . This indicator serves as a foundational tool for traders seeking to understand market trends through the lens of statistical analysis, specifically linear regression.
The essence of this indicator lies in its ability t
FREE

Identify key support and resistance zones, and execute trades strategically when the market exhibits overbought or oversold conditions. This EA, referred to as "Supply Demand Agent," is designed to help traders find suitable entry and exit points in the market based on support and resistance areas, as well as overbought and oversold conditions. Let's break down the key input parameters to explain how the EA operates: Money Management Settings: LotSize : Specifies the initial lot size for trading
FREE

This simple indicator takes information from Ichimoku Kinko Hyo to establish strong and weak currencies to pair together for ideal trending situations. It also generates buy or sell signals based on the standard deviation of returns together with currency strength. A currency is said to be strong or weak depending on where the price is in relation to two factors: if the price is above the daily kumo and above the 26 day Kijun-sen, it is said to be strong. Likewise, when trading below the daily k
FREE

This indicator show candle time remaining. The remaining time of the candle is calculated every 200 milliseconds. 1. You can set x (horizontal), y (vertical) of text. 2. You can set font, color, size of text. 3. You can remove the text without having to remove the indicator from the chart. The remaining time of the candle depends on the timeframe of the chart with the indicator.
FREE
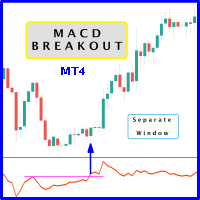
Probability emerges to record higher prices when MACD breaks out oscillator historical resistance level. It's encouraged to confirm price breakout with oscillator breakout since they have comparable effects to price breaking support and resistance levels; certainly, short trades will have the same perception. As advantage, many times oscillator breakout precedes price breakout as early alert to upcoming event as illustrated by second and third screenshot. Furthermore divergence is confirmed in c
FREE
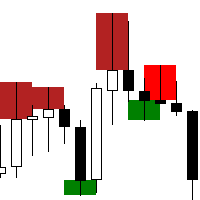
The "Rejection Block" MetaTrader 4 Indicator is a powerful tool designed to assist traders in identifying and visualizing rejection candlestick patterns, commonly referred to as rejection blocks. These patterns play a crucial role in market analysis as they often signify potential reversals or continuations in price movements. Key Features: Rejection Block Detection: The indicator meticulously scans price data to identify instances of rejection candlestick patterns. These patterns typically feat
FREE

Informative & optimized Zigzag, Accumulated volume, Price change A rewrite of the traditional zigzag tool with new additions. Features:- Optimized code Displays accumulated volume between peaks Displays price change between peaks Usage:- Identify trend swings Identify high volume swings Compare price changes between swings Drawing Fibonacci tool on strong price change or high volume swings
FREE

Master Money Maker is a very high yielding Expert Advisor for experienced or professional traders and is not suitable for beginners looking for the miracle.
Master Money Maker represents a sophisticated Expert Advisor tailored for seasoned or professional traders, emphasizing its incompatibility with novice traders seeking quick solutions. Employing a meticulously crafted strategy, MMM operates as a fully automated breakout scalper, meticulously optimized through extensive testing over an ex
FREE

Running accounts 5000$ or more Specialize in XAUUSD pair Lot - Startot . Auto-BUY-SELL - allows to buy or sell. Auto-Grid - ON/OFF AutoLot - ON/OFF TP - Takeprofit -pips. SL - No Stoploss. Magic - Number magic. Capital Mangement - ON/OFF. GridStep - Grid replace for Stoploss = Pips. Comment - KING Profit - $ The tactics we use are always profitable. try it out in the demo account before it goes live Profit from 20-30% per month.
FREE

Arbeitslogik
Das Stop-Out-Dienstprogramm ist ein einfacher, aber sehr praktischer Indikator, der anzeigt, wie viele Punkte bis zum Stop-Out-Level verbleiben /
Sein Vorteil liegt in der Tatsache, dass viele Trader das Risiko beim Handel auf Gewinnstreben bewusst überschätzen, die verfügbare Margin maximal nutzen, und für diesen Fall ist es sehr wichtig zu wissen, wo der Broker Ihre Positionen zwangsweise schließen kann.
Platzieren Sie einfach den Indikator auf dem Chart und abhängig von der o
FREE

This Expert Advisor implements an RSI Mean Reversion strategy with a moving average filter for trade entries. The EA uses higher timeframe RSI conditions to detect potential buy or sell opportunities, confirmed by a lower timeframe moving average. The strategy includes risk management features like limiting the maximum number of open trades, controlling risk based on ADR, and closing trades when a predefined account profit percentage is reached. It also includes visualization tools such as a bre
FREE

The Candlestick Pattern Detector is an advanced MetaTrader 4 indicator designed to identify and highlight candlestick patterns on your charts. Currently, the indicator detects one specific candlestick pattern - the pinbar, known for its significance in technical analysis and trading strategies. This tool provides traders with visual cues, making it easier to spot potential market reversals or continuations. Features: Customizable Colors: Users can customize the colors of the bullish and bearish
FREE
Martingale Scanner: Smart Trade Analysis for Martingale Strategies The Martingale strategy is a high-risk, high-reward approach that requires precise execution and careful risk management. Without the right tools, traders may struggle to analyze market conditions and adjust trade sizes effectively. Martingale Scanner is designed to simplify and optimize this process, providing traders with a structured way to apply the strategy efficiently across different currency pairs. Why Use Martingale Scan
FREE

The Stochastic RSI indicator (StochRSI) is essentially an indicator of an indicator. It is used in technical analysis to provide a stochastic calculation to the RSI indicator. This means that it is a measure of RSI relative to its own high/low range over a user defined period of time. The Stochastic RSI is an oscillator that calculates a value between 0 and 1 which is then plotted as a line. This indicator is primarily used for identifying overbought and oversold conditions.
FREE

GAP DETECTOR
FVG in trading refers to "Fair Value Gap", . It is a concept used in technical analysis to identify areas on a price chart where there is a discrepancy or gap between supply and demand. These gaps can occur due to rapid movements in price, usually as a result of important news or economic events, and are usually filled later as the market stabilizes. The GAP DETECTOR indicator is designed to identify fair value gaps (FVG) on the price chart and filter them using volatility to dete
FREE
Der MetaTrader Market ist die beste Plattform für den Verkauf von Handelsroboter und technischen Indikatoren.
Sie brauchen nur ein gefragtes Programm für die MetaTrader Plattform schreiben und schön gestalten sowie eine Beschreibung hinzufügen. Wir helfen Ihnen, das Produkt im Market Service zu veröffentlichen, wo Millionen von MetaTrader Benutzern es kaufen können. Konzentrieren Sie sich auf dem Wesentlichen - schreiben Sie Programme für Autotrading.
Sie verpassen Handelsmöglichkeiten:
- Freie Handelsapplikationen
- Über 8.000 Signale zum Kopieren
- Wirtschaftsnachrichten für die Lage an den Finanzmärkte
Registrierung
Einloggen
Wenn Sie kein Benutzerkonto haben, registrieren Sie sich
Erlauben Sie die Verwendung von Cookies, um sich auf der Website MQL5.com anzumelden.
Bitte aktivieren Sie die notwendige Einstellung in Ihrem Browser, da Sie sich sonst nicht einloggen können.