Articles with examples of indicators developed in MQL5
The articles contain detailed explanation of the attached codes. Download and open them in MetaEditor and program together with the author while reading the article.
Add a new article

You are missing trading opportunities:
- Free trading apps
- Over 8,000 signals for copying
- Economic news for exploring financial markets
Registration
Log in
You agree to website policy and terms of use
If you do not have an account, please register

Price Action Analysis Toolkit Development (Part 3): Analytics Master — EA
Moving from a simple trading script to a fully functioning Expert Advisor (EA) can significantly enhance your trading experience. Imagine having a system that automatically monitors your charts, performs essential calculations in the background, and provides regular updates every two hours. This EA would be equipped to analyze key metrics that are crucial for making informed trading decisions, ensuring that you have access to the most current information to adjust your strategies effectively.

Calculation of Integral Characteristics of Indicator Emissions
Indicator emissions are a little-studied area of market research. Primarily, this is due to the difficulty of analysis that is caused by the processing of very large arrays of time-varying data. Existing graphical analysis is too resource intensive and has therefore triggered the development of a parsimonious algorithm that uses time series of emissions. This article demonstrates how visual (intuitive image) analysis can be replaced with the study of integral characteristics of emissions. It can be of interest to both traders and developers of automated trading systems.
Graphical interfaces X: New features for the Rendered table (build 9)
Until today, the CTable was the most advanced type of tables among all presented in the library. This table is assembled from edit boxes of the OBJ_EDIT type, and its further development becomes problematic. Therefore, in terms of maximum capabilities, it is better to develop rendered tables of the CCanvasTable type even at the current development stage of the library. Its current version is completely lifeless, but starting from this article, we will try to fix the situation.

Developing a trading Expert Advisor from scratch (Part 12): Times and Trade (I)
Today we will create Times & Trade with fast interpretation to read the order flow. It is the first part in which we will build the system. In the next article, we will complete the system with the missing information. To implement this new functionality, we will need to add several new things to the code of our Expert Advisor.

Timeseries in DoEasy library (part 49): Multi-period multi-symbol multi-buffer standard indicators
In the current article, I will improve the library classes to implement the ability to develop multi-symbol multi-period standard indicators requiring several indicator buffers to display their data.

Price Action Analysis Toolkit Development (Part 1): Chart Projector
This project aims to leverage the MQL5 algorithm to develop a comprehensive set of analysis tools for MetaTrader 5. These tools—ranging from scripts and indicators to AI models and expert advisors—will automate the market analysis process. At times, this development will yield tools capable of performing advanced analyses with no human involvement and forecasting outcomes to appropriate platforms. No opportunity will ever be missed. Join me as we explore the process of building a robust market analysis custom tools' chest. We will begin by developing a simple MQL5 program that I have named, Chart Projector.

Developing a trading Expert Advisor from scratch (Part 15): Accessing data on the web (I)
How to access online data via MetaTrader 5? There are a lot of websites and places on the web, featuring a huge amount information. What you need to know is where to look and how best to use this information.

Mountain or Iceberg charts
How do you like the idea of adding a new chart type to the MetaTrader 5 platform? Some people say it lacks a few things that other platforms offer. But the truth is, MetaTrader 5 is a very practical platform as it allows you to do things that can't be done (or at least can't be done easily) in many other platforms.
Non-linear indicators
In this article, I will make an attempt to consider some ways of building non-linear indicators and their use in trading. There are quite a few indicators in the MetaTrader trading platform that use non-linear approaches.
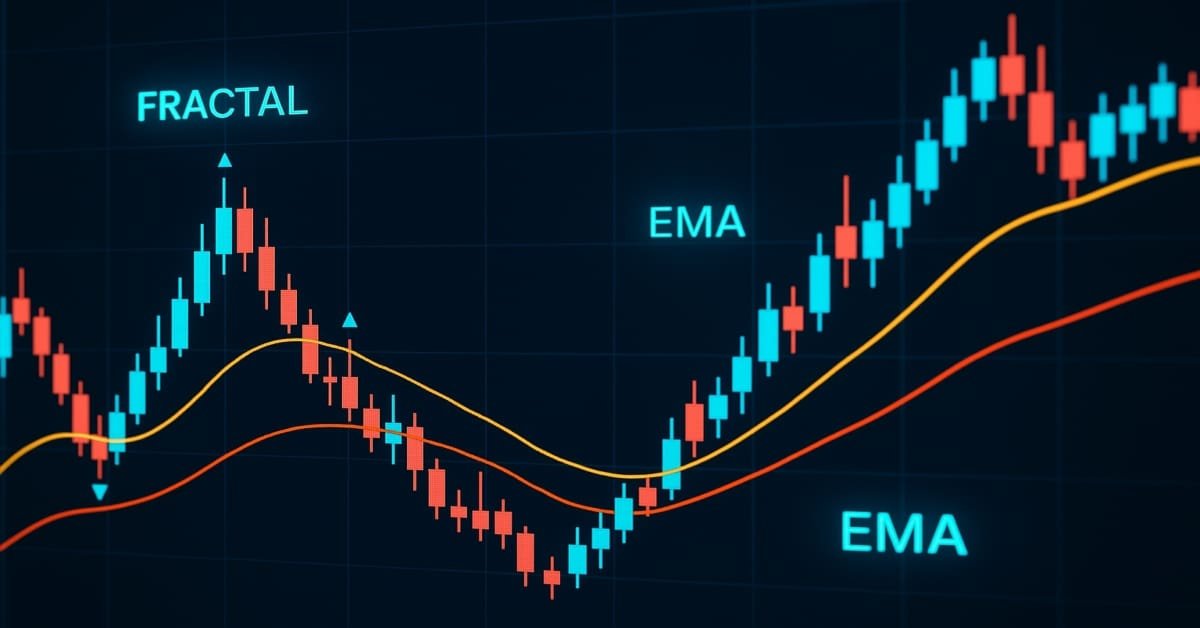
Price Action Analysis Toolkit Development (Part 25): Dual EMA Fractal Breaker
Price action is a fundamental approach for identifying profitable trading setups. However, manually monitoring price movements and patterns can be challenging and time-consuming. To address this, we are developing tools that analyze price action automatically, providing timely signals whenever potential opportunities are detected. This article introduces a robust tool that leverages fractal breakouts alongside EMA 14 and EMA 200 to generate reliable trading signals, helping traders make informed decisions with greater confidence.

Ready-made templates for including indicators to Expert Advisors (Part 3): Trend indicators
In this reference article, we will look at standard indicators from the Trend Indicators category. We will create ready-to-use templates for indicator use in EAs - declaring and setting parameters, indicator initialization and deinitialization, as well as receiving data and signals from indicator buffers in EAs.

Advanced Order Execution Algorithms in MQL5: TWAP, VWAP, and Iceberg Orders
An MQL5 framework that brings institutional-grade execution algorithms (TWAP, VWAP, Iceberg) to retail traders through a unified execution manager and performance analyzer for smoother, more precise order slicing and analytics.

Price Action Analysis Toolkit Development (Part 6): Mean Reversion Signal Reaper
While some concepts may seem straightforward at first glance, bringing them to life in practice can be quite challenging. In the article below, we'll take you on a journey through our innovative approach to automating an Expert Advisor (EA) that skillfully analyzes the market using a mean reversion strategy. Join us as we unravel the intricacies of this exciting automation process.

Developing a trading Expert Advisor from scratch (Part 10): Accessing custom indicators
How to access custom indicators directly in an Expert Advisor? A trading EA can be truly useful only if it can use custom indicators; otherwise, it is just a set of codes and instructions.

Creating multi-symbol, multi-period indicators
In this article, we will look at the principles of creating multi-symbol, multi-period indicators. We will also see how to access the data of such indicators from Expert Advisors and other indicators. We will consider the main features of using multi-indicators in Expert Advisors and indicators and will see how to plot them through custom indicator buffers.
Multiple indicators on one chart (Part 02): First experiments
In the previous article "Multiple indicators on one chart" I presented the concept and the basics of how to use multiple indicators on one chart. In this article, I will provide the source code and will explain it in detail.
Creating a ticker tape panel: Basic version
Here I will show how to create screens with price tickers which are usually used to display quotes on the exchange. I will do it by only using MQL5, without using complex external programming.

Timeseries in DoEasy library (part 54): Descendant classes of abstract base indicator
The article considers creation of classes of descendant objects of base abstract indicator. Such objects will provide access to features of creating indicator EAs, collecting and getting data value statistics of various indicators and prices. Also, create indicator object collection from which getting access to properties and data of each indicator created in the program will be possible.

Developing a trading Expert Advisor from scratch (Part 9): A conceptual leap (II)
In this article, we will place Chart Trade in a floating window. In the previous part, we created a basic system which enables the use of templates within a floating window.
Timeseries in DoEasy library (part 48): Multi-period multi-symbol indicators on one buffer in a subwindow
The article considers an example of creating multi-symbol multi-period standard indicators using a single indicator buffer for construction and working in the indicator subwindow. I am going to prepare the library classes for working with standard indicators working in the program main window and having more than one buffer for displaying their data.

ALGLIB numerical analysis library in MQL5
The article takes a quick look at the ALGLIB 3.19 numerical analysis library, its applications and new algorithms that can improve the efficiency of financial data analysis.

Developing a trading Expert Advisor from scratch (Part 13): Time and Trade (II)
Today we will construct the second part of the Times & Trade system for market analysis. In the previous article "Times & Trade (I)" we discussed an alternative chart organization system, which would allow having an indicator for the quickest possible interpretation of deals executed in the market.
Canvas based indicators: Filling channels with transparency
In this article I'll introduce a method for creating custom indicators whose drawings are made using the class CCanvas from standard library and see charts properties for coordinates conversion. I'll approach specially indicators which need to fill the area between two lines using transparency.

Multiple indicators on one chart (Part 03): Developing definitions for users
Today we will update the functionality of the indicator system for the first time. In the previous article within the "Multiple indicators on one chart" we considered the basic code which allows using more than one indicator in a chart subwindow. But what was presented was just the starting base of a much larger system.

Master MQL5 from beginner to pro (Part II): Basic data types and use of variable
This is a continuation of the series for beginners. In this article, we'll look at how to create constants and variables, write dates, colors, and other useful data. We will learn how to create enumerations like days of the week or line styles (solid, dotted, etc.). Variables and expressions are the basis of programming. They are definitely present in 99% of programs, so understanding them is critical. Therefore, if you are new to programming, this article can be very useful for you. Required programming knowledge level: very basic, within the limits of my previous article (see the link at the beginning).

Ready-made templates for including indicators to Expert Advisors (Part 2): Volume and Bill Williams indicators
In this article, we will look at standard indicators of the Volume and Bill Williams' indicators category. We will create ready-to-use templates for indicator use in EAs - declaring and setting parameters, indicator initialization and deinitialization, as well as receiving data and signals from indicator buffers in EAs.
Timeseries in DoEasy library (part 47): Multi-period multi-symbol standard indicators
In this article, I will start developing the methods of working with standard indicators, which will ultimately allow creating multi-symbol multi-period standard indicators based on library classes. Besides, I will add the "Skipped bars" event to the timeseries classes and eliminate excessive load from the main program code by moving the library preparation functions to CEngine class.

Introduction to MQL5 (Part 12): A Beginner's Guide to Building Custom Indicators
Learn how to build a custom indicator in MQL5. With a project-based approach. This beginner-friendly guide covers indicator buffers, properties, and trend visualization, allowing you to learn step-by-step.
Timeseries in DoEasy library (part 53): Abstract base indicator class
The article considers creation of an abstract indicator which further will be used as the base class to create objects of library’s standard and custom indicators.

Creating a ticker tape panel: Improved version
How do you like the idea of reviving the basic version of our ticker tape panel? The first thing we will do is change the panel to be able to add an image, such as an asset logo or some other image, so that the user could quickly and easily identify the displayed symbol.

Developing a trading Expert Advisor from scratch (Part 14): Adding Volume At Price (II)
Today we will add some more resources to our EA. This interesting article can provide some new ideas and methods of presenting information. At the same time, it can assist in fixing minor flaws in your projects.

How to build and optimize a volatility-based trading system (Chaikin Volatility - CHV)
In this article, we will provide another volatility-based indicator named Chaikin Volatility. We will understand how to build a custom indicator after identifying how it can be used and constructed. We will share some simple strategies that can be used and then test them to understand which one can be better.
Price Action Analysis Toolkit Development (Part 19): ZigZag Analyzer
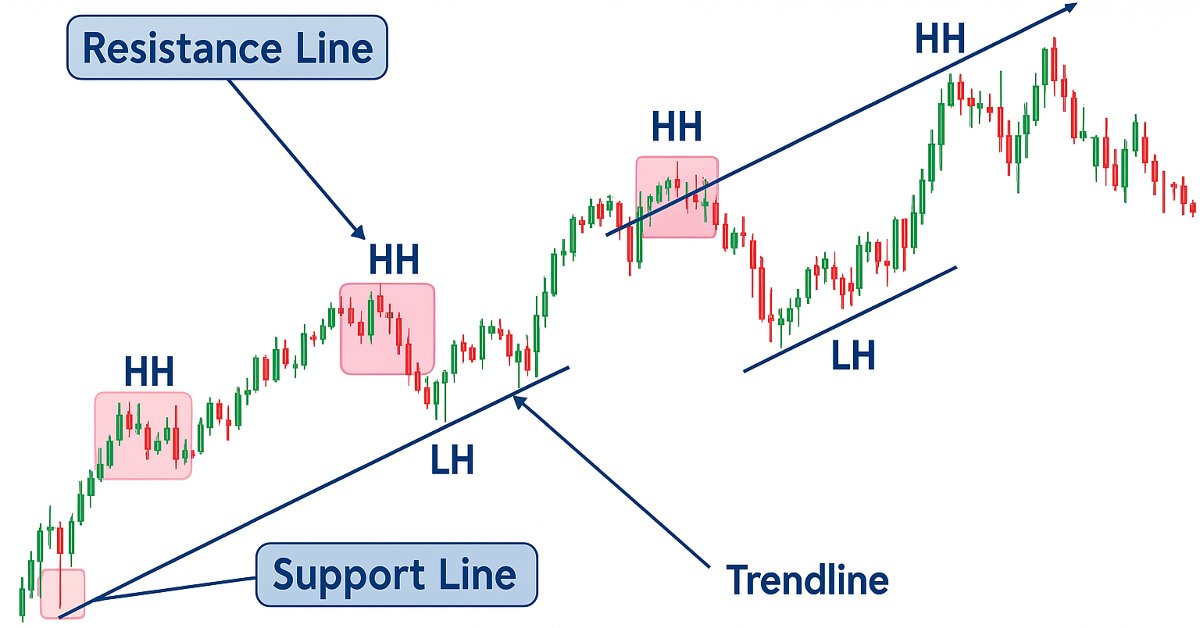
Every price action trader manually uses trendlines to confirm trends and spot potential turning or continuation levels. In this series on developing a price action analysis toolkit, we introduce a tool focused on drawing slanted trendlines for easy market analysis. This tool simplifies the process for traders by clearly outlining key trends and levels essential for effective price action evaluation.

Introduction to MQL5 (Part 4): Mastering Structures, Classes, and Time Functions
Unlock the secrets of MQL5 programming in our latest article! Delve into the essentials of structures, classes, and time functions, empowering your coding journey. Whether you're a beginner or an experienced developer, our guide simplifies complex concepts, providing valuable insights for mastering MQL5. Elevate your programming skills and stay ahead in the world of algorithmic trading!

Implementing the Janus factor in MQL5
Gary Anderson developed a method of market analysis based on a theory he dubbed the Janus Factor. The theory describes a set of indicators that can be used to reveal trends and assess market risk. In this article we will implement these tools in mql5.

Timeseries in DoEasy library (part 52): Cross-platform nature of multi-period multi-symbol single-buffer standard indicators
In the article, consider creation of multi-symbol multi-period standard indicator Accumulation/Distribution. Slightly improve library classes with respect to indicators so that, the programs developed for outdated platform MetaTrader 4 based on this library could work normally when switching over to MetaTrader 5.

Cycles and Forex
Cycles are of great importance in our lives. Day and night, seasons, days of the week and many other cycles of different nature are present in the life of any person. In this article, we will consider cycles in financial markets.

From Novice to Expert: Support and Resistance Strength Indicator (SRSI)
In this article, we will share insights on how to leverage MQL5 programming to pinpoint market levels—differentiating between weaker and strongest price levels. We will fully develop a working, Support and Resistance Strength Indicator (SRSI).

Price Action Analysis Toolkit Development (Part 27): Liquidity Sweep With MA Filter Tool
Understanding the subtle dynamics behind price movements can give you a critical edge. One such phenomenon is the liquidity sweep, a deliberate strategy that large traders, especially institutions, use to push prices through key support or resistance levels. These levels often coincide with clusters of retail stop-loss orders, creating pockets of liquidity that big players can exploit to enter or exit sizeable positions with minimal slippage.

Introduction to MQL5 (Part 3): Mastering the Core Elements of MQL5
Explore the fundamentals of MQL5 programming in this beginner-friendly article, where we demystify arrays, custom functions, preprocessors, and event handling, all explained with clarity making every line of code accessible. Join us in unlocking the power of MQL5 with a unique approach that ensures understanding at every step. This article sets the foundation for mastering MQL5, emphasizing the explanation of each line of code, and providing a distinct and enriching learning experience.