
How to build and optimize a volatility-based trading system (Chaikin Volatility - CHV)
Introduction
In the realm of trading, the volatility factor is very important as it is known and there are many tools that can be used to measure this factor then according to what we measure we can make trading decisions that can be better if we consider the volatility as part of our trading system.
In this article, we're going to look at one of these volatility technical indicators called the Chaikin Volatility (CHV). Throughout the article, you'll learn what is important about the Chaikin Volatility, what it means, how we can calculate it, and how we can use it in our favor to get better trading results. We will use the indicator based on simple trading strategies (CHV Crossover and CHV and MA Crossover).
Our approach is to understand how we can consider the Chaikin Volatility Indicator as a volatility tool to get better trading results that can be reliable in terms of volatility measurement to be a part of our trading system. So we will learn how to create trading systems based on volatility-based strategies and we will give an example of how to optimize our trading system by adding simple tactics or combining other tools to get better results compared to what we can get without this optimization. We will also learn how to create our own CHV indicator to be used as part of our trading system.
As you know, it is very important for any trading system to be tested in different environments before using it for real trading to make sure that it will be useful and suitable for your trading as there is no strategy that suits everyone. So we are going to make some simple tests for our trading system based on these two trading strategies mentioned and I encourage you to do your testing using different aspects than I have used in this article to see how it can improve your system to get better results than I got or even find that this tool is not suitable or applicable for your trading system at all.
We'll cover all of this in the following topics:
- Chaikin volatility: to understand the most important knowledge about this technical tool.
- Custom Chaikin volatility indicator: to learn how we can code our custom indicator to change or apply our preferences regarding the indicator.
- Chaikin volatility trading strategies: to identify simple trading strategies that we'll use in our trading system.
- Chaikin volatility trading system: to build and test a simple trading system to be used as part of our trading system.
- Conclusion
It's also important to know that if you're learning to code for trading or programming in general, it's very important to practice and write code yourself. So I encourage you to code what you learn as this can improve your programming skills and knowledge.
Chaikin Volatility
In this part, we will identify the Chaikin Volatility Indicator in detail. The Chaikin Volatility was created by Marc Chaikin who created many technical indicators that bear his name. The CHV is used to measure the volatility in the movement of financial markets and can be helpful in anticipating potential market reversals. It can be useful in determining the range of value between high and low prices over a period of time to measure potential movements or market swings in either direction. The CHV does not take gaps into account in the same way as we will see when calculating it. It is very important to note that increasing volatility can mean high risk or high return and vice versa.
The CHV indicator can record high or low values, the rising values mean that prices are changing very fast, but low values mean that prices are constant and there is not much volatility in the underlying asset. What I think is very important to mention is that volatility can be recorded in trending or non-trending markets, not only in trending markets, as we are measuring volatility and not the trend or direction of prices. When using other technical tools that can be used as a confirmation on the generated it will give better results and this is what we will do as mentioned as we will try to take our decisions accompanied with the moving average technical indicator to give the direction of the market and take trending trades as much as possible.
As we have mentioned, we can use the CHV indicator to predict market reversals, as sometimes when the indicator records relatively high values, this can be used to predict reversals and potential tops or bottoms in the market. Now we need to understand how the CHV indicator is calculated to deepen our awareness of the main concept behind the indicator.
H-L (i) = HIGH (i) - LOW (i)
H-L (i - 10) = HIGH (i - 10) - LOW (i - 10)
CHV = (EMA (H-L (i), 10) - EMA (H-L (i - 10), 10)) / EMA (H-L (i - 10), 10) * 100
Where:
- HIGH (i) - refers to the maximum price of the current candlestick.
- LOW (i) - refers to the minimum price of the current candlestick.
- HIGH (i - 10) - refers to the maximum price of the candlestick from the current one to ten positions away.
- LOW (i - 10) - refers to the minimum price of the candlestick starting from the current one - ten positions away.
- H-L (i) - refers to the difference between the maximum and minimum price of the current candlestick.
- H-L (i - 10) - refers to the difference between the maximum and minimum prices ten candles ago.
- EMA - refers to the exponential moving average.
Custom Chaikin Volatility indicator
In this section, we will learn how to code a custom Chaikin Volatility indicator using MQL5, which can be useful as we can customize the indicator to suit our objectives. The following are the steps to code our custom Chaikin Volatility (CHV) indicator:
Use the preprocessor #include to be able to use the moving averages include file in the program and calculation.
#include <MovingAverages.mqh> Using the preprocessor #property to specify additional parameters that are the same as the following identifier values:
- description: to set a brief text for the mql5 program.
- indicator_separate_window: to set the place of the indicator in a separate window.
- indicator_buffers: to set the number of buffers for the indicator calculation.
- indicator_plots: to set the number of graphic series in the indicator.
- indicator_type1: to specify the type of graphical plotting, specified by the values of ENUM_DRAW_TYPE. N is the number of graphic series; numbers can start from 1.
- indicator_color1: to specify the color for displaying line N, N is the number of graphic series; numbers can start from 1.
- indicator_width1: to specify the line thickness of the indicator, N is the number of graphic series; numbers can start from 1.
#property description "Chaikin Volatility"
#property indicator_separate_window
#property indicator_buffers 3

#property indicator_plots   1
#property indicator_type1   DRAW_HISTOGRAM
#property indicator_color1  MediumBlue
#property indicator_width1  3
Using the enum keyword to define a set of data for moving average smoothing mode:
enum smoothMode
  {
   SMA=0,// Simple MA
   EMA=1 // Exponential MA
  };
Setting inputs for the indicator settings by using the input keyword:
input int          smoothPeriodInp=10;  // Smoothing Period
input int          chvPeriodInp=10;     // Chaikin Volatility Period
input smoothMode   InpSmoothType=EMA;   // Smoothing Mode
Declaring three arrays of chv, hl, and shl buffers:
double             chvBuffer[];
double             hlBuffer[];
double             shlBuffer[];
Declaring two global variables for the smoothing period and CHV period:
int smoothPeriod,chvPeriod; In the OnInit() part, we will check and specify variables of inputs.
Moving Average name: After declaring the maName, the program checks if the input is SMA, in which case the name will be SMA (simple moving average), or if the input is EMA, in which case the name will be EMA (exponential moving average).
   string maName;
   if(InpSmoothType==SMA)
      maName="SMA";
   else
      maName="EMA";
Smoothing period: The program will check the smoothing period, if it is less than or equal to zero, the value will be specified with a default value of 10 and a message will be printed. If the value is different, i.e. greater than 10, it is given as entered.
   if(smoothPeriodInp<=0)
     {
      smoothPeriod=10;
      printf("Incorrect value for Smoothing Period input = %d. Default value = %d.",smoothPeriodInp,smoothPeriod);
     }
   else smoothPeriod=smoothPeriodInp;
CHV period: The program will check if the CHV period is less than or equal to zero, the value will be set to 10 by default and a message will be printed. If it is different, i.e. greater than 10, it will be given as entered.
   if(chvPeriodInp<=0)
     {
      chvPeriod=10;
      printf("Incorrect value for Chaikin Volatility Period input = %d. Default value = %d.",chvPeriodInp,chvPeriod);
     }
   else chvPeriod=chvPeriodInp;
Defines declared buffers by using the SetIndexBuffer keyword to return a bool value. Its parameters are:
- index: number of the indicator's buffer, it starts from zero and is less than the value of the #property of indicator_buffers identifier.
- buffer[]: to specify the array declared in the custom indicator.
- data_type: to specify what is being stored. The default is INDICATOR_DATA for chvBuffer and we will specify INDICATOR_CALCULATIONS to be used in the intermediate calculation, not the drawing.
   SetIndexBuffer(0,chvBuffer);
   SetIndexBuffer(1,hlBuffer,INDICATOR_CALCULATIONS);
   SetIndexBuffer(2,shlBuffer,INDICATOR_CALCULATIONS);
Specifying the drawing setting:
   PlotIndexSetInteger(0,PLOT_DRAW_BEGIN,smoothPeriod+chvPeriod-1);
   PlotIndexSetString(0,PLOT_LABEL,"CHV("+string(smoothPeriod)+","+maName+")");
   IndicatorSetString(INDICATOR_SHORTNAME,"Chaikin Volatility("+string(smoothPeriod)+","+maName+")");
   IndicatorSetInteger(INDICATOR_DIGITS,1);
In the OnCalculate part, we are going to declare three integer variables as follows:
int i,pos,posCHV; Defining the posCHV variable to be the same as the result of 2 - chvPeriod and smoothPeriod:
posCHV=chvPeriod+smoothPeriod-2; To check if rateTotal is less than the value of posCHV, we need a return value of zero:
   if(rates_total<posCHV)
      return(0);
Define the value of pos after checking if prev_calculated is less than 1, the value of pos will be zero or if the condition is not true, pos will be the result of prev_calculated -1.
   if(prev_calculated<1)
      pos=0;
   else pos=prev_calculated-1;
Defining the hlBuffer[i]
   for(i=pos;i<rates_total && !IsStopped();i++)
     {
      hlBuffer[i]=High[i]-Low[i];
     }
Defining the smoothedhl (shl) buffer:
   if(pos<smoothPeriod-1)
     {
      pos=smoothPeriod-1;
      for(i=0;i<pos;i++)
        {
         shlBuffer[i]=0.0;
        }
     }
Defining MAs simple and exponential by using functions SimpleMAOnBuffer and ExponentialMAOnBuffer:
   if(InpSmoothType==SMA)
     {
      SimpleMAOnBuffer(rates_total,prev_calculated,0,smoothPeriod,hlBuffer,shlBuffer);
     }
   else
      ExponentialMAOnBuffer(rates_total,prev_calculated,0,smoothPeriod,hlBuffer,shlBuffer);
Updating the pos after checking if the pos is less than the posCHV:
   if(pos<posCHV)
     {
      pos=posCHV;
     }
Defining the CHV buffer:
   for(i=pos;i<rates_total && !IsStopped();i++)
     {
      if(shlBuffer[i-chvPeriod]!=0.0)
         chvBuffer[i]=100.0*(shlBuffer[i]-shlBuffer[i-chvPeriod])/shlBuffer[i-chvPeriod];
      else
         chvBuffer[i]=0.0;
     }
Returning the rates_total:
return(rates_total); So, the following is the full code in one block:
//+------------------------------------------------------------------+
//|                                           Chaikin Volatility.mq5 |
//+------------------------------------------------------------------+
#include <MovingAverages.mqh>
#property description "Chaikin Volatility"
#property indicator_separate_window
#property indicator_buffers 3
#property indicator_plots   1
#property indicator_type1   DRAW_HISTOGRAM
#property indicator_color1  MediumBlue
#property indicator_width1  3
enum smoothMode
  {
   SMA=0,// Simple MA
   EMA=1 // Exponential MA
  };
input int          smoothPeriodInp=10;  // Smoothing Period
input int          chvPeriodInp=10;     // Chaikin Volatility Period
input smoothMode InpSmoothType=EMA;   // Smoothing Mode
double             chvBuffer[];
double             hlBuffer[];
double             shlBuffer[];
int                smoothPeriod,chvPeriod;
void OnInit()
  {
   string maName;
   if(InpSmoothType==SMA)
      maName="SMA";
   else
      maName="EMA";
   if(smoothPeriodInp<=0)
     {
      smoothPeriod=10;
      printf("Incorrect value for Smoothing Period input = %d. Default value = %d.",smoothPeriodInp,smoothPeriod);
     }
   else
      smoothPeriod=smoothPeriodInp;
   if(chvPeriodInp<=0)
     {
      chvPeriod=10;
      printf("Incorrect value for Chaikin Volatility Period input = %d. Default value = %d.",chvPeriodInp,chvPeriod);
     }
   else
      chvPeriod=chvPeriodInp;
   SetIndexBuffer(0,chvBuffer);
   SetIndexBuffer(1,hlBuffer,INDICATOR_CALCULATIONS);
   SetIndexBuffer(2,shlBuffer,INDICATOR_CALCULATIONS);
   PlotIndexSetInteger(0,PLOT_DRAW_BEGIN,smoothPeriod+chvPeriod-1);
   PlotIndexSetString(0,PLOT_LABEL,"CHV("+string(smoothPeriod)+","+maName+")");
   IndicatorSetString(INDICATOR_SHORTNAME,"Chaikin Volatility("+string(smoothPeriod)+","+maName+")");
   IndicatorSetInteger(INDICATOR_DIGITS,1);
  }
int OnCalculate(const int rates_total,
                const int prev_calculated,
                const datetime &Time[],
                const double &Open[],
                const double &High[],
                const double &Low[],
                const double &Close[],
                const long &TickVolume[],
                const long &Volume[],
                const int &Spread[])
  {
   int    i,pos,posCHV;
   posCHV=chvPeriod+smoothPeriod-2;
   if(rates_total<posCHV)
      return(0);
   if(prev_calculated<1)
      pos=0;
   else
      pos=prev_calculated-1;
   for(i=pos;i<rates_total && !IsStopped();i++)
     {
      hlBuffer[i]=High[i]-Low[i];
     }
   if(pos<smoothPeriod-1)
     {
      pos=smoothPeriod-1;
      for(i=0;i<pos;i++)
        {
         shlBuffer[i]=0.0;
        }
     }
   if(InpSmoothType==SMA)
     {
      SimpleMAOnBuffer(rates_total,prev_calculated,0,smoothPeriod,hlBuffer,shlBuffer);
     }
   else
      ExponentialMAOnBuffer(rates_total,prev_calculated,0,smoothPeriod,hlBuffer,shlBuffer);
   if(pos<posCHV)
     {
      pos=posCHV;
     }
   for(i=pos;i<rates_total && !IsStopped();i++)
     {
      if(shlBuffer[i-chvPeriod]!=0.0)
         chvBuffer[i]=100.0*(shlBuffer[i]-shlBuffer[i-chvPeriod])/shlBuffer[i-chvPeriod];
      else
         chvBuffer[i]=0.0;
     }
   return(rates_total);
  }
After compiling this code, we will be able to find the same indicator as in the following graph, if we attach it to the chart:
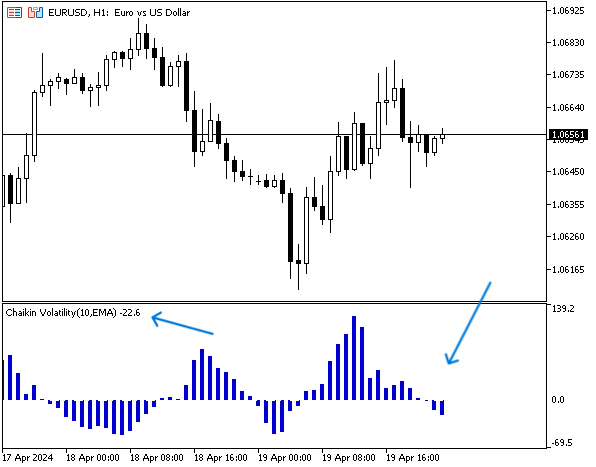
As we can see in the previous graph, the indicator in the lower window of the chart is shown as a histogram, oscillating or recording values above and below zero.
Chaikin volatility trading strategies
In this part, we will see how we can use the Chaikin Volatility indicator in our favor and this can be a part of our trading system to consider the volatility when trading. We will use only the CHV and make trading decisions based on the value of the indicator, then we will test this to see if the results can be profitable or not.
We will use another strategy and we will combine another indicator to filter decisions based on the moving average direction as an optimization for the strategy to see if it is profitable or better than using CHV only or not based on testing this strategy.
Below are these strategies:
CHV crossover:
This strategy can generate buy and sell signals and place orders automatically. When the value of CHV is above zero, the EA will place a buy position. If the value of CHV is below zero, the EA will place a sell position.
Simply,
CHV value > 0 => buy position
CHV value < 0 => sell position
CHV and MA crossover:
The strategy will generate signals and place buy and sell positions based on the crossover between the CHV value and the zero level, taking into account the direction of the moving average. If the CHV is above zero and the moving average is below the closing price, a buy position will be generated and placed. On the other hand, if the CHV is below zero and the moving average is above the closing price, a sell position will be generated and placed.
Simply,
CHV > 0 and closing price > MA => buy position
CHV < 0 and closing price < MA => sell position
Chaikin volatility trading system
In this part, we will create a trading system with MQL5 based on the mentioned strategies and we will test each one to see how we can optimize the strategy to get better results. First, we will create a simple EA to be a base for our trading systems of the two strategies and this EA will show the CHV values as a comment on the chart, the following are the steps to do that:
Declare the inputs of the trading system based on the indicator:
enum SmoothMethod
  {
   SMA=0,// Simple MA
   EMA=1 // Exponential MA
  };
input int          InpSmoothPeriod=10;  // Smoothing period
input int          InpCHVPeriod=10;     // Chaikin Volatility period
input SmoothMethod InpSmoothType=EMA;   // Smoothing method
Declare an integer variable for the chv:
int chv; In the OnInit() part of the EA, we will define the chv variable to be equal to the iCustom function to return the handle of the CHV indicator. Parameters of iCustom are:
- symbol: to specify the symbol name, we will use the (_Symbol) to be applied to the current symbol.
- period: to specify the period, we will use the PERIOD_CURRENT to be applied to the current period.
- name: to specify the name of the indicator
- Specification of the list of inputs (smoothPeriodInp,chvPeriodInp and smoothTypeInp)
chv = iCustom(_Symbol,PERIOD_CURRENT,"Custom_CHV",smoothPeriodInp,chvPeriodInp, smoothTypeInp);
In the OnDeinit() part, we will print the message when the EA is removed:
Print("EA is removed");
In the OnTick() part, declaring the chvInd array:
double chvInd[]; Getting the specified buffer data of the CHV indicator by using the CopyBuffer keyword. Its parameters are:
- indicator_handle: to specify the indicator handle which is the chv
- buffer_num: to specify the indicator buffer number which will be 0
- start_pos: to specify the start position which will be 0
- count: to specify the amount to copy which will be 3
- buffer[]: to specify the target array to copy which will be chvInd
CopyBuffer(chv,0,0,3,chvInd);
Setting the AS_SERIES flag to the selected array by using the ArraySetAsSeries keyword and its parameters are:
- array[]: to specify the array by reference which will be chvInd
- flag: set as true which denotes the reverse order of indexing
ArraySetAsSeries(chvInd,true);
Declare and define the chvVal to return the current value of the indicator:
double chvVal = NormalizeDouble(chvInd[0], 1);
Comment the current value on the chart:
Comment("CHV value = ",chvVal);
So, we can see the full code in one block the same as the following:
//+------------------------------------------------------------------+
//|                                                       chvVal.mq5 |
//+------------------------------------------------------------------+
enum SmoothMethod
  {
   SMA=0,// Simple MA
   EMA=1 // Exponential MA
  };
input int          smoothPeriodInp=10;  // Smoothing period
input int          chvPeriodInp=10;     // Chaikin Volatility period
input SmoothMethod smoothTypeInp=EMA;   // Smoothing method
int chv;
int OnInit()
  {
   chv = iCustom(_Symbol,PERIOD_CURRENT,"Custom_CHV",smoothPeriodInp,chvPeriodInp, smoothTypeInp);
   return(INIT_SUCCEEDED);
  }
void OnDeinit(const int reason)
  {
   Print("EA is removed");
  }
void OnTick()
  {
    double chvInd[];
    CopyBuffer(chv,0,0,3,chvInd);
    ArraySetAsSeries(chvInd,true);
    double chvVal = NormalizeDouble(chvInd[0], 1);
    Comment("CHV value = ",chvVal);
  }
//+------------------------------------------------------------------+
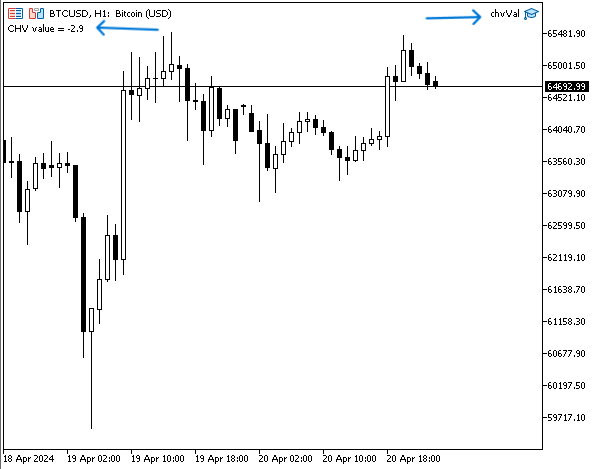
After compiling this code, we can find the value of the current value as shown in the following graph:
We can make sure that the value printed on the chart is correct by inserting the indicator into the same chart to see if there is a difference between the two values or not. So, the following chart shows this to make sure that everything is correct before we move forward in creating our trading system:
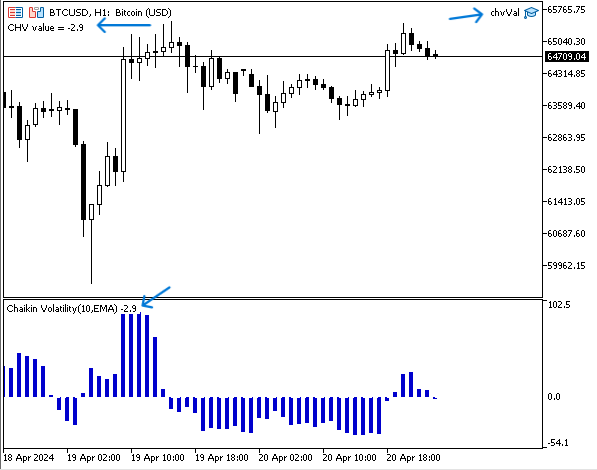
As we can see, the printed value of the current CHV is the same as the value of the attached indicator. Now let's create our trading system for the first strategy (CHV Crossover).
CHV crossover:
According to the strategy of the CHV crossover strategy, the following is the full code for it:
//+------------------------------------------------------------------+
//|                                                 chvCrossover.mq5 |
//+------------------------------------------------------------------+
#include <trade/trade.mqh>
enum smoothMode
  {
   SMA=0,// Simple MA
   EMA=1 // Exponential MA
  };
input int          smoothPeriodInp=10;  // Smoothing period
input int          chvPeriodInp=10;     // Chaikin Volatility period
input smoothMode   smoothTypeInp=EMA;   // Smoothing Mode
input double       lotSize=1;
input double slPips = 300;
input double tpPips = 600;

int chv;
int barsTotal;
CTrade trade;
int OnInit()
  {
   barsTotal=iBars(_Symbol,PERIOD_CURRENT);
   chv = iCustom(_Symbol,PERIOD_CURRENT,"Custom_CHV",smoothPeriodInp,chvPeriodInp, smoothTypeInp, lotSize, slPips, tpPips);
   return(INIT_SUCCEEDED);
  }
void OnDeinit(const int reason)
  {
   Print("EA is removed");
  }
void OnTick()
  {
   int bars=iBars(_Symbol,PERIOD_CURRENT);
   if(barsTotal < bars)
     {
      barsTotal=bars;
      double chvInd[];
      CopyBuffer(chv,0,0,3,chvInd);
      ArraySetAsSeries(chvInd,true);
      double chvVal = NormalizeDouble(chvInd[0], 1);
      double chvValPrev = NormalizeDouble(chvInd[1], 1);
      if(chvVal>0)
        {
         double ask = SymbolInfoDouble(_Symbol,SYMBOL_ASK);
         double slVal = ask - slPips*_Point;
         double tpVal = ask + tpPips*_Point;
         trade.Buy(lotSize,_Symbol,ask,slVal,tpVal);
        }
      if(chvVal<0)
        {
         double bid = SymbolInfoDouble(_Symbol,SYMBOL_BID);
         double slVal = bid + slPips*_Point;
         double tpVal = bid - tpPips*_Point;
         trade.Sell(lotSize,_Symbol,bid,slVal,tpVal);
        }
     }
  }
//+------------------------------------------------------------------+
The differences in this code are as follows:
Include the trade file for trade functions.
#include <trade/trade.mqh> Declaring inputs for the lotSize, the slPips, and the tpPips to be editable by the user.
input double      lotSize=1;
input double slPips = 300;
input double tpPips = 600;
Declaration of an integer variable of barsTotal to be used as a code for each new bar.
int barsTotal; Declaration of the object of the trade.
CTrade trade;
In the OnInit() part, we will have the definition of the variable barsTotal.
barsTotal=iBars(_Symbol,PERIOD_CURRENT);
Adding the three inputs of the lotSize, the slPips, and the tpPips to the iCustom keyword.
chv = iCustom(_Symbol,PERIOD_CURRENT,"Custom_CHV",smoothPeriodInp,chvPeriodInp, smoothTypeInp, lotSize, slPips, tpPips);
Declaration and definition of integer bar variable.
int bars=iBars(_Symbol,PERIOD_CURRENT);
Checking if the barsTotal is less than bars then we need the following to be executed:
Update the value of barsTotal to be equal to the value of bars.
barsTotal=bars;
Declaration of the chvInd array.
double chvInd[]; Retrieval of the specified buffer data of the CHV indicator by means of the CopyBuffer keyword.
CopyBuffer(chv,0,0,3,chvInd);
Set the AS_SERIES flag on the selected array by using the ArraySetAsSeries keyword, as follows.
ArraySetAsSeries(chvInd,true);
Declaration and definition of chvVal for the return of the current value and the previous value of the current of the indicator.
      double chvVal = NormalizeDouble(chvInd[0], 1);
      double chvValPrev = NormalizeDouble(chvInd[1], 1);
Setting the condition of the buy position, we need the EA to automatically place a buy position when it checks the CHV value and finds that it is greater than zero.
      if(chvVal>0)
        {
         double ask = SymbolInfoDouble(_Symbol,SYMBOL_ASK);
         double slVal = ask - slPips*_Point;
         double tpVal = ask + tpPips*_Point;
         trade.Buy(lotSize,_Symbol,ask,slVal,tpVal);
        }
Setting the sell position condition, we need the EA to automatically place a sell position when it checks the CHV value and finds that it is less than zero.
      if(chvVal<0)
        {
         double bid = SymbolInfoDouble(_Symbol,SYMBOL_BID);
         double slVal = bid + slPips*_Point;
         double tpVal = bid - tpPips*_Point;
         trade.Sell(lotSize,_Symbol,bid,slVal,tpVal);
        }
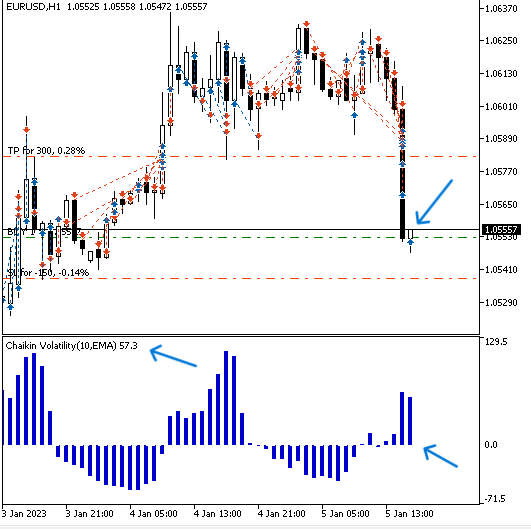
After compiling this code, we can see that the placement of the buy position can be the same as the following:
We find that the sell position can also be placed in the same way as the following:
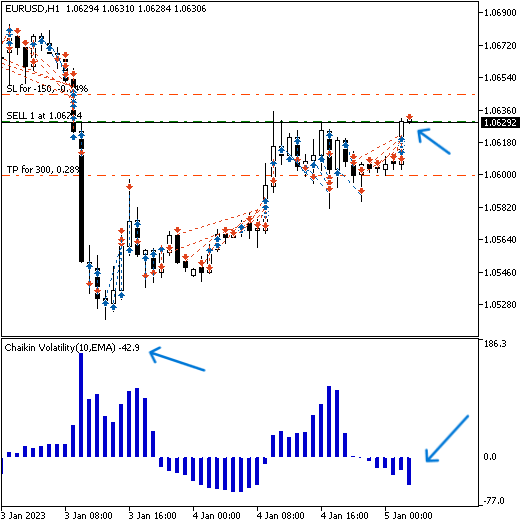
As we know there is no good strategy without testing and getting profitable results. We will focus on the following key measurements:
- Net profit: This is calculated by subtracting the gross loss from the gross profit. The highest value is the best.
- Balance DD relative: It is the maximum loss that the account experiences during trades. The lowest is the best.
- Profit factor: This is the ratio of gross profit to gross loss. The highest is the best.
- Expected Payoff: This is the average profit or loss of a trade. The highest value is the best.
- Recovery factor: It measures how well the tested strategy recovers after losses. The highest is the best.
- Sharpe Ratio: It determines the risk and stability of the tested trading system by comparing the return with the risk-free return. The highest Sharpe Ratio is the best.
So the following graphs are for testing results. We'll test it for one year (1-1-2023 to 31-12-2023) on EURUSD and a time frame of 1 hour.
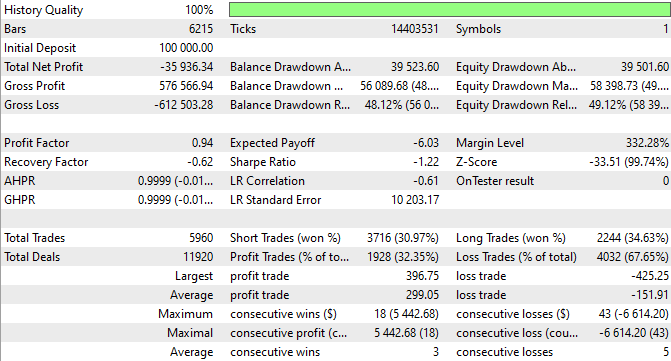
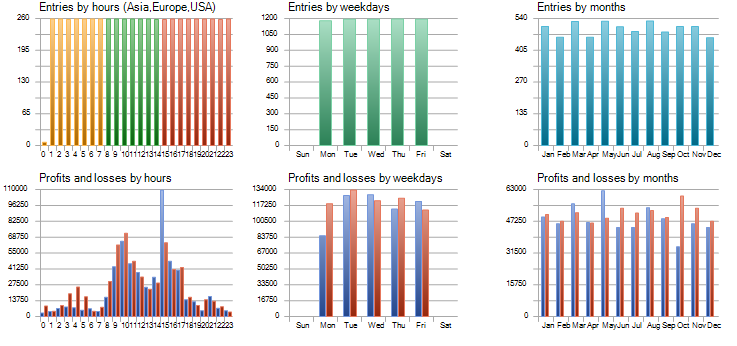
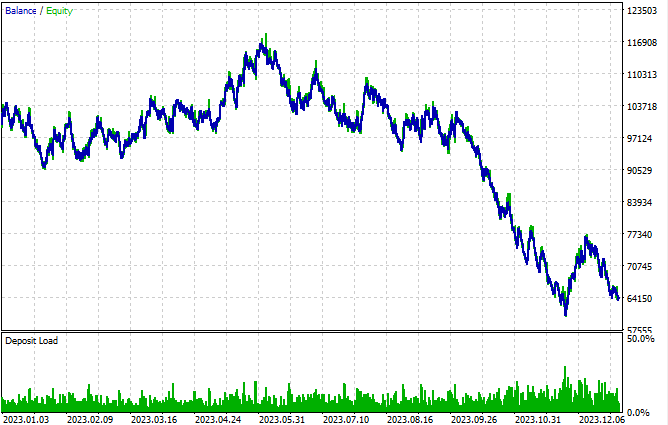
According to the results of the tests, we can find the following important values for the test numbers:
- Net Profit: -35936.34 USD.
- Balance DD relative: 48.12%.
- Profit factor: 0.94.
- Expected payoff: -6.03.
- Recovery factor: -0.62.
- Sharpe Ratio: -1.22.
According to the previous results, we can see that the results are not good or profitable, so we need to optimize them to improve and get better results. The following is to do that through the strategy.
CHV and MA crossover:
According to this strategy, we will use the CHV indicator but we will combine another technical indicator, the moving average, to filter trades based on the direction of the moving average. Below is the full code for doing this:
//+------------------------------------------------------------------+
//|                                             chv_MA_Crossover.mq5 |
//+------------------------------------------------------------------+
#include <trade/trade.mqh>
enum smoothMode
  {
   SMA=0,// Simple MA
   EMA=1 // Exponential MA
  };
input int          InpSmoothPeriod=10;  // Smoothing period
input int          InpCHVPeriod=10;     // Chaikin Volatility period
input smoothMode smoothTypeInp=EMA;   // Smoothing Mode
input int InpMAPeriod=10; //MA Period
input ENUM_MA_METHOD InpMAMode=MODE_EMA; // MA Mode
input double      lotSize=1;
input double slPips = 300;
input double tpPips = 600;
int chv;
int ma;
int barsTotal;
CTrade trade;
int OnInit()
  {
   barsTotal=iBars(_Symbol,PERIOD_CURRENT);
   chv = iCustom(_Symbol,PERIOD_CURRENT,"Custom_CHV",InpSmoothPeriod,InpCHVPeriod, smoothTypeInp, lotSize, slPips, tpPips);
   ma=iMA(_Symbol,PERIOD_CURRENT, InpMAPeriod, 0, InpMAMode, PRICE_CLOSE);
   return(INIT_SUCCEEDED);
  }
void OnDeinit(const int reason)
  {
   Print("EA is removed");
  }
void OnTick()
  {
   int bars=iBars(_Symbol,PERIOD_CURRENT);
   if(barsTotal < bars)
     {
      barsTotal=bars;
      double chvInd[];
      double maInd[];
      CopyBuffer(chv,0,0,3,chvInd);
      ArraySetAsSeries(chvInd,true);
      CopyBuffer(ma,0,0,3,maInd);
      ArraySetAsSeries(maInd,true);
      double chvVal = NormalizeDouble(chvInd[0], 1);
      double chvValPrev = NormalizeDouble(chvInd[1], 1);
      double maVal = NormalizeDouble(maInd[0], 5);
      double maValPrev = NormalizeDouble(maInd[1], 5);
      double lastClose=iClose(_Symbol,PERIOD_CURRENT,1);
      double prevLastClose=iClose(_Symbol,PERIOD_CURRENT,2);

      if(prevLastClose<maValPrev && lastClose>maVal && chvVal>0)
        {
         double ask = SymbolInfoDouble(_Symbol,SYMBOL_ASK);
         double slVal = ask - slPips*_Point;
         double tpVal = ask + tpPips*_Point;
         trade.Buy(lotSize,_Symbol,ask,slVal,tpVal);
        }
      if(prevLastClose>maValPrev && lastClose<maVal && chvVal<0)
        {
         double bid = SymbolInfoDouble(_Symbol,SYMBOL_BID);
         double slVal = bid + slPips*_Point;
         double tpVal = bid - tpPips*_Point;
         trade.Sell(lotSize,_Symbol,bid,slVal,tpVal);
        }
     }
  }
//+------------------------------------------------------------------+
The differences in this code are as follows:
Declare an integer variable for the ma.
int ma; In the OnInit() part, we will define the ma by using the iMA keyword to return the handle of the moving average. Its parameters are:
- symbol: to specify the symbol name, it'll be _Symbol to be applied to the current one.
- period: to specify the time frame, it'll be PERIOD_CURRENT to be applied for the current time frame.
- ma_period: to specify the moving average period, it'll be MAperiod input.
- ma_shift: to specify if we need a horizontal shift for the average line.
- ma_method: to specify the moving average smoothing mode, it'll be the input of MA mode
- applied_price: to specify the price type to be used for calculation, we will use the closing price.
ma=iMA(_Symbol,PERIOD_CURRENT, InpMAPeriod, 0, InpMAMode, PRICE_CLOSE);
Adding the following after checking if there is a new bar:
Declaring maInd[] array.
double maInd[]; Getting data of specified buffer of the moving average indicator by using the CopyBuffer keyword and setting the AS_SERIES flag to the selected array by using the ArraySetAsSeries keyword
      CopyBuffer(ma,0,0,3,maInd);
      ArraySetAsSeries(maInd,true);
Defining the following values:
the current moving average, the previous moving average, the last close, and the previous of the last close.
      double maVal = NormalizeDouble(maInd[0], 5);
      double maValPrev = NormalizeDouble(maInd[1], 5);
      double lastClose=iClose(_Symbol,PERIOD_CURRENT,1);
      double prevLastClose=iClose(_Symbol,PERIOD_CURRENT,2);
Setting the conditions of the buy position, if the previous of the last close is less than the previous moving average value and at the same time the last close is greater than the current moving average and at the same time the current Chaikin value is greater than zero, we need the EA to place a buy position.
      if(prevLastClose<maValPrev && lastClose>maVal && chvVal>0)
        {
         double ask = SymbolInfoDouble(_Symbol,SYMBOL_ASK);
         double slVal = ask - slPips*_Point;
         double tpVal = ask + tpPips*_Point;
         trade.Buy(lotSize,_Symbol,ask,slVal,tpVal);
        }
Setting the conditions of the sell position, if the previous of the last close is greater than the previous moving average value and at the same time the last close is less than the current moving average and at the same time the current Chaikin value is less than zero, we need the EA to place a sell position.
      if(prevLastClose>maValPrev && lastClose<maVal && chvVal<0)
        {
         double bid = SymbolInfoDouble(_Symbol,SYMBOL_BID);
         double slVal = bid + slPips*_Point;
         double tpVal = bid - tpPips*_Point;
         trade.Sell(lotSize,_Symbol,bid,slVal,tpVal);
        }
After compiling this code, we can see that the placement of the buy position can be the same as the following:
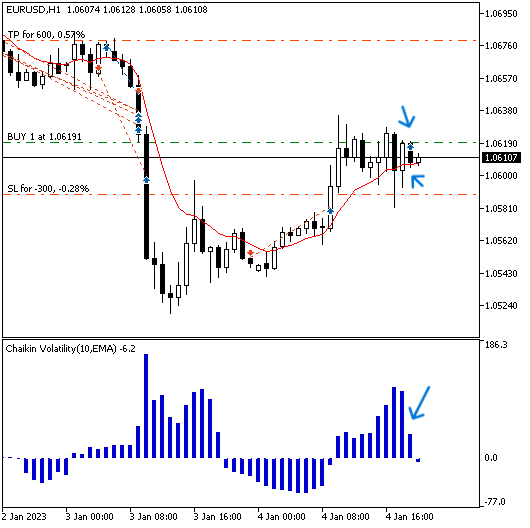
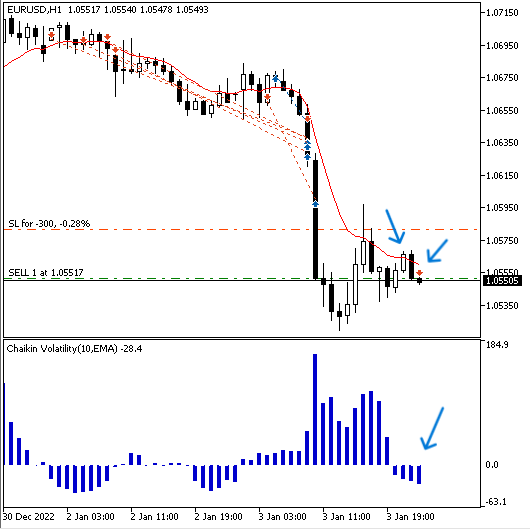
We find that the sell position can also be placed in the same way as the following:
After a test of this strategy for one year (1/1/2023 to 31/12/2023) on the EURUSD and a time frame of 1 hour, our results are as follows.
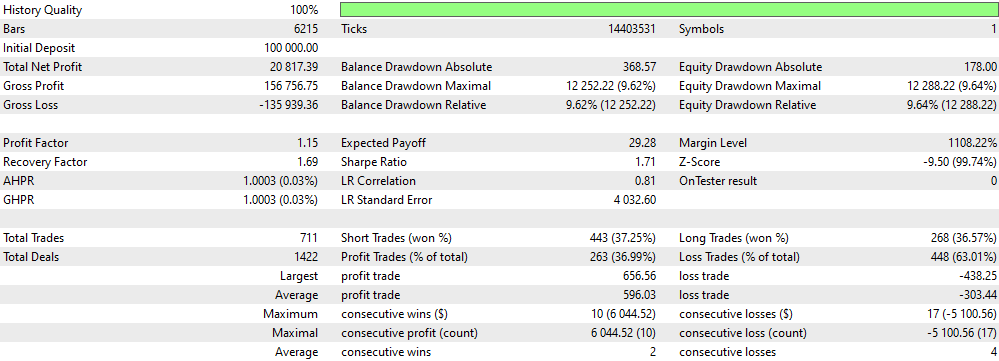
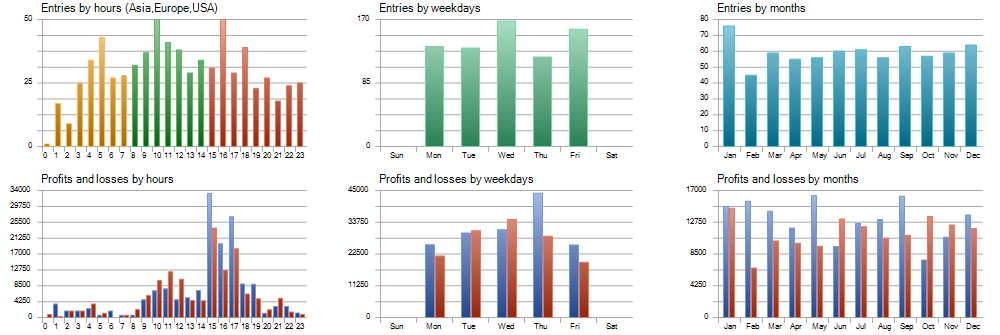
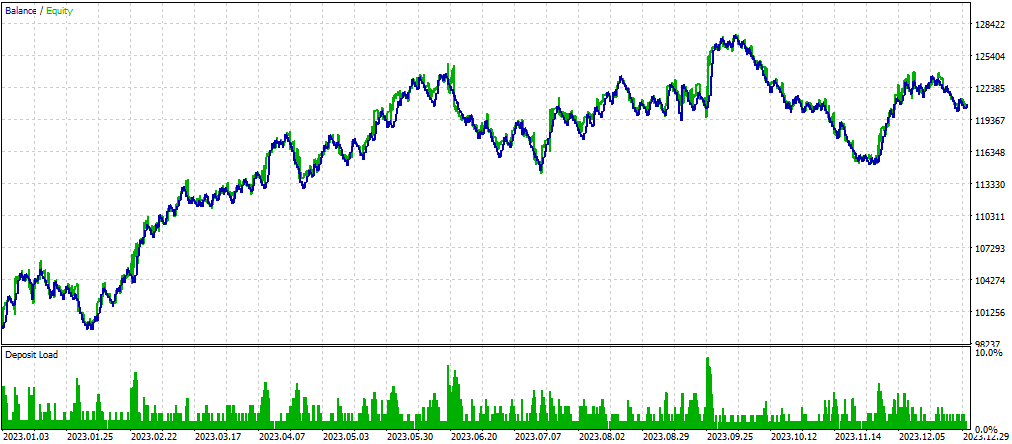
According to the results of the tests, we can find the following important values for the test numbers:
- Net Profit: 20817.39 USD.
- Balance DD relative: 9.62%.
- Profit factor: 1.15.
- Expected payoff: 29.28.
- Recovery factor: 1.69.
- Sharpe Ratio: 1.71.
Based on the results of the previous tests and after adding another technical tool which is the moving average, we can find the best figures that correspond to the strategy tested of CHV and MA crossover one and the 1 hour time frame the same as the following:
- Net Profit: The best higher figure (20817.39 USD).
- Balance DD Relative: The best lower figure (9.62%).
- Profit Factor: The best higher figure (1.15).
- Expected Payoff: The higher figure (29.28).
- Recovery Factor: The higher figure (1.69).
- Sharpe Ratio: The higher figure (1.71).
Conclusion
We should understand the importance of the concept of volatility in the financial market by learning the technical indicator Chaikin Volatility, which can be useful for reading or predicting potential market movements. We assumed that we would understand how the CHV indicator works, how it can be calculated, and how we can use it to our advantage in the trading markets.
We assumed that we understood two simple strategies and how to optimize our strategy to get better results by accompanying it with another technical tool such as the moving average. We have learned how to create our own CHV indicator using the MQL5 to be able to add our preferences to it, we have learned how to use this custom CHV indicator in a trading system based on the mentioned strategies.
- CHV Crossover
- CHV and MA Crossover
We also learned how to create a trading system to work and place positions automatically based on the mentioned strategies by creating EAs, then testing them and seeing how we can get better insights and results by accompanying another technical tool like the Moving Average as an optimization through Strategy Tester.
I encourage you to try and test other possible tools to get better insights as improvement can never end and it is an infinite function not only in trading but also in our lives. I hope you enjoyed reading this article and found it useful in your trading journey, if you want to read more articles about building trading systems and understanding the main concept behind them you can read my previous articles on these topics and others related to MQL5 programming.
Warning: All rights to these materials are reserved by MetaQuotes Ltd. Copying or reprinting of these materials in whole or in part is prohibited.
This article was written by a user of the site and reflects their personal views. MetaQuotes Ltd is not responsible for the accuracy of the information presented, nor for any consequences resulting from the use of the solutions, strategies or recommendations described.
 Developing a Replay System (Part 36): Making Adjustments (II)
 Population optimization algorithms: Micro Artificial immune system (Micro-AIS)
 Neural networks made easy (Part 68): Offline Preference-guided Policy Optimization
 Developing a Replay System (Part 35): Making Adjustments (I)
- Free trading apps
- Over 8,000 signals for copying
- Economic news for exploring financial markets
You agree to website policy and terms of use