Articles with MQL5 programming examples
Access a huge collection of articles with code examples showing how to create indicators and trading robots for the MetaTrader platform in the MQL5 language. Source codes are attached to the articles, so you can open them in MetaEditor and run them to see how the applications work.
These articles will be useful both for those who have just started exploring automated trading and for professional traders with programming experience. They feature not only examples, but also contain new ideas.
Add a new article

You are missing trading opportunities:
- Free trading apps
- Over 8,000 signals for copying
- Economic news for exploring financial markets
Registration
Log in
You agree to website policy and terms of use
If you do not have an account, please register

Timeseries in DoEasy library (part 46): Multi-period multi-symbol indicator buffers
In this article, I am going to improve the classes of indicator buffer objects to work in the multi-symbol mode. This will pave the way for creating multi-symbol multi-period indicators in custom programs. I will add the missing functionality to the calculated buffer objects allowing us to create multi-symbol multi-period standard indicators.

Alert and Comment for External Indicators (Part Two)
Since I published the article "Alert and Comment for External Indicators", I have been receiving requests and questions regarding the possibility of developing an external informer operating based on indicator lines. Having analyzed the questions, I have decided to continue with the subject. Getting data stored in indicator buffers turned out to be another area of interest to users.

Studying the CCanvas Class. Anti-aliasing and Shadows
An anti-aliasing algorithm of the CCanvas class is the base for all constructions where anti-aliasing is being used. The article contains information about how this algorithm operates, and provides relevant examples of visualization. It also covers drawing shades of graphic objects and has a detailed algorithm developed for drawing shades on canvas. The numerical analysis library ALGLIB is used for calculations.
Other classes in DoEasy library (Part 72): Tracking and recording chart object parameters in the collection
In this article, I will complete working with chart object classes and their collection. I will also implement auto tracking of changes in chart properties and their windows, as well as saving new parameters to the object properties. Such a revision allows the future implementation of an event functionality for the entire chart collection.

Graphical Interfaces VIII: the File Navigator Control (Chapter 3)
In the previous chapters of the eighth part of the series, our library has been reinforced by several classes for developing mouse pointers, calendars and tree views. The current article deals with the file navigator control that can also be used as part of an MQL application graphical interface.

Handling ZIP Archives in Pure MQL5
The MQL5 language keeps evolving, and its new features for working with data are constantly being added. Due to innovation it has recently become possible to operate with ZIP archives using regular MQL5 tools without getting third party DLL libraries involved. This article focuses on how this is done and provides the CZip class, which is a universal tool for reading, creating and modifying ZIP archives, as an example.
Indicator for Spindles Charting
The article regards spindle chart plotting and its usage in trading strategies and experts. First let's discuss the chart's appearance, plotting and connection with japanese candlestick chart. Next we analyze the indicator's implementation in the source code in the MQL5 language. Let's test the expert based on indicator and formulate the trading strategy.
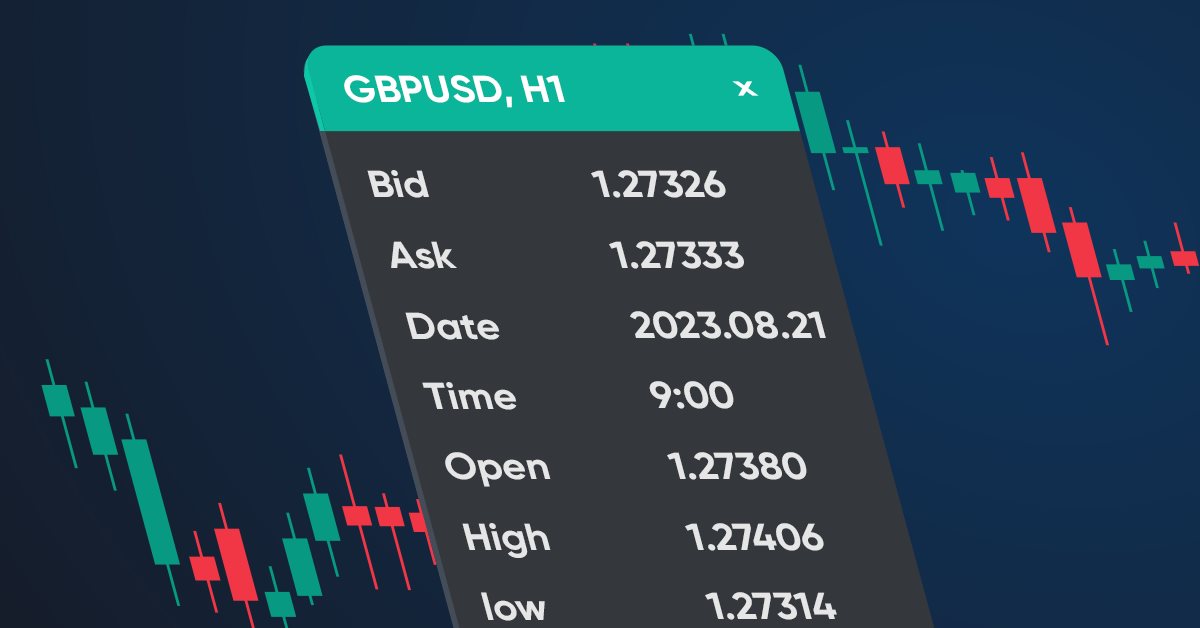
Making a dashboard to display data in indicators and EAs
In this article, we will create a dashboard class to be used in indicators and EAs. This is an introductory article in a small series of articles with templates for including and using standard indicators in Expert Advisors. I will start by creating a panel similar to the MetaTrader 5 data window.
Timeseries in DoEasy library (part 45): Multi-period indicator buffers
In this article, I will start the improvement of the indicator buffer objects and collection class for working in multi-period and multi-symbol modes. I am going to consider the operation of buffer objects for receiving and displaying data from any timeframe on the current symbol chart.

How to Write Fast Non-Redrawing ZigZags
A rather universal approach to writing indicators of the ZigZag type is proposed. The method includes a significant part of ZigZags already described and allows you to create new ones relatively easily.

EA Status SMS Notifications
Developing a system of SMS notifications that informs you of the status of your EA so that you are always aware of any critical situation, wherever you may be.

MetaTrader 4 Working under Antiviruses and Firewalls
The most of traders use special programs to protect their PCs. Unfortunately, these programs don't only protect computers against intrusions, viruses and Trojans, but also consume a significant amount of resources. This relates to network traffic, first of all, which is wholly controlled by various intelligent antiviruses and firewalls.
The reason for writing this article was that traders complained of slowed MetaTrader 4 Client Terminal when working with Outpost Firewall. We decided to make our own research using Kaspersky Antivirus 6.0 and Outpost Firewall Pro 4.0.

Building a Spectrum Analyzer
This article is intended to get its readers acquainted with a possible variant of using graphical objects of the MQL5 language. It analyses an indicator, which implements a panel of managing a simple spectrum analyzer using the graphical objects. The article is meant for readers acquianted with basics of MQL5.

Transferring an Indicator Code into an Expert Advisor Code. Conclusion
This is the final article, devoted to transferring an indicator code into an Expert Advisor code. Here the author transforms on a certain example a code of an Expert Advisor so, that this EA is presented in a single file without calling custom indicators.
Graphical Interfaces XI: Refactoring the Library code (build 14.1)
As the library grows, its code must be optimized again in order to reduce its size. The version of the library described in this article has become even more object-oriented. This made the code easier to learn. A detailed description of the latest changes will allow the readers to develop the library independently based on their own needs.

Price Action Analysis Toolkit Development (Part 28): Opening Range Breakout Tool
At the start of each trading session, the market’s directional bias often becomes clear only after price moves beyond the opening range. In this article, we explore how to build an MQL5 Expert Advisor that automatically detects and analyzes Opening Range Breakouts, providing you with timely, data‑driven signals for confident intraday entries.

Statistical Estimations
Estimation of statistical parameters of a sequence is very important, since most of mathematical models and methods are based on different assumptions. For example, normality of distribution law or dispersion value, or other parameters. Thus, when analyzing and forecasting of time series we need a simple and convenient tool that allows quickly and clearly estimating the main statistical parameters. The article shortly describes the simplest statistical parameters of a random sequence and several methods of its visual analysis. It offers the implementation of these methods in MQL5 and the methods of visualization of the result of calculations using the Gnuplot application.
Graphics in DoEasy library (Part 81): Integrating graphics into library objects
It is time to start the integration of the already created objects into the previously created library objects. This will ultimately endow each library object with its own graphical object allowing users to interact with the program.

Tracing, Debugging and Structural Analysis of Source Code
The entire complex of problems of creating a structure of an executed code and its tracing can be solved without serious difficulties. This possibility has appeared in MetaTrader 5 due to the new feature of the MQL5 language - automatic creation of variables of complex type of data (structures and classes) and their elimination when going out of local scope. The article contains the description of the methodology and the ready-made tool.

Graphical Interfaces VIII: The Tree View Control (Chapter 2)
The previous chapter of part VIII on graphical interfaces has focused on the elements of static and drop-down calendar. The second chapter will be dedicated to an equally complex element — a tree view, that is included in every complete library used for creating graphical interfaces. A tree view implemented in this article contains multiple flexible settings and modes, thus allowing to adjust this element of control to your needs.

Growing Neural Gas: Implementation in MQL5
The article shows an example of how to develop an MQL5-program implementing the adaptive algorithm of clustering called Growing neural gas (GNG). The article is intended for the users who have studied the language documentation and have certain programming skills and basic knowledge in the area of neuroinformatics.

LibMatrix: Library of Matrix Algebra (Part One)
The author familiarizes the readers with a simple library of matrix algebra and provides descriptions and peculiarities of the main functions.

DIY technical indicator
In this article, I will consider the algorithms allowing you to create your own technical indicator. You will learn how to obtain pretty complex and interesting results with very simple initial assumptions.

Complex indicators made easy using objects
This article provides a method to create complex indicators while also avoiding the problems that arise when dealing with multiple plots, buffers and/or combining data from multiple sources.

Neural networks made easy (Part 13): Batch Normalization
In the previous article, we started considering methods aimed at improving neural network training quality. In this article, we will continue this topic and will consider another approach — batch data normalization.

MQL5 Programming Basics: Global Variables of the Terminal
This article highlights object-oriented capabilities of the MQL5 language for creating objects facilitating work with global variables of the terminal. As a practical example I consider a case when global variables are used as control points for implementation of program stages.

MQL5 — You too can become a master of this language
This article will be a kind of interview with myself, in which I will tell you how I took my first steps in the MQL5 language. I will show you how you can become a great MQL5 programmer. I will explain the necessary bases for you to achieve this feat. The only prerequisite is a willingness to learn.
Library for easy and quick development of MetaTrader programs (part VI): Netting account events
In the previous articles, we started creating a large cross-platform library simplifying the development of programs for MetaTrader 5 and MetaTrader 4 platforms. In the fifth part of the article series, we created trading event classes and the event collection, from which the events are sent to the base object of the Engine library and the control program chart. In this part, we will let the library to work on netting accounts.

Price Action Analysis Toolkit Development (Part 3): Analytics Master — EA
Moving from a simple trading script to a fully functioning Expert Advisor (EA) can significantly enhance your trading experience. Imagine having a system that automatically monitors your charts, performs essential calculations in the background, and provides regular updates every two hours. This EA would be equipped to analyze key metrics that are crucial for making informed trading decisions, ensuring that you have access to the most current information to adjust your strategies effectively.
Other classes in DoEasy library (Part 70): Expanding functionality and auto updating the chart object collection
In this article, I will expand the functionality of chart objects and arrange navigation through charts, creation of screenshots, as well as saving and applying templates to charts. Also, I will implement auto update of the collection of chart objects, their windows and indicators within them.
Graphics in DoEasy library (Part 94): Moving and deleting composite graphical objects
In this article, I will start the development of various composite graphical object events. We will also partially consider moving and deleting a composite graphical object. In fact, here I am going to fine-tune the things I implemented in the previous article.

MQL4 Language for Newbies. Difficult Questions in Simple Phrases.
This is the second article from the series "MQL4 Language for Newbies". Now we will examine more complex and advanced constructions of the language, learn new options and see, how they can be applied in everyday practice. You will get acquainted with a new cycle type 'while', new condition type 'switch', operators 'break' and 'continue'. Besides you will learn to write your own functions and work with multidimensional arrays. And for a dessert I have prepared an explanation about a preprocessor.

MetaEditor:Templates as a Spot to Stand On
It may be news to many our readers that all preparations for writing an EA can be performed once and then used continuously.
Graphics in DoEasy library (Part 89): Programming standard graphical objects. Basic functionality
Currently, the library is able to track standard graphical objects on the client terminal chart, including their removal and modification of some of their parameters. At the moment, it lacks the ability to create standard graphical objects from custom programs.

Population optimization algorithms: Particle swarm (PSO)
In this article, I will consider the popular Particle Swarm Optimization (PSO) algorithm. Previously, we discussed such important characteristics of optimization algorithms as convergence, convergence rate, stability, scalability, as well as developed a test stand and considered the simplest RNG algorithm.
Library for easy and quick development of MetaTrader programs (part IX): Compatibility with MQL4 - Preparing data
In the previous articles, we started creating a large cross-platform library simplifying the development of programs for MetaTrader 5 and MetaTrader 4 platforms. In the eighth part, we implemented the class for tracking order and position modification events. Here, we will improve the library by making it fully compatible with MQL4.
Prices in DoEasy library (part 60): Series list of symbol tick data
In this article, I will create the list for storing tick data of a single symbol and check its creation and retrieval of required data in an EA. Tick data lists that are individual for each used symbol will further constitute a collection of tick data.

Running MetaTrader 4 Client Terminal on Linux-Desktop
Description of a step-by-step Linux-desktop setup using a non-emulator wine for running MetaTrader 4 Client Terminal on it.
Calculation of Integral Characteristics of Indicator Emissions
Indicator emissions are a little-studied area of market research. Primarily, this is due to the difficulty of analysis that is caused by the processing of very large arrays of time-varying data. Existing graphical analysis is too resource intensive and has therefore triggered the development of a parsimonious algorithm that uses time series of emissions. This article demonstrates how visual (intuitive image) analysis can be replaced with the study of integral characteristics of emissions. It can be of interest to both traders and developers of automated trading systems.

Drawing Horizontal Break-Through Levels Using Fractals
The article describes creation of an indicator that would display the support/resistance levels using up/down fractals.