Смотри обучающее видео по маркету на YouTube
Как купить торгового робота или индикатор
Запусти робота на
виртуальном хостинге
виртуальном хостинге
Протестируй индикатор/робота перед покупкой
Хочешь зарабатывать в Маркете?
Как подать продукт, чтобы его покупали
Технические индикаторы для MetaTrader 4 - 23

Concept
Market arranges in Time upcoming Phases according to the present Results of its Interest. Directing Modulations are an Interaction of immanent Periods, which show in Reference to Time cyclic Activity and to Price leveling Activity. PointZero is a projecting Price Mask of this Concept of Time and Price and categorizing developed Price Movements related to their own Range: how far moved ? indicating their Status by marking special Events: when which Action ? setting the Situation in a fu
FREE

This indicator applies the biquad high pass filter to the price-chart data, and displays the filter output for the OHLC as candlesticks. The candlesticks corresponds to the actual calculations of the filter value during the formation of each price bar (not from all historical highs lows or closes). The shape of the bars therefore corresponds directly to the shape of each price bar. High pass filters are an underappreciated type of oscillator that are seldom used in technical analysis in the st
FREE

Индикатор Blahtech Moving Average - модифицированная версия стандартного индикатора Moving Average. Он также дополнен настраиваемыми оповещениями, разделителями периодов и другими возможностями настройки. 50-дневная и 200-дневная скользящие средние широко применяются инвесторами и трейдерами, а прорывы вверх и вниз от линий MA считаются значимыми сигналами.
Основные особенности До трех таймфреймов Настраиваемые переменные для вычислений Настраиваемые оповещения и сообщения Дополнительные перио
FREE
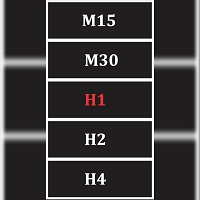
Seamlessly switch between 13 (9 mt4 default and 4 popular custom) time frame with this tool. Real ease of switching between default and custom time frames. Note indicator does not create custom time frame chart data, it only enables you to switch to and from them. Creating a custom time frame can be done using the default mt4 period converter script attached to a lesser default mt4 time frame. Example attach period converter on M1 and set period multiplier to 10 to have a custom M10 chart.
FREE
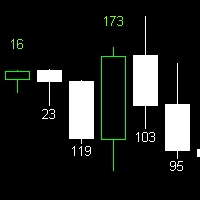
Candle Size Indicator Explore the candle size using this convenient indicator. It works across various timeframes, providing valuable insights for technical analysis. Key Features: Display the size of the candle after configuring the indicator. Compatible with all timeframes. The size of the candle is a significant metric in technical analysis, offering insights into market strength and volatility. This indicator enables clear and accurate visualization of candle sizes on your chart. Utilize thi
FREE

Индикатор отображает свечной паттерн Pin Bar. С помощью настроек коэффициента легко настраивается соотношение тени, тела и размера. Возможна фильтрация по тренду (2 скользящие средние) и по развороту (RSI и полосы Боллинджера). Это самый популярный паттерн прайс экшн. В наличии мультивалютный дэшборд. С его помощью вы можете легко переключаться между графиками.
Торговые паттерны: Ретест по тренду. Ложный пробой. Другие.
EURUSD, GBPUSD, XAUUSD, ... M15, M30, H1.
Входные параметры.
Основн
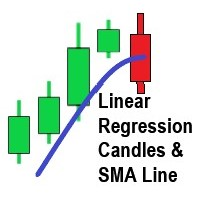
Этот индикатор для МТ4 основан на популярном в настоящее время индикаторе Trading View с аналогичным названием.
4 (OHLC) массивы заполнены значениями линейной регрессии каждой цены. Период линейной регрессии — это ввод, который должен быть больше 2 (по умолчанию он равен 2, если вы пытаетесь ввести 1).
Период линейной регрессии регулируется в зависимости от рыночных условий. SMA также имеет корректировку периода.
Свечи генерируются зеленым для свечей «вверх» и красным для свечей «вниз». S
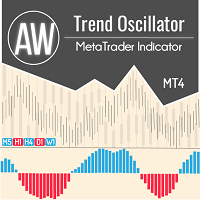
Трендовый осцилятор с продвинутой системой фильтрации. Определяет тренд, его ослабление и усиление. Имеет встроенную мультитаймфреймовую панель. AW Trend Oscillator работает на любых таймфреймах и на любых символах (валюты, индексы, нефть, металлы, акции). MT5 версия -> ЗДЕСЬ / Решение проблем -> ЗДЕСЬ Особенности и преимущества:
Продвинутая фильтрация тренда Изменение чувствительности индикатора в один клик Простая настройка Мультитаймфреймовая панель Возможность перемещения и минимизации
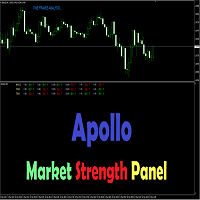
Apollo Market Strength Panel - это мульти-таймфреймовая панель, которая будет полезна в торговле как форекс трейдерам, так и трейдерам бинарных опционов. Панель отображает рыночную ситуацию на нескольких тайм фреймах от M1 до H4. Индикатор отображает три важные аспекты рынка. Это Trend, Force и Impulse. Если все три компонента согласованы, то это будет указывать на сигнал, в зависимости от движения рынка. Индикатор дает сигналы в виде сообщений на графике. Вы можете сами выбирать для каких тайм
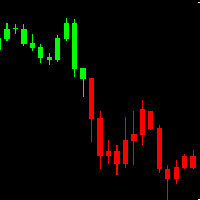
AH Candles MT4 AH Candles MT4 is a new product that allows identifying the current market phase (uptrend and downtrend ).
This indicator paints bars in different colors depending on the current state of the market trend ( Green and Red )
AH Candles MT4 is use for trading currencies
Advantages Suitable for intraday and swing trading. The indicator base on EMA method to calculate Period Parameters It can be used as a standalone tool or together with other indicators.
How to use
FREE

A classical MACD indicator where both the MACD line and the Signal line are displayed as lines. The difference between MACD and Signal line is displayed as a histogram. A user can change the color and thickness of histogram lines. So, histogram lines can be grouped into four different groups: positive ascending, positive descending, negative descending and negative ascending. Multi-currency Dashboard for the indicator is available https://www.mql5.com/en/market/product/72354
FREE

Индикатор фрактал - один из основных в различных стратегиях. Индикатор Volume Fractals расширил функциональность стандартной версии, получил настройки фильтрации фракталов и отображение объемных фракталов, где объемный фрактал - это экстремум не только по цене, но и максимум по объему.
Применение Установка стоп-лоссов Сигнал на разворот Установка отложенных ордеров на пробой фрактала
Настройки Bars of history - количество баров графика, для которых рисуется индикатор Left side minimum bars -
FREE

The " Multi Kernel Regression " is a versatile trading indicator that provides graphical interpretations of market trends by using different kernel regression methods. It's beneficial because it smoothes out price data, creating a clearer picture of price movements, and can be tailored according to the user's preference with various options.
What makes this indicator uniquely versatile is the 'Kernel Select' feature, which allows you to choose from a variety of regression kernel types, such
FREE

The "Trend Edges" indicator determines whether the trend is rising or falling. It is suitable for any time frame (tested on DAX).
The indicator should be treated like Bollinger Bands, meaning that if it breaks out upwards, you can buy with a stop loss below the lower edge.
Find a trending pair, index or CFD. Additionally :
-Sound alert on trend change.
-Alert Notification
-Alert Notification on your mobile phone Check my other indicator "Trend Edges histogram"
FREE
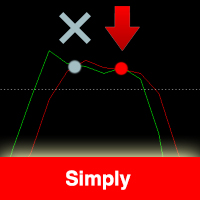
Индикатор основан на индикаторе Stochastic. Рекомендую также посмотреть моего торгового робота Night Zen Стратегия:
В нем заложена стратегия пересечения линий K и D в зонах перекупленности (для продаж) и перепроданности (для покупок). Индикатор дает сигнал на втором пересечении. Сигналы не переписываются, появляются после подтверждения пересечения линий K и D. Настройки:
Настройки индикатора Stochastic Период индикатора Настройки оповещения и алертов
FREE

Как известно, цена всегда движется в определенном канале и при выходе цены за пределы канала, она всегда стремится вернуться обратно в торговый канал Индикатор Ind Channel Exit поможет вам не пропустить выход цены за пределы канала Он может показать алерт или отправит сообщение в терминал на смартфоне, о том что очередной бар закрылся выше или ниже уровней канала Имеет минимальное количество настроек и основным параметром является Channel Multiplier , который определяет ширину торгового канала
FREE

Индикатор PipTick Fibo позволяет автоматически отображать уровни коррекции Фибоначчи, которые являются значимыми уровнями поддержки и сопротивления. Диапазоном для расчета индикатора может быть дневная, недельная, месячная или любая выбранная пользователем сессия.
Levels - уровни 100 % (Максимум) диапазона предыдущей сессии. 0 % (Минимум) диапазона предыдущей сессии. 76,4 % диапазона предыдущей сессии. 61,8 % диапазона предыдущей сессии. 50 % диапазона предыдущей сессии. 38,2 % диапазона преды
FREE
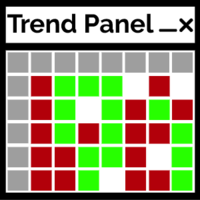
Панель трендов - это простой удобный инструмент, который будет отображать подтвержденное направление тренда таймфреймов M1 - D1 по десяти выбранным пользователем парам. Индикатор предназначен для добавления подтверждения направления в любую стратегию/шаблон, а затем также работает как чистый интерактивный интерфейс для быстрого переключения графика на другую пару или таймфрейм. Групповой чат: https://www.mql5.com/en/users/conorstephenson Пожалуйста, свяжитесь со мной после покупки, чтобы получ
FREE

Индикатор PZ Tick Chart отображает полный тиковый график с двумя опциональными скользящими средними и позволяет легко анализировать ценовые данные меньше минутных. С легкостью определяет скачки цен Цена Ask обозначается синей линией Цена Bid обозначается красной линией Индикатор не теряет тиковые данные при повторной загрузке Имеет две опциональные скользящие средние Индикатор не перерисовывается
Параметры Единственными функциональными параметрами являются цена, режим и период, применяемые к с
FREE

The indicator is based on identifying engulfing candlestick patterns within the current timeframe. When such patterns are found, it generates buy and sell signals represented by up and down arrows, respectively. However, the user is responsible for determining the prevailing trend. Once the trend is identified, they should trade in line with the corresponding signal that aligns with the trend direction.
FREE

Введение в алгоритм GARCH Improved Nelder Mead GARCH - это сокращение от Generalized Autoregressive Conditional Heteroskedasticity (Обобщенная авторегрессионная условная гетероскедастичность). Представляет собой модель прогнозирования волатильности, обычно применяемую в финансовой сфере. Модель GARCH впервые появилась в работе датского экономиста Тима Петера Боллерслева (Tim Peter Bollerslev) в 1986 году. Лауреат Нобелевской премии 2003 года Роберт Ф. Энгл внес огромный вклад в усовершенствовани
FREE

Hello trader,
I'm a fan of Price Action and i coded my indicator named Price Action Candle. May be future it is a paid version that can be get alert by mobile phone or telegram. This indicator can show you three type candles as: PinBar, Inside Bar and Fakey. You can setup more option for other candle: Engulfing
Feel free to contact me in a private message or via telegram @spotXXX
Thanks and happy trading!
FREE

This product is a part of ON Trade Waves Patterns Harmonic Elliot Wolfe
you can test free version on EURJPY from this link Wolf Waves Indicator
Откройте для себя Wolf Waves - ваш идеальный инструмент для торговли! Вы ищете мощный инструмент для легкой идентификации Wolf Waves на любом временном интервале? Дальше смотреть не надо! Наш индикатор Wolf Waves делает это легко. Вот почему он идеально подходит именно вам: Основные характеристики: Автоматическое обнаружение: Наш индикатор Wolf Wav

+ 2 бонусные стратегии! + Алерты! Рекомендую посмотреть моего советника - Night Zen EA Индикатор объединил в себе наиболее популярные стратегии по скользящим средним: Простое пересечение скользящих средних. Пересечении скользящих средних относительно положения более медленной скользящей средней. 2 бонусные стратегии: Пересечение быстрой скользящей средней с расчетом цен открытия медленной скользящей средней с расчетом цен закрытия с учетом более медленной скользящей средней. (Настройки данной
FREE
Buy a Coffee for Yuniesky Carralero Cuellar
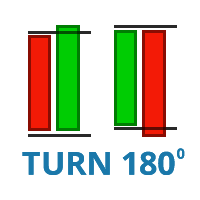
This indicator draws the RED - GREEN and GREEN - RED candlestick pattern, the green candles that close above their previous red candle, and the red candles closing below your previous green candle. https://www.youtube.com/watch?v=UAW-fIyV-0U&t=1154s
Input Parameters 1. RED - GREEN: Draw the green candles that close above their previous red candle. 2. GREEN - RED: Draw the red candles that close below their previous green candle. 3. PREV CANDLE: D
FREE

The YK-LOT-SIZE is an indicator that displays the total Lot Size and profit/loss of all trade orders for the current symbol on the price chart. It has the following features: Shows the total Lot Size of buy orders (BUY) and sell orders (SELL) on separate lines. Displays the profit/loss of buy orders (BUY) and sell orders (SELL) by calculating the sum of profit, commission, and swap. Users can customize the color of the displayed text through the input parameter. The information is displayed at t
FREE

A. Этот сводный индикатор показывает дневную сводную цену.
B. Он также показывает сопротивление R0,5, R1, R1,5, R2, R2,5 и R3
C. Это также показывает поддержку S0.5, S1, S1.5, S2, S2.5 и S3
ВХОД:
Под входом вы увидите 3 переменных
1.ExtFomula. Здесь вы можете установить предпочтительный выход для сопротивления или поддержки в окне графика на значение не более 1, 2 или 3. 1 представляет выход на сопротивление или поддержку 1. 2 представляет выход на сопротивление или поддержку 2. 3 пред
FREE

VR System – это не просто индикатор, это целая, хорошо сбалансированная торговая система для торговли на финансовых рынках. Система построена на классических правилах трейдинга и комбинации индикаторов Moving Average и канал Дончана ( Donchian channel ). В системе VR System учтены правила входа в рынок, удержание позиции в рынке и правила выхода из позиции. Простые правила торговли, минимальные риски, четкие инструкции делают VR System привлекательной торговой стратегией для трейдеров на финансо

Tester Periods это индикатор для работы в визуальном тестере, который создает графики разных периодов. Он специально разработан для торговой утилиты Trade Shell (включая Trade Shell SMC ).
Запустите Trade Shell в визуальном тестере, затем поместите индикатор Tester Periods на график. Если вы хотите видеть , например, периоды графика М1, М5, М10, М15, запустите визуальный тестер на М1 и задайте параметр множителя следующим образом: TimeFrame_Periods_Multiplier = 1,5,10,15 Если же вы хотите в
FREE
Traders Dynamic Index (TDI) Signal Input parameters: signal mode: set it to true if you want to plug it into STAT (Signal Tester and Trader) arrow shift: distance between fast EMA line to arrow on chart middle band filter price line filter RSI period RSI price method Volatility period MA period 1 MA period 2 Averaging method You can find the best setting for 4 hour EURUSD on this video
FREE

Introduction and Description
The indicator displays an arrow whenever a " Bearish Engulfing " is detected. The latter usually indicates the beginning of a downward trend. A bearish engulfing pattern is a technical chart pattern that signals lower prices to come. The pattern consists of an up candlestick followed by a large down candlestick that eclipses or "engulfs" the smaller up candle. The pattern can be important because it shows sellers have overtaken the buyers and are pushing the price m
FREE

Индикатор линия гравитации, к которой цена всегда возвращается. Это своего рода центр притяжения и магнит для цены. Позволяет вести торговлю как по тренду так и на откатах. Работает на всех таймфреймах, на любых валютных парах, металлах и криптовалюте Можно использовать при работе с бинарными опционами Отличительные особенности Не перерисовывает свои значения; Цена всегда возвращается к линии гравитации; Основан на законах сохранения равновесия; Имеет простые и понятные настройки; Работает на вс
FREE

Indicator for the 4th strategy of the Pipsurfer EA. This indicator will allow the user to visually see the points of entry for strategy 4 of Pipsurfer. In the settings you will be able to adjust the parameters to mix and match to your trading style and find the settings that you want to either trade manually or tune the EA to do. Strategy 4 uses a market structure trend continuation approach to trading and looks for confirmed highs in downtrends and confirmed lows in uptrends to find great trend
FREE

После 7 лет я решил выпустить некоторые свои индикаторы и советники бесплатно.
Если вы находите их полезными, пожалуйста, поддержите меня пятизвёздочным рейтингом! Ваш отзыв помогает продолжать выпуск бесплатных инструментов! Также смотрите мои другие бесплатные инструменты здесь
_________________________________ Индикатор %B для Улучшенного Анализа Форекс Индикатор %B, мастерски созданный на MQL4, является динамичным инструментом, предназначенным для революционизации анализ
FREE
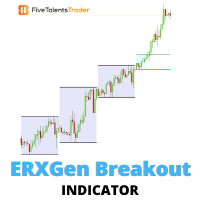
Без волатильности торговля на финансовых рынках была бы невозможна. Получить прибыль можно ТОЛЬКО за счет движения цены. Система ERXGen (Early Riser Next Generation) – методика краткосрочной торговли, основанная на том, что в определенные моменты времени в течение торгового дня волатильность растет. Основу ERXGen составляет очень популярная стратегия London Open Breakout с добавлением правил, повышающих стабильность и эффективность продукта. Для определения условий входа используется поведение ц

SuperTrend AM - индикатор который позволяет открыть позицию в самом начале значительного движения цены. Вторым важнейшим качеством индикатора является способность максимально долго следовать тренду для получения всей потенциальной прибыли при этом минимизируя потенциальные убытки. Индикатор не перерисовывается и не пересчитывается. Вариант данного индикатора с расширенными возможностями по настройке и уведомлениями о сигналах - SuperTrend 3 .
Сигналы при работе с индикатором: появление красно
FREE
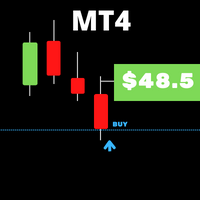
Когда вы работаете с несколькими активами и имеете несколько открытых позиций по активам, немного сложно визуализировать, когда прибыль или прибыль дает каждая активная проблема, поэтому с учетом этого мы разрабатываем этот индикатор, где он облегчает визуализацию операций с активами. , где вы сможете открыть несколько разных ресурсов и сможете визуализировать индивидуальный результат каждого актива и ускорить принятие решений в своем бизнесе.
FREE
Easily track and trade with the trend using this indicator. Uses a circle and line to indicate the trend direction. Excellent for channels. Features alert function.
Parameter TrendPeriod can be changed to your preference. How to use: Simply attach to any chart. Blue circle plus blue line cross below price = Buy. Red circle plus red line cross above price = Sell. Best results when taking higher time frames into consideration before entering a trade. (Hint: Wait for the radar/circle to appear on
FREE

Double Exponential Moving Average ( DEMA ) is a moving average (MA) that gives the most weight to recent price data.Like exponential moving average (EMA), it is more reactive to all price fluctuations than a simple moving average (SMA) and so DEMA can help traders to spot reversals sooner, because it is faster responding to any changes in market activity. DEMA was developed by Patrick Mulloy in an attempt to reduce the amount of lag time found in traditional MAs. ( TASC_Feb. 1994 ). DEMA can al
FREE

FuturePriceM15 - один из немногих индикаторов, который делает прогноз цены прямо на ценовом графике. Алгоритм расчета индикатора основан на быстром преобразовании Фурье. Имея колебательное поведение цены, функция Фурье прогнозирует ее поведение в дальнейшем. Индикатор устанавливается обычным образом на график с торговым инструментом указанным в переменной symbol с периодом M15 , данный временной период является самым оптимальным для работы с любыми торговыми символами. После установки, индикато
FREE

Индикатор RSI Arrows MTF построен на основе индикатора RSI . Представляет собой сигналы на вход в виде стрелок. Имеет 6 видов расчета. Все сигналы образовываются на текущем баре выбранного периода. Сигналы не перерисовываются в первых 4 режимах! Но возможно перерисовка в случаях резкого изменения движения рынка. Все сигнала в режиме MTF, соответствуют сигналам того периода, который указан в MTF. Максимально упрощен в использовании как для торговли исключительно одним индикатором, так и для и
FREE
LordOscilatorSignal is a financial market indicator for Meta Trader, which uses standard market indicators; Stochastic, Moving Average, MACD, MA Xover, P.SAR.
Exactly! this single indicator has the help and assistants of (5) indicators.
The LordOscilatorSignal has a graphic panel of great visualization and understanding, being able to observe the values of each indicator and timeframes.
LordOscilatorSignal identifies through the trends of the buying and selling indicators, if all indicato
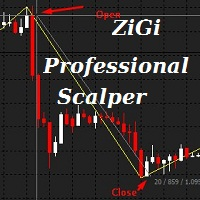
Индикатор ZiGi Professional Scalper : Инструмент реального анализа волн Этот индикатор раскрывает истинные волны рынка, выявляя чередующиеся максимумы и минимумы на графике цены, тем самым отображая волновую структуру рынка. Алгоритм этого индикатора совершенно новый, и его связь с ZiGi Professional Scalper и zigzag чисто косметическая. Он основан на восьми радикально различных алгоритмах и способен вычислять объемы рынка в реальном времени. При использовании этого индикатора ручное нанесение
Moving Average Crossover Scanner This Scanner scans two moving averages(MA) crossover across multi-currency pairs and multi-time frames and shows all the result in the dashboard. 1. The fast MA is about to cross up the slow MA - designated as "XUP". 2. The fast MA is about to cross down the slow MA - designated as "XDN". 3. The fast MA has just crossed up the slow MA - designated as "UP". 4. The fast MA has just crossed down the slow MA - - designated as "DN". Input parameters can be changed

The Market Profile Indicator for MT4 displays the price levels and zones where increased trading activity happens. These zones with substantial forex trading activity provide the forex traders with the best entry levels, support, and resistance levels. Moreover, price levels indicate the best reversal zones. As a result, forex traders can identify BULLISH and BEARISH market trends and BUY and SELL entry points as well as the best reversal points. The indicator works well in all intraday timefram
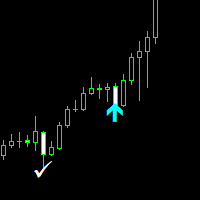
Nasdaq Savages Non-repaint indicator works on all timeframes 1 minute to 15 minutes timeframe for scalpers. 30 Minutes to Monthly timeframe for swing traders The Nasdaq Savages indicator comes with a top right info tab which tells you about the current buy or sell signal, Profit in pips, Stop loss and Target Red arrow is your sell entry signal the white right tick is your exit signal and take profit hit signal Light blue arrow is your buy entry signal the white right tick is your exit signal an

Introducing the "Magic Trades" for MetaTrader 4 – your ultimate tool for precision trading in dynamic markets. This innovative indicator revolutionizes the way you perceive market trends by harnessing the power of advanced analysis to detect subtle changes in character, paving the way for optimal trading opportunities.
The Magic Trades Indicator is designed to empower traders with insightful entry points and well-defined risk management levels. Through its sophisticated algorithm, this indica
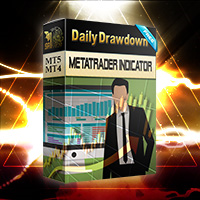
It is a very simple indicator to display daily loss percentage, open position loss percentage, monthly loss percentage and monthly profit percentage. MT5 version
We assure you that we welcome any suggestions to improve this indicator and make the necessary changes to improve this indicator.
You can contact us via Instagram, Telegram, WhatsApp, email or here. We are ready to answer you.

The Market Sessions Indicator for MT5 helps you predict market turnarounds by detecting major supply and demand areas. These pivot points tend to occur after a new session has started and the previous one is still open. It is also used to gauge how many points or pips the market moves on average during a session. This helps us to place better our take profits and stop losses. The indicator works on all forex pairs, gold, silver, commodities, stocks, indices and any other instrument that your
This indicator scanning thorough the history and drawing horizontal rays on all bars untested lows and highs. Fresh supply/demand zones and support/resistance levels will be marked down. It allows to be sure that certain levels is fresh and has not been tested yet. Usually after strong departure price is not retesting base immediately and leaving unfilled orders. There is no inputs, so indicator is ready to go. Version for MT5 is also available here: https://www.mql5.com/en/market/product/3084
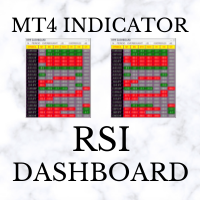
RSI Dashboard uses the value of Relative Strength Index indicator. The parameters can be adjusted via the Edit boxes of this dashboard. The monitoring pairs will be selected by adding to the Market Watch (no need to set prefixes or suffixes) , you can monitor many pairs as you like. This dashboard will check almost popular time frame (M1,M5,M15,M30,H1,H4 and D1). The colors can be customized. We can have a look at many pairs and many time frames without opening the chart. In addition, we can

Описание
Trend Influencer - индикатор который определяет потенциальную динамику влияния трендовых волновых движений на состояние рынка. В основе индикатора лежит значение скользящих средних, скорректированных стандартным среднеквадратическим отклонение. Индикатор отображен в виде основной штрих-пунктирной скользящей средней и сигнальной сплошной скользящей средней. Сигнальная скользящая средняя окрашивается в синий или красный цвет в зависимости от того, какой тип тренда сейчас наблюдается на р

Imbalance / Fair Value Gap (FVG), this is a zone / gap created when the price move with force in a given direction. It identify a zone where the price could potentially go back. This gives perfect targets for your trades.
Imbalance is created from the high and low of 3 candles. When the wicks the of 1st and 3rd candle does not fully overlap the middle one.
This indicator will help you to easily spot mitigated/unmitigated imbalances in your chart.
NEW FEATURE Update: Multi-TimeFrame Feat

Il nostro Indicatore Combinato RaysFX CCI-RSI è uno strumento unico che combina due dei più popolari indicatori di analisi tecnica: l’Indice di Forza Relativa (RSI) e l’Indice del Canale delle Materie Prime (CCI). Caratteristiche : Combinazione di CCI e RSI : L’indicatore calcola la differenza tra i valori di CCI e RSI per ogni barra del grafico. Media Mobile Semplice (SMA) : L’indicatore calcola una SMA su queste differenze e traccia due linee sul grafico. Segnali di trading : Ogni volta che qu
FREE

Function Indicate Buy Sell Signals Indicate Strength of Buy Sell Signals This system is for both type of traders (Short & Long Term) Instead of Other Calculations, Parabolic Sar & Awesome are also used In Any time frame this can be use. What is in for Trader? Trading Switch: Short Term & Long Term Finally, we all knows that Forex Trading needs completely concentrate & proper cash management, So I never promising that my program will never give you loss but I tried well to provide good and respo
FREE
Wicks UpDown Target
Choppy movement up and down on the opening range every day. Trading breakouts on London session and New York session is recommended. Wicks UpDown Target is specialized in all forex pairs.
Guideline Entry Strategy Idea:
Step 1 - Breakout Forming (Warning! Trade on London Session and New York Session) Step 2 - Breakout Starting (Take Action on your trading plan) Step 3 - Partial Close your order & set breakeven (no-risk) Step 4 - Target complete Step 5 - Don't trade in
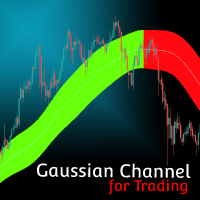
MT5 Version
Gaussian Channel MT4 Gaussian Channel MT4 is the first indicator in the market that uses Ehlers Gaussian Filter methods to define trends. Nowadays, this Gaussian Channel is highly known as a method to support HOLD techniques in crypto. If the price is above the channel the trend is strong, if it comes back to the channel this can react as a resistance and indicate the beginning of a bear market (or Winter) if the price breaks below it. Eventhough the use of this channel focuses on

Heikin-Ashi charts , developed by Munehisa Homma in the 1700s. Munehisa Honma was a rice merchant from Sakata, Japan who traded in the Dojima Rice market in Osaka during the Tokugawa Shogunate. He is considered to be the father of the candlestick chart. Th e man who invented the use of candlestick charts for finding and profiting from chart patterns.He was a billionaire trader on those days if we compared his net-worth with todays dollar . Heikin Ashi Scanner is an Multi-Currency and Multi

This indicator tool provides mini charts, with adjustable symbol/tf that can be dragged and resized into place. Lightweight operation with multiple mini charts are supported.
Chart features: adjustable symbol and tf draggable resizeable multiple mini charts color styling and font sizing, foreground/background colors candle coloring candle styles; candles, bars, line, high-low channel
optional background color gradient predfined period separators on all tf's (eg 1hr/1day sep on 1Min, 4hr/1day

Must be owned and used by Fibonacci traders who like to open position by pending order (limit order). The strategy is that you just have to wait for the automatic custom fibonacci appear then manual place your pending order, stop loss and take profit at the level of Fibonacci. The position will be opened when the price make a successful retest. Fibo Heart Indi come with pop-up alert, email and mobile push notification. Suitable for all instruments and all time frames. Don't miss the trading set
Indicator Rua Alert Trend Line. This indicator will notify when the price breaks any trendline on the chart. Notifications will be sent to the phone and on MT4. Custom parameters: in_NumbersAlert: The number of notifications that will be sent when the price breaks the trendline. A product of Ruacoder Provide code indicator and EA services upon request. Contact: Telegram : https://t.me/Ruacoder
FREE

Key Level Key Level is a MetaTrader 4 Indicator that uses a proprietary algorithm based on Price Retracement/Breakout Method to show the Entry-Line on your trading.
Instead, it analyzes data of market and identify entry points and opportunities. (Price Retracement / Price Breakout)
It's also a trading tool that be used to practice and enhance your manual trading skills.
Key Level is an amazing tool for Scalping Trader. It also a trading tool that be used to practice and enhance your manual t
FREE

Indicator draws Round Number lines by distance of pips. 1. You can enable / disable indicator to show / hide the lines. 2. You can set distance of pips between the lines. 3. You can edit the number of lines. 4. You can edit properties of lines by inputs (style (DASH, DOT, SOLID, ...) , width (1 for DASH, DOT, 2 is not for DASH, DOT, it only SOLID), color). When indicator is deleted from the chart, the lines will be removed.
FREE

MT4 Candlestick Pattern Alert Indicator: Stay Ahead of Trading Opportunities Overview The MT4 Candlestick Pattern Alert Indicator is a robust tool designed to empower traders by detecting candlestick patterns and delivering timely alerts through notifications, emails, and pop-up alerts. This invaluable tool saves traders precious time, allowing focused analysis on patterns and potential profitable trades. Importance of Candlestick Patterns Candlestick patterns are pivotal in technical analysis,
FREE
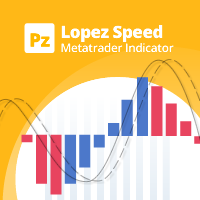
Осциллятор рассчитывает различные векторы цены/времени для отображения итогового направления рынка на основе суммы всех векторов цены/времени и двух скользящих средних, чтобы рассчитать, ускоряется рынок или замедляется. Прост в освоении и использовании
Эффективный фильтр сделок Уникальный алгоритм вычисления скорости Не перерисовывается
Снабжен различными алертами
Может использоваться в качестве эффективного фильтра сделок по тренду. Основные принципы использования: если синяя скользящая сре
FREE

Я создал этот простой индикатор, когда изучал TheStrat Роба Смита, и он оказался настолько полезным, что я решил поделиться им с вами. Если вы сочтете это полезным, посмотрите другие индикаторы, которые я опубликовал на MQL5. Индикатор просто рисует на графике одну линию, показывающую выбранный вами уровень цены на более высоком таймфрейме. Используя настройки, вы имеете полный контроль над отображаемым таймфреймом, но по умолчанию он сам рассчитывает более высокий таймфрейм, просто перемещаяс
FREE
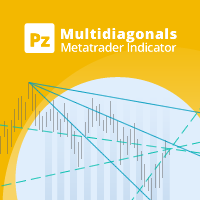
Индикатор соединяет предыдущие ценовые точки, проводя диагонали и трендовые линии, которые впоследствии сходятся, создавая скрытые точки разворота. Находит скрытые точки разворота Легко находит зоны схождения Зоны концентрации пересечений служат разворотными точками Настраиваемое число линий и ценовых точек Настраиваемые цвета
Применение Индикатор отрисовывает на графике несколько линий. Место их будущего схождения и пересечения является потенциальной точкой разворота. Индикатор также отобража
FREE

Индикатор ценового канала за определенное количество баров, заданных в настройках.
Линии индикатора представляют собой динамические уровни поддержки или сопротивления. Верхняя граница является ценовым максимумом за определенное число периодов, нижняя – минимумом. В отличии от скользящих средних, которые строят по ценам закрытий, индикатор не «отвлекается» на мелкие колебания. Пересчитываться он будет только в том случае, если изменятся границы. Если же последнее происходит, значит, стоит серьез
FREE

Индикатор уровней на основе индикатора Zig-Zag - это высокоточный инструмент для торговли на Forex, который поможет вам улучшить вашу стратегию и принимать более точные решения. Он использует алгоритм Zig-Zag для определения различных уровней поддержки и сопротивления на рынке, исходя из чего можно определить, когда лучше всего войти или выйти из сделки. Этот индикатор обладает высокой производительностью и точностью в расчете уровней, что позволяет трейдерам получать максимальную прибыль при ми
FREE
Highly configurable Bollinger Bands indicator. Features: Highly customizable alert functions (at levels, crosses, direction changes via email, push, sound, popup) Multi timeframe ability Color customization (at levels, crosses, direction changes) Linear interpolation option Works on strategy tester in multi timeframe mode (at weekend without ticks also) Parameters:
Bollinger Bands Timeframe: You can set the lower/higher timeframes for Bollinger Bands. Bollinger Bands Bar Shift: Y ou can set
FREE
А знаете ли вы, почему MetaTrader Market - лучшее место для продажи торговых стратегий и технических индикаторов? Разработчику у нас не нужно тратить время и силы на рекламу, защиту программ и расчеты с покупателями. Всё это уже сделано.
Вы упускаете торговые возможности:
- Бесплатные приложения для трейдинга
- 8 000+ сигналов для копирования
- Экономические новости для анализа финансовых рынков
Регистрация
Вход
Если у вас нет учетной записи, зарегистрируйтесь
Для авторизации и пользования сайтом MQL5.com необходимо разрешить использование файлов Сookie.
Пожалуйста, включите в вашем браузере данную настройку, иначе вы не сможете авторизоваться.