Смотри обучающее видео по маркету на YouTube
Как купить торгового робота или индикатор
Запусти робота на
виртуальном хостинге
виртуальном хостинге
Протестируй индикатор/робота перед покупкой
Хочешь зарабатывать в Маркете?
Как подать продукт, чтобы его покупали
Технические индикаторы для MetaTrader 4 - 29

Hypothetical trend line display
Distance from the trend line
Can be used in all symbols
Can be used in all time frames
An interesting indicator for predicting small waves
The greater the distance from the trend line, the more likely it is to return to the trend line
Settings:
The first three(osic 1,2,3):
are the same as the settings of the zigzag indicator
The bigger these numbers are, the bigger the trend lines and the longer the trend
Back Show:
The number of candles displayed
FREE

Normalized indicator. It measures the relative deviation of the price from its moving average. It is extremely reliable. Accurately determine overbought and oversold price areas and divergences. Features. The indicator has a range of -100 to 100. The overbought zone is above 80 and the oversold zone is below -80. Zones of overvalue, indicate possible reversal. Mode: histogram/line. MA method: simple, exponential, smoothed, linear weighted. By default, the indicator is calculated on an SMA of
FREE

Этот индикатор служит для визуального представления Дончианского канала на вашем торговом графике. Дончианский канал - это простой технический инструмент, используемый для изображения диапазона между самыми высокими и самыми низкими значениями за определенный период. Этот индикатор улучшает визуальный анализ движения цен, предоставляя понимание потенциальных точек прорыва и продолжения тренда. Дончианский канал может быть применен как к текущему временному интервалу, так и к более высокому, если
FREE

BolingCustom is a Trend indicator designed for all Time frames and all currency pairs. For a better experience, it is recommended to use in time frames above 15 minutes.
Due to its understandable and simple presentation on the chart, even beginners can easily learn how to use it.
If you have any problems or questions, let us know. We will be happy to contact you: Direct massage
How this indicator works is that it shows the trend using a combination of several indicators such as the Bo
FREE

Индикатор LexusBO рекомендуется для торговли бинарными опционами . ( Для создания своего сигнального индикатора без знания кода и опыта программирования воспользуйтесь моим уникальным инструментом Arrow Construct .) Сигналы формируются при пересечении настраиваемых уровней индикаторами RSI, ADX, CCI. На графике индикатор отображает сигналы стрелками "вверх/вниз" , значения которых находятся в буферных массивах (буфер с индексом 0 - стрелка "вверх", с индексом 1 - стрелка "вниз"). Поэтому инд
FREE

Сигнальный индикатор, состоящий из нескольких широко известных индикаторов, обрабатывающих данные последовательно. 2 варианта - для графика и подвальный. В настройках возможно включить оповещения о смене тренда (алерты) звуковые, на e-mail и push. Есть возможность менять цвета и толщину линий, цвета и коды стрелок, количество расчетных баров и отдельно настраивать параметры входящих в состав индикаторов.
FREE
Данный индикатор представляет собой осциллятор построенный по принципу классического Momentum. Индикатор входит в серию индикаторов - Hull Line AM, Hull Momentum AM, Hull Candles AM, Hull Signal AM . Индикатор представляет собой разницу текущей цены и ценой некоторое количество периодов назад. Отличием от классического индикатора Momentum является предварительное сглаживание цен по методу предложенному Alan Hull. Использование индикатора: Следует принимать во внимание что значения индикатора
FREE

Esse indicador mede o 1º Canal de referencia e a 1º Zona Neutra * configurar o canal macro para verificar a frequencia MAIOR H1 H4 1D * configurar o canal micro para verificar a frequencia Menor 1M 5M 15M Como instalar o Indicador fimathe. E uma pré mentoria tem uma estrategia Secreta bonus nesse video . assitao o video para enteder as logicas que podemos iniciar com esse indicador.
https://www.youtube.com/playlist?list=PLxg54MWVGlJzzKuaEntFbyI4ospQi3Kw2
FREE

The ADX Indicator is known to be used to determine the trend direction. Not only that, but it also has deviation (+DI and -DI) that determine the direction of the trend as well. The role of the indicator is to spot the trend and its direction and generate signals accordingly.
Indicator Settings: - ADX period : default is 14 periods (it works best with the timeframe H1). - Signal Width : the size of signals arrows. - Signal Distance : the distance of the signal arrow from the candle. - Signal c
FREE
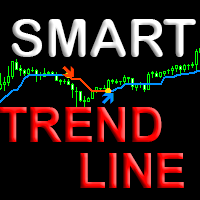
Индикатор с инновационным алгоритмом определения направления тренда. Показывает лучшие результаты определения тренда на любых валютных парах, акциях, криптовалюте без перерисовки результата. Поможет сразу определить прибыльность текущей пары и таймфрейма. Использует паттерны Price action в связке с авторским уникальным алгоритмом. Подходит как новичкам так и профессионалам для всех видов торговли. Как выбрать прибыльный таймфрейм и оптимизировать индикатор под валютную пару. Особенности Новейший
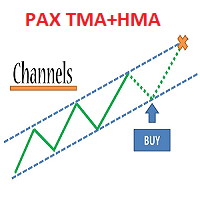
Система PAX Multi TMA/HMA 8 это готовая торговая система для работы на любом инструменте и любом таймфрейме. Опытный трейдер на одном инструменте может получить профит от 100% до 400% в день . 10000 активаций.
Полностью готова для ручной торговли и использовании в роботах.
Удобно работать на таймфреймах M30, H1, H4. Протестировано на металлах, валютных парах, нефти, международных акциях, российских акциях, криптовалютах, денежных и криптовалютных индексах.
Уведомления: Впараметрах индикат

Индикатор использует скользящее среднее для обнаружения трендов. Очень полезный инструмент для ручной торговли. Если линия окрашена цветом Midnight Blue (полуночно-синий), индикатор распознал растущий тренд. Если линия темно-фиолетовая (Dark Violet), индикатор распознал нисходящий тренд. Показатели индикатора очень понятны и просты в использовании. Лучше всего индикатор работает на таймфрейме H1. Индикатор можно использовать с дополнительной линией FollowLine для получения более точных сигналов.
FREE

In physics, "Jerk" is the third time-derivative of position, with acceleration being the second derivative and velocity the first derivative. In technical analysis, the first derivative of price is the price momentum, with the second derivative,acceleration, being seldom used and the third derivative virtually unknown. The magnitude frequency response of a digital differentiator is a positive-slope straight line passing through zero frequency. Therefore, every instance of a digital signal differ
FREE

MACD is well known indicator that still can be use for prediction where price will go next few minutes, hours or even weekly With colored bar of Macd, your eyes can easily catch when color is changed based what market price movement to find any early trend on market. here is the parameter of the indicator: TF_MACD , default is 1 Hour , this mean you can see clearly MACD of 1 Hour TimeFrame on Lower TimeFrame. InpPrice , default is Price Close , this is original MACD parameter from Metaquotes st
FREE

Introduction and Description
The indicator displays an arrow whenever a " Bearish Engulfing " is detected. The latter usually indicates the beginning of a downward trend. A bearish engulfing pattern is a technical chart pattern that signals lower prices to come. The pattern consists of an up candlestick followed by a large down candlestick that eclipses or "engulfs" the smaller up candle. The pattern can be important because it shows sellers have overtaken the buyers and are pushing the price m
FREE
Индикатор соединяет лучшие черты классического осциллятора ADX с адаптивным цифровым фильтром. Индикатор позволяет входить в рынок и выходить из него в самом начале и конце тренда. Индикатор отличается высокой достоверностью сигналов, при этом сохраняя высокую чувствительность. Индикатор не перерисовывается на полностью сформированных барах. Параметры: Ind_Price - цена, используемая для расчета индикатора; Ind_Period - период индикатора. Правила применения: Большая красная точка - сильный медвеж
FREE
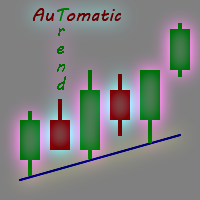
Каждый опытный трейдер знает, что при торговле на форекс стоит обращать внимание на трендовые линии. Но построение трендовых линий отнимает время, а ведь их на графиках еще бывает и несколько… Ужас!!! Хотите узнать как можно легко и просто автоматизировать этот процесс? Тогда читайте дальше. Решение есть — умный и надежный индикатор трендовых линий Automatic Trendline . Все, что от вас требуется, это прикрепить индикатор к графику и он нарисует все возможные трендовые линии вместо вас. Вам остан

Индикатор BB Arrows MTF построен на основе индикатора Bollinger Bands . Представляет собой сигналы на вход в виде стрелок. Все сигналы образовываются на текущем баре. В 2 режимах Сигналы не перерисовываются (Исключение очень резкие скачки) ! Все сигнала в режиме MTF, соответствуют сигналам того периода, который указан в MTF. Максимально упрощен в использовании как для торговли исключительно одним индикатором, так и для использования индикатора в составе Ваших торговых систем. Особенностью ин
FREE

Free Scalping System представляет собой полноценную торговую систему для максимально эффективной торговли в любых рыночных условиях на всех временных масштабах.
Система состоит из двух основных блоков:
1. Блок определения тренда, рассчитывающий динамические уровни сопротивления и поддержки. Для этого блока доступна функция автооптимизации.
2. Блок определения отклонения цены от среднего значения, основанный на большом наборе линий регрессии разного периода для получения статистически достов
FREE

Индикатор помогает определить возможные откаты и развороты Показывает направленность движения цены и раскрашивается в соответствующий цвет. Позволяет вести трендовую и контр трендовую торговлю Работает на всех таймфреймах, на любых валютных парах, металлах и криптовалюте Можно использовать при работе с бинарными опционами Отличительные особенности Не перерисовывается; Простые и понятные настройки; Работает на всех таймфреймах и на всех символах; Подходит для торговли валютами, металлами, опцион
FREE
TIRED OF HAVING TO CALCULATE THE LOTSIZE EVERY TIME?
This indicator will do it for you, WHATEVER ASSET YOU CHOOSE in 10 seconds !!!
INSTRUCTIONS
The things to do in order to activate this indicator will take around 10 seconds once you understand how to use this indicator properly.
Here are the steps to follow:
Place the indicator on the chart of the asset you want to trade on.
Go to " Inputs ".
Enter where you want to set the stop loss .
Choose risk in $ .
You can also
FREE

Traditional Moving Average (SMA, EMA, SMMA, LWMA...) is very useful for identifying trends, but what will you do when you want to trade on lower timeframe, and you need to identify the bigger trend by a higher timeframe; Of course, you can make it by dividing your chart in separated windows, but your analytics will not be clear and intuitive ... That's why we build the Multi Timeframe Moving Average indicator.
With Multi Timeframe Moving Average ( MTF_Moving Average ), you can determine the M
FREE

This indicator is an addition to "Trend Edges."
The "Trend Edges histogram" indicator determines whether the trend is rising or falling. It is suitable for any time frame (tested on DAX).
Find a trending pair, index or CFD. Additionally :
-Sound alert on trend change.
-Alert Notification
-Alert Notification on your mobile phone Check my other indicators.
FREE

Based on the trend-following principle of CCI, it has been improved to become an indicator that can identify the reversal of the trend and its development direction, that is, it can identify the top and bottom attenuation of the oscillating trend in the trend market. feature The red and green columns represent the trend of bullish or bearish development under the current cycle. The blue line shows the position and attenuation of the current price trend in the current cycle. The upper and lower r
FREE

Индикатор Pz Absolute Gains рассчитывает, насколько символ вырос или упал в процентном значении в течение определенного периода времени. Позволяет определить рыночные модели Выявляет ключевые движения цены Отображает состояние перекупленности/перепроданности Индикатор прост в интерпретации... Синяя гистограмма представляет бычьи бары Красная гистограмма представляет медвежьи бары Синяя линия отображает среднее значение бычьего бара Красная линия отображает среднее значение медвежьего бара Серая
FREE

Вот несколько показателей, которые работают вместе. Он в основном работает с движущихся средних и различных уровней ATR создания динамического канала, через который цена осушенных. Как я всегда рекомендую, вы должны попробовать его, прежде чем использовать его вживую, так что вы понимаете, как это работает. Сигнал входа на рынок похож на другие индикаторы MA, но с этим у вас также есть графический анализ момента, когда тренд найден и динамические уровни, чтобы скорректировать стоп-лосс и получит
FREE

Important!! ZO Trend MTF can't work on MN and W1 timeframe. /*--------------------------------------------------------------------------------------------------------------------------------------------------------------------------------------------- ZO TREND : https://www.mql5.com/en/market/product/49138 ZO Trend MTF an indicator used to search for entry point. With the session candle algorithm on many timeframe, ZO Trend creates an area for traders find good Entry Point. ZO SYSTEM BASIC SET

Данный индикатор является интерпретацией Индекса Среднего Направления Движения (Average Directional Movement Index, ADX), который помогает определить наличие ценовой тенденции. Его разработал и подробно описал в книге «Новые концепции технических торговых систем» Уэллс Уайлдер. Данный индикатор отображает на графике цены сигналы при пересечении +DI и -DI и сигналы при падении или росте значения ADX в соотношении к взаимному расположению +DI и -DI. Сигналы индикатора на покупку работают также как
FREE

SKAN This indicator helps you to scan all symbols which are in the Market Watch window and filter out a trend with alerts. It works on five most effective indicators which are used by most of traders for trading: Moving Average Super Trend (ST) Bolinger Band (BB) OPRC BFD It calculates two bars for scanning. When box colour changes to coral or royal blue colour, it indicates you for trend change for long and short entry. And also you will get alert on screen. When it changes to royal blue, it
FREE

The Bolliger Bands On-Off let you control the indicator using the keyboard or a button . You can choose if you want the indicator always shown or always hided while switching among different time frames or financial instruments . ---> This indicator is part of Combo Indicator OnOff
The Bollinger Bands identify the degree of real-time volatility for a financial instruments . A lower amplitude corresponds to a low volatility, conversely a greater bandwidth corresponds to high volatility. N
FREE

Nermal Round Levels is an indicator of round numbers in the form of a grid drawing horizontal lines. You can use it in many ways ... as it could be activating for an expert advisor to enter the market, confirmation of entry for your strategy, entrance area, mark areas of important levels, possible rebounds and others. Place it in your chart and verify as the price respects those round levels.
Inputs GridSpace linecolor lineStyle
FREE

This indicator will monitor all open trades in the account, no matter how many Symbols there are. It will also show the total lotsize for all open trades, and total Profit & Loss for all open trades. It's a very handy tool when you have multiple open trades for multiple symbols. It's mostly to give you a list view of all your open trades in real time, with real time P&L. It will also give you an idea the total lot size that's used in comparison to the account balance.
FREE

This creative simple indicator will provide a precise framework for market sentiment within technical analysis of different timeframes. For instance, for traders like me that uses "Mark Fisher" strategy regularly, this is a perfect indicator for having an insight to markets from short term to long term point of view, using Break points of candles' lows and highs and perfect to combine with "Price Action" . For more options and modifications you can also edit the low timeframe candles withi
FREE
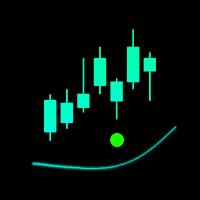
Индикатор предназначен для быстрого скальпинга. Принцип работы индикатора построен на направлении Moving Average. Период и чувствительность Moving Average можно настроить под себя в настройках индикатора. Рекомендую посмотреть моего советника - Night Zen EA
Подпишись на мой telegram канал, ссылка в контактах моего профиля . Преимущества индикатора: Бесплатная версия полная, никаких дополнительных покупок нет Стрелки не перерисовываются, сигнал приходит после подтверждения стратегии Все виды
FREE

Quantum Swing 1.Что такое Quantum Swing ? Индикатор рассчитывает и отображает будущие ценовые уровни , на основе квантовой математики с высокой точностью вероятности и направления . Уровни отображаются в виде зон принятия торговых решений , чётко определяют узкий диапазон цен для выставления ордеров с минимальным стоп-лоссом и максимальным тейк-профитом. Индикатор отображает будущие торговые зоны на разных таймфрэймах H1 , H4 , D , W . Квантовые свинги так же отображаются без привязки к време
FREE

Этот индикатор с несколькими таймфреймами и несколькими символами предупреждает об изменениях цвета Heiken Ashi Smoothed. В качестве бонуса он также может сканировать изменения тренда (цвета) скользящей средней корпуса. В сочетании с вашими собственными правилами и методами этот индикатор позволит вам создать (или улучшить) вашу собственную мощную торговую систему. Функции
Может одновременно отслеживать все символы, отображаемые в окне "Обзор рынка". Примените индикатор только к одному графику

Этот мульти-таймфрейм и мультисимвольный индикатор сканируют на наличие образований поглощения и пинцета. Функции Может одновременно отслеживать все символы, отображаемые в окне "Обзор рынка". Примените индикатор только к одному графику и мгновенно отслеживайте весь рынок. Контролирует каждый временной интервал, от M1 до MN, и отправляет вам предупреждение в реальном времени, когда было обнаружено образование поглощения или пинцета. Поддерживаются все собственные типы предупреждений Metatrader.

Этот мультитаймфреймовый и мультисимвольный индикатор сканирует пин-бары. В сочетании с вашими собственными правилами и методами этот индикатор позволит вам создать (или улучшить) вашу собственную мощную систему. Функции
Может одновременно отслеживать все символы, отображаемые в окне "Обзор рынка". Примените индикатор только к одному графику и мгновенно отслеживайте весь рынок. Can отслеживает каждый временной интервал, от M1 до MN, и отправляет вам предупреждение в реальном времени, когда обна
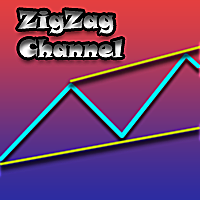
Exclusive Channel on Zig Zag - это канальный индикатор для терминала MetaTrader 4. Данный индикатор строит канал по вершинам стандартного индикатора ZigZag. Если вы торгуете по индикатору ZigZag или по каналам, то Exclusive Channel on Zig Zag это отличный выбор для вас.
Почему стоит выбрать Exclusive Channel on Zig Zag Индикатор прекрасно подходит для скальпинга и торговли внутри дня. Подходит для начинающих и опытных трейдеров. Работает на любых финансовых инструментах и рынках. Работает на л

Introducing the “Symbol Cost Info MT4” indicator – your ultimate tool for staying ahead in the forex market! This innovative indicator is designed to empower traders with real-time cost information, directly on their charts. Here’s why every trader needs the “Symbol Cost Info MT4” in their arsenal: Real-Time Spread Monitoring : Keep a close eye on the spread for any currency pair, ensuring you enter the market at the most cost-effective times. Pip Value at Your Fingertips : Instantly know t
FREE

Gold Pro MT4 is a trend indicator designed specifically for gold and can also be used on any symbol. The indicator does not redraw and does not lag.
Free Dashboard : monitor All pairs and timeframes here: https://www.mql5.com/en/market/product/60431 SETTINGS Factor 1: use to calculate different methods of drawing indicator line Factor 2: use to calculate different methods of drawing indicator line AlertByPopup - true/false popup alerts. AlertBySound - true/fals

Necessary for traders: tools and indicators Waves automatically calculate indicators, channel trend trading Perfect trend-wave automatic calculation channel calculation , MT4 Perfect trend-wave automatic calculation channel calculation , MT5 Local Trading copying Easy And Fast Copy , MT4 Easy And Fast Copy , MT5 Local Trading copying For DEMO Easy And Fast Copy , MT4 DEMO Easy And Fast Copy , MT5 DEMO MACD называется скользящей средней конвергенции и расхождения, которая создается на основе дво
FREE
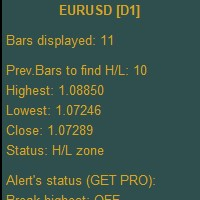
Higher Timeframe Chart Overlay will display higher timeframe candles, including the number of candles high/low you specify.
You no longer need to switch timeframes to check the candles. Everything can be shown in one chart. Get Full Version - https://www.mql5.com/en/market/product/115680 Please feel free Contact me if you have any questions regarding this tool.
FREE
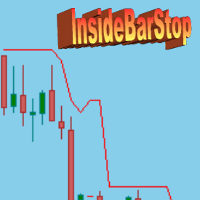
Индикатор предназначен для отображения на графике и визуальной оценки алгоритма трейлинга по внутренним барам "Trailing Stop with Inside Bars", который был впервые предложен знаменитым немецким трейдером и автором Михаель Фойгт (Michael Voigt "Das Grosse Buch дер Markttechnik"). Алгоритм предназначен для фиксирования прибыли при сильных ценовых движениях. Цена трейлинг-стопа показана в виде красной линии. Трейлинг-стоп можно запустить на любом баре графика, указав время открытия необходимой свеч
FREE

BeST_ADX Scalping Strategy is an MT4 Strategy of an Entry and Exit Signals Indicator based on the ADX values that is an excellent tool for scalpers to scalp the currency market multiple times a day for profit .
It is built mainly for scalping purposes although it can also be used as a breakout indicator . Its Signals produce a complete and standalone trading system of impressive results . The indicator comes with a new enhanced Real Time Updated Info and Statistics Panel that can improve its ov

Идея индикатора очень проста и скорее всего пригодится тем, кто используют линейный график для технического анализа. Что-бы устранить "неровности" (-: линейного графика и был написан этот индикатор. Линия графика соединяет цены закрытия свечей, как и в классическом линейном графике, но игнорирует цены, которые шли в направлении линии и новый экстремум возникает только тогда, когда цена закрытия последней свечи явно ниже или выше предыдущего значения. Это облегчает визуальное восприятие при поиск
FREE

RaysFX StochRSI Presentiamo un indicatore MQL4 sviluppato da RaysFX, un rinomato sviluppatore nel campo del trading algoritmico. Questo indicatore è una combinazione semplice ma potente di due indicatori popolari: RSI e Stocastico. Caratteristiche principali: RSI : Un indicatore di momentum che misura la velocità e il cambiamento dei movimenti dei prezzi. Stocastico : Un indicatore di momentum che confronta il prezzo di chiusura di un titolo con la gamma dei suoi prezzi durante un certo periodo
FREE

Индикатор создан чтобы отобразить на графике данные ценовые уровни: Максимум и минимум прошлого дня. Максимум и минимум прошлой недели. Максимум и минимум прошлого месяца. В настройках индикатора, для каждого типа уровней, можно менять стиль линий, цвет линий, включить и отключить нужные уровни. Верcия точно такого же индикатора но только со звуковыми оповещениями тут - Time Levels with Alerts .
Настройки ----Day------------------------------------------------- DayLevels - включение / отключен
FREE
[DESCRIPTION] A Simple Moving Average with period 20 that changes color to green when the price is above the moving average and to red when the price is below the moving average. A simple moving average (SMA) calculates the average of a selected range of prices (closing prices), by the number of periods in that range. The SMA is a technical indicator that can aid in determining if an asset price will continue or reverse a bull or bear trend [WARNING AND RECOMMENDATIONS] Trading Forex and
FREE

the AK CAP toolbox free to use;
it includes the same indicators we use for our daily trading and we think the simpler the better. Lightweight indicator for use on all timeframes. that includes VWAP with vwap value indicator on top right. 3 EMA: FAST, MEDIUM, SLOW the candle timer to show how much time left in a candle.
colors and positions are fully customizable.
enjoy
FREE

Целью этой новой версии стандартного MT4 индикатора, входящего в поставку платформы, является отображение в подокне нескольких таймфреймах одного и того же индикатора. См. пример, приведенный на рисунке ниже. Однако индикатор отражается не как простой индикатор MTF. Это реальное отображение индикатора на его таймфрейме. Доступные настройки в индикаторе FFx: Выбор таймфрейма для отображения (от M1 до MN) Установка ширины (количество баров) для каждого окна таймфрейма Всплывающее оповещение/звуков
FREE

Данный индикатор непрерывно изменяет цвет окантовок и тел свечей, а также цвет объёмов в реальном времени. Индикатор прост в применение. Палитра цветов разнообразна. Данный продукт является графическим решением поэтому сложно описывать что он делает текстом, это легче увидеть скачав его, к тому же продукт бесплатный. Индикатор подойдёт блогерам, которые хотят создать красивую картинку графика для видеомонтажа или трейдерам которые хотят сделать свой график живым, меняющим цвет в реальном времен
FREE

Индикатор теней.
Отображает размер теней свечей, в пунктах, в виде гистограммы. Работает в трех режимах, на выбор пользователя. Описание настроек индикатора Mode - режимы работы индикатора, три режима: первый height - режим отображения верхних и нижних теней свечей; второй difference - режим отображения разницы теней свечей, разница между верхней и нижней тенью свечи; третий superiority - накопленная разница теней свечей за один торговый день, режим не работает на периоде большем 4 часа.
FREE

Данный индикатор отображает графики "Крестики-нолики". Графики "Крестики-нолики" показывают только те движения цены, которые превышают установленный размер. Индикатор помогает удалить шумы и сосредоточиться на основных трендах. Здесь время не имеет значения. Учитываются только движения цен. Поэтому график "Крестики-нолики" не синхронизирован с основным графиком, на который установлен индикатор. Узнайте больше о графиках "Крестики-нолики": http://stockcharts.com/school/doku.php?id=chart_school:ch
FREE
Highly configurable OBV indicator.
Features: Highly customizable alert functions (at levels, crosses, direction changes via email, push, sound, popup) Multi timeframe ability Color customization (at levels, crosses, direction changes) Linear interpolation and histogram mode options Works on strategy tester in multi timeframe mode (at weekend without ticks also) Adjustable Levels Parameters:
OBV Timeframe: You can set the lower/higher timeframes for OBV. OBV Bar Shift: Y ou can set the offs
FREE
An indicator for analyzing different currency pairs simultaneously Forex is a complex market that requires several currency pairs to be analyzed simultaneously Determine the number of currency pairs yourself Determine the currency pair you want to analyze to analyze 4 of the most important and similar currency pairs at the same time. For direct and simple analysis, some currency pairs have changed (EURUSD>>>USDEUR) Do not doubt that to succeed in this market, you must analyze several currency pa
FREE

The selective pin bar is designed to identify reversals. To use the selective pin bar effectively, traders typically look for Strong Rejection: The tail of the pin bar should extend significantly beyond the surrounding price action. It indicates that there was a sharp rejection of higher or lower prices during the trading period. A strong rejection suggests that the market sentiment may be changing.
FREE

RSI Bands is a powerful indicator which displays an upper and lower band corresponding to the RSI overbought and oversold levels. The band shows what price must be reached during that specific candle in order for the RSI overbought/oversold level to be reached. This is an extremely useful tool for spotting when a trend has begun and when a trend is about to end. The indicator provides buffers, allowing you to use it in your own Expert Advisor. Please message me if you have any questions.
CURRE
FREE

TPSpro Screenshot это и ндикатор который скринит рабочее пространство графика и сохраняет его в заданную вами папку на компьютере с заданным разрешением и с заданным интервалом времени. Имеются следующие настраиваемые параметры: Screenshot Width - Ширина скриншота Screenshot Height -Высота скриншота The name of the folder for screenshots (by pressing "]") - Имя папки для скриншотов Rewritable File Name - Имя перезаписываемого файла Step in seconds for a photo - Шаг в секундах для фото Creat
FREE

Candlestick Oscillator is a truly unique Oscillator that uses the concepts of within candlestick trading called the Record Session High. This is a method of analysing candlesticks to gauge when a trend might be wearing out and therefore ready for reversal or pause. We call it a record session high when we get 8 or more previous candles that have higher closes. We call it a record session low when we get 8 or more previous candles that have lower closes.
We don't rely on the typical Oscillatio
FREE
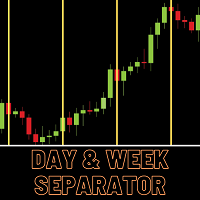
Day and Week separator is a very simple tool to show day and week separator lines from a specific time mentioned in the input. This is specially helpful for the trades who has time zone differences in their broker terminal. Let us take an example If user know that at 7:00 in the chart his local time 00:00 then he will simply put 7:00 in the input . Separator lines will starts drawing from current day's 7:00 There is also a bold line for weekly separator
FREE

5/35 Oscillator to be used with our Elliott Wave Indicator as part of the overall strategy on trading the 5th wave. The Elliott Wave Indicator Suite is designed around a simple but effective Swing Trading Strategy. The Indicator Suite is great for Stocks, Futures and Forex trading on multiple timeframes You can find the main Elliott Wave Indicator here https://www.mql5.com/en/market/product/44034
FREE

ADR 20 mostra l'intervallo medio di pips di una coppia Forex, misurato su un numero di 20 giorni . I traders possono utilizzarlo per visualizzare la potenziale azione dei prezzi al di fuori del movimento medio giornaliero.
Quando l'ADR è al di sopra della media, significa che la volatilità giornaliera è superiore al normale, il che implica che la coppia di valute potrebbe estendersi oltre la sua norma.
L'ADR è utile anche per il trading di inversioni intraday. Ad esempio, se una coppia di v
FREE

This is a Dashboard Scanner for finding good trades using the GMMA method as base and TDI method for trend verification. All buttons for all Pairs and Timeframes are clickable and will change the chart for you to that Symbol/TimeFrame. Green "G-Buy" button means good Buy Trend and Red "G-Sell" button means good Sell Trend. Gray "G" means just a cross has happened but trend is not strong enough yet.
Read scanner common settings: https://www.mql5.com/en/blogs/post/747456
How Scanner finds th

LotSize Indicator Discover the appropriate lot size to use in your trades based on the available margin. This indicator provides valuable information for risk management. If the indicator shows a value of 0, it means that your balance or available margin is insufficient for trading. It is important to maintain adequate margin levels for safe trading practices. This indicator is exclusively designed for the MT4 platform, a popular and reliable trading platform in the market. With the LotSize Indi
FREE

Introduction and Description
Colored candlesticks showing the trend based on two moving averages and the slope of the slow moving average. A trend is the overall direction of a market or an asset's price. In technical analysis, trends are identified by trendlines or price action that highlight when the price is making higher swing highs and higher swing lows for an uptrend, or lower swing lows and lower swing highs for a downtrend. Many traders opt to trade in the same direction as a trend, whi
FREE

Draws Daily, Weekly and Monthly pivots and the respective supports and resistances levels (S1, S2, S3, R1, R2, R3). Ideal for placing stop losses and/or using as a break-out strategy. Features Unlike other pivot indicators in market you get very clean charts. Pivot levels are plotted irrespective of timeframe, on which you trade, i.e. M1, M5, M15, M30, H1,H4 or Daily timeframes. Pivot levels do not change when you change timeframe. Fully customizable options. If you are looking at Fibonacci
FREE
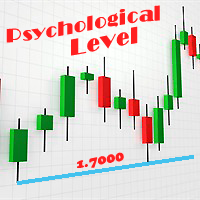
Psychological levels - это индикатор для платформы MT4. Трейдинг на валютной бирже очень тесно связан с психологией, именно психологические факторы часто вызывают всплески спроса или предложения, что не может не отразится на движении курса валют. Цена на форекс обычно движется в определенном ценовом коридоре, часто границами такого коридора служат так называемые психологические уровни. Где находятся подобные уровни, и на чем основано их формирование? Психологические уровни форекс появляются в ра

MTF Heiken Ashi MA - мультитаймфреймовый индикатор Heiken Ashi и скользящей средней. Полностью настраиваемый индикатор для продвинутых и уникальных расчетов Heiken AshiHeiken Ashi и скользящей средней (HA-Bodies).
Основные возможности Три значения баров на истории - закрытия, максимума и минимума. Мультитаймфреймовый характер; особенно полезно для свинговых стратегий. Не перерисовывается; хороший инструмент для скальперских стратегий.
Входные параметры Timeframe = PERIOD_CURRENT - таймфрейм
FREE

This indicator gives you the Moving Average based on Renko chart. A Renko chart is a type of chart that is built using price movement rather than both price and standardized time intervals like most charts are. A Moving Average based on Renko chart is considered less noisy since it is not based on the time and only based on price change. You can see my free enhanced Renko indicator here .
Inputs: Box Size: Renko box size based on market Points.
Period: Moving Average Period
Method: Mov
MetaTrader Маркет - уникальная площадка по продаже роботов и технических индикаторов, не имеющая аналогов.
Памятка пользователя MQL5.community расскажет вам и о других возможностях, доступных трейдерам только у нас: копирование торговых сигналов, заказ программ для фрилансеров, автоматические расчеты через платежную систему, аренда вычислительных мощностей в MQL5 Cloud Network.
Вы упускаете торговые возможности:
- Бесплатные приложения для трейдинга
- 8 000+ сигналов для копирования
- Экономические новости для анализа финансовых рынков
Регистрация
Вход
Если у вас нет учетной записи, зарегистрируйтесь
Для авторизации и пользования сайтом MQL5.com необходимо разрешить использование файлов Сookie.
Пожалуйста, включите в вашем браузере данную настройку, иначе вы не сможете авторизоваться.