Смотри обучающее видео по маркету на YouTube
Как купить торгового робота или индикатор
Запусти робота на
виртуальном хостинге
виртуальном хостинге
Протестируй индикатор/робота перед покупкой
Хочешь зарабатывать в Маркете?
Как подать продукт, чтобы его покупали
Новые технические индикаторы для MetaTrader 4
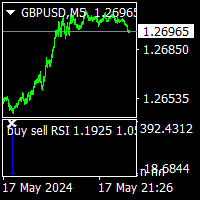
buy sell RSI is rsi version of buy sell star indicator. thise indicator no repaint and all pairs all timeframe indicator.
it need minimum 500 bars on charts. when the white x sign on the red histogram that is sell signals. when the white x sign on the blue histogram that is sell signals. this indicator does not guarantie the win.price can make mowement on direction opposite the signals. this is multi time frame indicator and need to look all time frames. sometimes after 1h buy signal ,sel

Range Breakout with Multi Symbol Lookup Options
Enhance your trading strategy with our cutting-edge Forex Range Breakout Indicator! This versatile tool is designed to provide precise breakout signals and comprehensive analysis to help you make informed trading decisions. Discover the features that make our indicator a must-have for any forex trader: Key Features: Range Breakout Time-Based Analysis: Accurately identifies breakout levels based on specific time ranges, allowing for timely and str

"M1 scalping signal" - скальпинговый индикатор для периода М1. Индикатор показывает стрелками на графике, точки разворота цены. Красная стрелка показывает разворот цены на продажу, а зеленая стрелка показывает разворот цены на покупку. Можно использовать на всех валютных парах. Преимущества: Без перерисовки: Индикатор не перерисовывает сигналы на исторических данных, обеспечивая стабильность анализа. Простота использования: Легко настраивается и визуализирует важные точки разворота на графике.
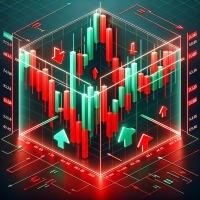
Precision Trend Signals - индикатор, который стрелками на графике показывает точки разворота цены. Зеленая стрелка показывает, когда цена развернется вверх, а красная стрелка показывает, когда цена развернется вниз. Индикатор можно использовать на любых таймфреймах и любых валютных парах. Стратегия торговли с этим индикатором следующая:
когда появляется зеленая стрелка, закрываем ранее открытую (если есть открытая) сделку на продажу и открываем сделку на покупку. когда появляется красная стре
Этот индикатор нарисует вам следующие уровни:
Дневная открытая линия: внизу – медвежий рынок, вверху – бычий. Средний дневной диапазон: максимум и минимум Азиатский рынок: взлеты и падения Вчерашний максимум и минимум Эти уровни являются сильными уровнями поддержки и сопротивления, на которые каждый должен обратить внимание.
Если вы не использовали время, чтобы начать! Вам нужно обратить внимание, когда цена приближается к этим уровням!
Наслаждайтесь торговлей, которая стала проще!
FREE

Market Noise
Market Noise - это индикатор, который определяет фазы рынка на графике цены, а также выделяет чёткие плавные трендовые движения от шумных флетовых движений, когда происходит фаза аккумуляции или дистрибьюции. Каждая фаза хороша для своего вида торговли: тренд для трендследящих систем, а флет - для агрессивных. Когда начинается рыночный шум, можно принимать решение о выходе из сделок. Точно также и наоборот, как только шум заканчивается - нужно отключать агрессивные торговые

ATR является важным показателем для любого финансового рынка. Аббревиатура ATR означает Средний Истинный Диапазон (Average True Range). Этот индикатор является инструментом, для определения волатильности рынка, это его прямое назначение. ATR показывает средний ход цены за выбранный нами период времени. Начальная цена индикатора 63$. Цена будет увеличиваться каждые 10 продаж до 179$ Оригинальный индикатор ATR есть во многих программах для трейдинга. Индикатор ATR не очень информативен, поэтому я
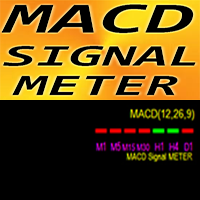
Forex Indicator MACD Signal METER for MT4 Very useful MACD Signal METER indicator is showing current MACD value (above/below Signal) for 7 time frames simultaneously Green box - MACD is above Signal Red box - MACD is below Signal Forex Indicator MACD Signal METER can be used as trade entry filter for Multi Time Frame trading
// More great Expert Advisors and Indicators are available here: https://www.mql5.com/en/users/def1380/seller // Also you are welcome to join to profitable
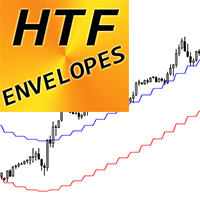
Forex Indicator "HTF Envelopes" for MT4 Upgrade your trading methods with the professional HTF Envelopes for MT4. H TF means - H igher Time Frame Envelopes is one of the best trend indicator on the market - perfect tool for trading It is used to help traders to identify extreme overbought and oversold conditions as well as trading ranges. HTF Envelopes indicator is excellent for Multi-Time Frame trading systems with Price Action entries or in combination with other indicators. I
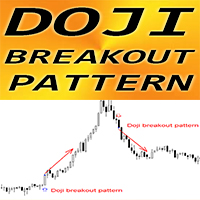
Forex Indicator " Doji Breakout pattern" for MT4 Indicator "Doji Breakout pattern" is pure Price Action trading: No repaint, No delays; Indicator detects breakout of Doji pattern into the trend direction where Doji candle is in the middle of the pattern and the last candle is breakout one: Bullish Doji Breakout pattern - Blue arrow signal on chart (see pictures) Bearish Doji Breakout pattern - Red arrow signal on chart (see pictures) P C, Mobile & Email alerts are included

Forex Indicator "Trend Entry Histogram" for MT4 Trend Entry Histogram indicator can be used for search of entry signals into the trend direction once Entry bar appears This indicator has unique feature - it takes both: price and volume for calculations Trend Entry Histogram can be in 2 colors: red for bearish trend and blue for bullish one . Once you see steady trend (minimum 10 consecutive histogram bars of the same color) - wait for entry bar Entry signal is 1 column with oppos
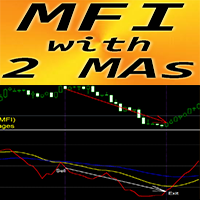
Forex Indicator "MFI and 2 Moving Averages" for MT4 M oney Flow Index (MFI) is a technical oscillator which uses price and volume data for identifying oversold and o verbought zones " MFI and 2 Moving Averages" Indicator allows you to see Fast and Slow Moving Averages of MFI oscillator Indicator gives opportunities to see the trend change very early It is very easy to set up this indicator via parameters, it can be used on any time-frame You can see Buy and Sell entry cond
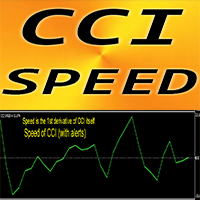
Forex Indicator " CCI Speed" for MT4 The calculation of this indicator is based on equations from physics. CCI Speed is the 1st derivative of CCI itself Commodity Channel Index (CCI) measures the difference between the current price and the historical average price
CCI Speed is good for scalping entries into the direction of main trend: u se it in combination with any suitable trend indicator CCI Speed indicator shows how fast CCI itself changes its direction - it is very sensit
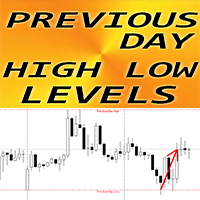
Forex Indicator "Previous Day High Low levels" for MT4 Indicator "Previous Day High Low levels" is very useful auxiliary indicator Yesterday High and Low levels are so important because price very often rebounds from them These levels can be considered as reliable Support and Resistance - price respects them very much It is useful indicator for intraday traders to who use Reversal trading methods and scalping Very good to combine with Price Action as well // More great Expert Advisors and I

Forex Indicator " ATR Trailing Stop" for MT4 Upgrade your trading methods with great auxiliary ATR Trailing Stop indicator for MT4. This indicator is perfect for Trailing Stop purpose ATR Trailing Stop is automatically adaptive to market volatility No delays and easy set up This indicator is excellent to combine with price action entries into the direction of main trend // More great Expert Advisors and Indicators are available here: https://www.mql5.com/en/users/def1380/seller //

Представляем вашему вниманию индикатор "Счётчик закрытия свечи", который станет вашим незаменимым помощником в мире трейдинга. Вот почему знание того, когда свеча закроется, может помочь: Если вы любите торговать, используя свечные паттерны, то вы будете знать, когда свеча будет закрыта. Этот индикатор позволит вам проверить, сформировался ли известный шаблон и есть ли возможность торговли. Индикатор поможет вам подготовиться к открытию рынка и закрытию рынка. Вы можете установить таймер, чтобы

Индикатор Ренко (Renko) - это инструмент технического анализа, используемый на форекс-рынке для визуализации ценовых движений и трендов, устраняя рыночный "шум". В отличие от традиционных свечных или баровых графиков, Ренко строится на основе изменения цены на заданное количество пунктов, называемое "размером кирпича". Когда цена движется на это количество пунктов, добавляется новый "кирпич" в диаграмму. Этот индикатор игнорирует время и объем, концентрируясь исключительно на ценовых изменениях.
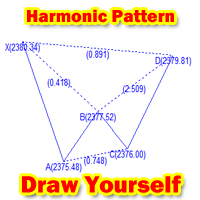
Are you a harmonic trader?
Are you still troubled by having to go to a T website to draw the harmonic index XABCD?
This tool for drawing harmonic indicators on MT4 is just for you!
Instructions: After loading the indicator on MT4, you can set the X postion and Y postion of the indicator. And the color of the line drawn by XABCD (default is blue) After loading the indicator, if postion have not changed, a "Draw" button will appear in the lower right corner by default. After the button

PrecisionWedge Detector X
Description: PrecisionWedge Detector X is an innovative indicator designed to identify and analyze wedge patterns on financial charts with unparalleled accuracy and precision. Developed using advanced algorithms, this indicator provides traders with a powerful tool to detect potential trading opportunities based on wedge formations. Key Features: Automatic Wedge Detection: Powered by sophisticated algorithms, PrecisionWedge Detector X automatically scans price data to
FREE
Уверенная торговля с помощью уровней поддержки и сопротивления! Представляем вашему вниманию индикатор "Уровни поддержки и сопротивления" , который станет вашим незаменимым помощником в мире трейдинга. Индикатор автоматически определяет ключевые уровни поддержки и сопротивления , на основе которых вы сможете: Совершать точные сделки: Вход в рынок на уровнях поддержки и сопротивления значительно повышает шансы на успешную торговлю. Определять трендовые движения: Прорыв или отскок от уровне

Представленный индикатор наглядно и очень точно отображает текущий тренд, его начало и завершение. Индикатор в том числе используется для идентификации уровней поддержки/сопротивления. Принцип работы индикатора основан на другом популярном и проверенном временем индикаторе - Bollinger Bands. Индикатор позволяет отправлять уведомления на мобильный терминал и электронную почту. Настраиваемые параметры: Bollinger Bands Period Bollinger Bands Deviation Offset Factor Alerts - отображает диалоговое о

AdvaneZigZag Indicator
Are you tired of the limitations of the traditional ZigZag indicator? Meet AdvaneZigZag, the ultimate tool to simplify your market structure analysis and enhance your trading strategies. Designed with flexibility and precision in mind, AdvaneZigZag brings you advanced features to navigate the market with confidence.
Key Features:
1. Enhanced Flexibility:
- While maintaining the familiar simplicity of the conventional ZigZag indicator, AdvaneZigZag offers superi
FREE

Indicator ini memudahkan kita untuk memantau Trend Aligator secara Multi Time Frame dalam 1 layar tanpa perlu berpindah pindah time frame pada mt4
Untuk cara penggunakan indicator ini sebagai berikut : 01. Cek Multi Time Frame Monitoring untuk Trade Harian ( Cek D1, H4 , H1 jika 1 arah buy kita Fokus pada pattren buyyer untuk follow tren Time Frame H1 ) 02. Cek Multi Time Frame Monitoring untuk Trade 4 Jam( Cek H4, H1 , M30 jika 1 arah buy kita Fokus pada pattren buyyer untuk follow tren Time

This indicator is the converted Metatrader 4 version of the TradingView indicator "ATR Based Trendlines - JD" by Duyck. This indicator works by automatically and continuously drawing trendlines not based exclusively on price, but also based on the volatility perceived by the ATR. So, the angle of the trendlines is determined by (a percentage of) the ATR. The angle of the trendlines follows the change in price, dictated by the ATR at the moment where the pivot point is detected. The ATR percentag
FREE

The indicator defines the buy and sell arrows with high performance and consistent results. Suitable for trend trading or following the trend. Automatic analysis of market opportunities ; Help traders earn more from their investments;
Never repaints, recalculates or backpaints signals; This is FREE demo version of the indicator and works only on "EUR USD M15" . The demo version does not work on SUFFIX OR PREFIX brokers ! Forex Trend Commander All details about the indicator here :
FREE

The Zigzag Indicator is a powerful tool, developed to assist traders in identifying market trends by highlighting significant highs and lows of a trade. It is designed with the flexibility to adjust to fluctuating market conditions and to filter the minor price fluctuations in the market to focus on substantial ones.
The Zigzag Indicator adheres only to movements that meet a specific percentage or a defined number of points, allowing it to weed out minor price movements and focus solely on
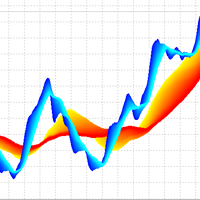
3D Trend Indicator is a non-repaint indicator using multiple moving averages with a 3D surface view. By using this indicator, you can remove uncertainties that can happen using a single and fixed moving average period. You can use a cloud area using a range of moving average periods. Also a wide range of visual settings are added to this indicator to have a better view from the cloud area. Alert and notification system added to the indicator to inform the trader about the action of candles on t

MACD芸者はMACDのダイバージェンスを利用した 裁量トレード用サインツールです。
高勝率かつ 高頻度 で サインを発信しますが、各種の強力なフィルターにより、さらに精度の高いサインに絞ることが出来ます。また、通常のダイバージェンスに加えリバーサル( 隠れダイバージェンス) によるサイン発信も可能です。
全通貨ペア、全タイムフレームで利用できます。勝敗判定機能により、このインディケータの直近の相場環境に対する有効性を確認できます。
設定項目は以下の通りです。 Enable Divergence...MACDのDivergenceによるサインの発信を有効にします。ピンクの矢印が表示されます Enable Reversal...MACDのReversal(Hidden Divergence)によるサインの発信を有効にします 。ブルーの矢印が表示されます Fast EMA Periods...以下でMACDのパラメーターを指定します Slow EMA Periods Signal SMA Periods Trend Filter...以下で設定する移動平均のトレンド方向でのシ
Indicator ini memudahkan kita untuk memantau Trend BBMA Multi Time Frame dalam 1 layar tanpa perlu berpindah time frame
Tentukan arah trading menggunakan indicator yang kami sedikan dengan cara : 01. Cek Multi Time Frame Monitoring untuk Trade Mingguan ( Cek W1, D1, H4 ) jika Time Frame H4 Membentuk Full Setup bbma Fokus Pada Reentry )
02. Cek Multi Time Frame Monitoring untuk Trade Harian ( Cek D1, H4, H1 ) jika Time Frame H1 Membentuk Full Setup bbma Fokus Pada Reentry )
03. Cek Mu

- It is 35$ now - 50% Discount (Real price is 70$) Contact me for instruction, any questions! Introduction Chart patterns are an essential tool traders and investors use to analyze the future price movements of securities. One such pattern is the triple bottom or the triple top pattern, which can provide valuable insights into potential price reversals. This pattern forms when a security reaches a low price level three times before reversing upward or reaches a high price level three time

Binarias & Forex (+90% Ratio-Win Next Candle) Espere que el precio llegue a una buena zona (fuerte) sea soporte, resistencia, zona de oferta o demanda, fibonacci level key, cifra redonda. Haciendo lo anterior definitivamente habrá una reversión en el precio y obtendrá su ITM en primera vela dando una efectividad del 100% siguiendo la tendencia. Es muy importante estar atento a las noticias fundamentales en el mercado y estas no afecten tu trading. Sesiones comerciales: cualquiera (24 horas).

Namiri Trade Engine is an ALL in ONE trading system that combines market structure, volume pressure, market condition & risk management to give you the BEST opportunities for A+ trade setups with auto lot size WAIT FOR YOUR A+ SETUP || ONLY TAKE YOUR A+ TRADE || RINSE REPEAT YOUR A+ MOVE
Chart Features
Panel - Shows the asset, market, price, pip, account, trade & profit|loss information Structure - Shows areas of support & resistance Risk Management - Shows risk analysis period of 100 bars,

74% discount for the next 10 buyers (original price $605): 1 left
Get a 50% bonus by buying (or even renting) any of our products. After buying (or renting), send a message for more information. 3 Indicators in 1 indicator
Strategy based on price action
Made specifically for the best forex currency pairs
Can be used in the best time frame of the market
at a very reasonable price This indicator is basically 3 different indicatos . But we have combined these 3 indicators in 1 indicator so th
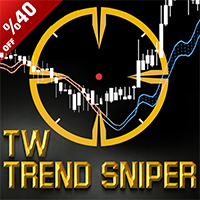
Представляем индикатор «TW Trend Sniper» , мощный индикатор, который используется для определения основных тенденций с использованием эксклюзивной формулы индикатора «Trade Wizards», а также использования ценового действия, обнаружения валютных торговых сессий, функций Фибоначчи и обнаружения, а также методы удаления шума искусственного интеллекта с высокой точностью. эта стратегия, разработанная «группой Trade Wizards», состоящей из опытных трейдеров и опытных программистов, теперь

Best strategy,
Easy trade ,
Support of version update in the future MT My Way: develop for new traders with no experience It is a very simple trade. Open the order when there is signal
and close the order when there is exit or found the next opposite signal. For experienced traders, It will be very easy to trade.
TRADE: Forex
TIME FRAME: All Time Frame
SYMBOL PAIR: All Symbol
SETTINGS:
CALCULATE BARS: Value or bars used must be large enough to calculate the formula. Fo

Graf Mason - инструмент который зделает из вас профессионального аналитика! Метод определения волновых движений при помощи наклонных каналов,качественно передаёт схематику движения любого инструмента,показывая не только возможные развороты на рынке,но и цели дальнейших движений!Разрушает миф о том что рынок живой ,чётко показывая схематику движениями от одного диапозона к другому! Профессиональный инструмент,подходит для среднесрочной перспективы с определением текущего тренда!

С помощью этого торгового инструмента вы можете одновременно сканировать 15 рынков.
Представляем новый торговый индикатор 2024:
️ Панель мониторинга: мультивалютный мультитаймфрейм, двойной RSI.
Есть как минимум две причины, по которым я создал этот торговый инструмент:
Во-первых, мне надоело наблюдать только за одним рынком. Во-вторых, я не хочу упустить момент входа на другой рынок.
Вот почему я хочу одновременно знать и другие рыночные условия.
По этой причине мне нужен сканер,

Introduction
The "Smart Money Concept" transcends mere technical trading strategies; it embodies a comprehensive philosophy elucidating market dynamics. Central to this concept is the acknowledgment that influential market participants manipulate price actions, presenting challenges for retail traders.
As a "retail trader", aligning your strategy with the behavior of "Smart Money," primarily market makers, is paramount. Understanding their trading patterns, which revolve around supply
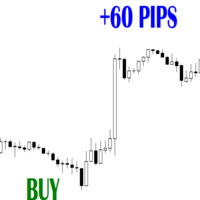
Другие инструменты для увеличения объема, которые можно объединить: https://www.mql5.com/en/market/product/72744 Идентификация экстремумов большого объема: позиционируйте индикатор как мощный инструмент для трейдеров, позволяющий точно определять периоды интенсивного давления покупателей или продавцов. Подчеркните, как основной буфер индикатора, использующий объем, помогает трейдерам выявлять всплески объема, которые указывают на повышенную рыночную активность. Подчеркните значение этих экстре

Contact me after payment to send you the user manual PDF file. Introduction Introducing the Wolfe Pattern Indicator, a powerful tool designed to help traders identify and capitalize on the elusive Wolfe Pattern in financial markets. This innovative indicator uses advanced algorithms to scan for the Wolfe Pattern in all symbols and time frames, providing traders with a unique edge in the market. How to trade with the Wolfe Pattern The Wolf Pattern is a rare and lucrative trading opportunity that
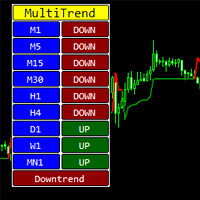
Индикатор показывает направление тренда на разных таймфреймах. Таймфреймы можно отключать в настройках. Нижняя строка индикатора сообщает о превалирующем тренде - вверх или вниз. Индикатор можно использовать на любых торговых инструментах - валютах, акциях, фьючерсах, индексах, металлах, криптовалютах. Данный индикатор можно использовать как самостоятельную торговую систему или как дополнение к другой системе.
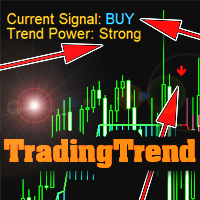
Индикатор не перерисовывается.
Можно использовать как уже готовую торговую стратегию. Показывает: Направление тренда; Силу тренда; Точки разворота или затухания тренда. Настройки: Trend sensitivity (the lower, the more accurate) - чувствительность работы (чем выше, тем точнее); Calculation method - метод расчета; Info position - угол расположения инфо-надписи (или убрать); Text Color - цвет текста; Trend Color Buy - цвет БАЙ-текста; Trend Color Sell - цвет СЕЛЛ-текста; Sound Alert - Всплывающ
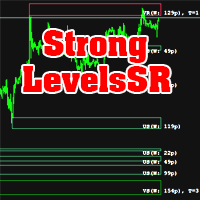
Индикатор рассчитывает уровни подержки и сопротивления. В левом верхнем углу находится подсказка. Эту подсказку можно убрать. Подсказка на двух языка (английский и русский). Показывается ширина уровней поддержки и сопротивления. Отображается количество касаний уровней. Работает на всех таймфреймах. Можно использовать как самостоятельную торговую систему, так и как дополнение к другой системе. Скачайте демо-версию индикатора прямо сейчас и испытайте ее в тестере стратегий!
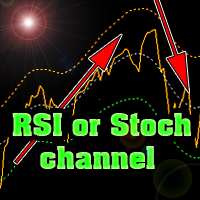
Индикатор строит уровни Стохастик или РСИ в ценовом канале торгового инструмента. Скачайте индикатор БЕСПЛАТНО прямо сейчас и проверьте его в тестере стратегий. Легко определять направление тренда и уровни перекупленности или перепроданности.
Настройки стандартные для и любого из этих индикаторов.
Имеется возможность изменения настроек для каждого торгового инструмента отдельно.
Можно использовать валют, рынка акций, фьючерсов или криптовалют. Индикатор можно использовать как самостоятель

hint: my basic indicators are used like that KingLevel combind with KingSequence will provides basic insights of the price action of the markets and KingSequenceSgn is just for the convienent for watching. And plus with Forex Trading mentor subsccription I will assist you to win the market at first later if it's great will be upgraded to King Forex trading mentor.
Introducing the K-Level Indicator: A Powerful Tool for Unveiling Hidden Trading Opportunities In the dynamic world of trading, i
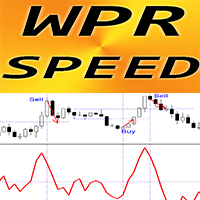
Forex Indicator "WPR SPEED" for MT4 - great predictive tool! The calculation of this indicator is based on equations from physics . WPR SPEED is the 1st derivative of WPR oscillator itself WPR SPEED is good for scalping entries on sideways and flat markets WPR SPEED indicator shows how fast WPR itself changes its direction - it is very sensitive It is recommended to use WPR SPEED indicator for momentum scalping trading strategies: find big size peaks of indicator - open scalping t
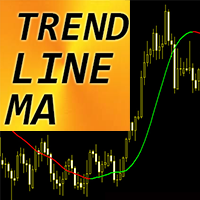
Forex Indicator "Trend Line Moving Average" for MT4 Trend Line MA - is the next generation of Moving Averages! Advanced new calculation method is used. Indicator shows trends without delays. It is much faster and clear than standard SMA, EMA and LWMA indicators. There are plenty of opportunities to upgrade even standard strategies with this indicator. Green color means Bullish trend. Red color - Bearish trend. // More great Expert Advisors and Indicators are availabl
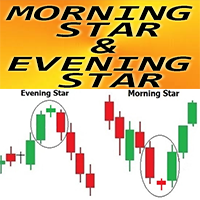
Forex Indicator " Morning Star and Evening Star pattern" for MT4 Indicator "Morning Star and Evening Star pattern" is very powerful indicator for Price Action trading: No repaint, No delays; Indicator detects Morning Star and Evening Star patterns on chart: Bullish Morning Star pattern - Blue arrow signal on chart (see pictures) Bearish Evening Star pattern - Red arrow signal on chart (see pictures) P C, Mobile & Email alerts are included Indicator " Morning Star and Evening Star
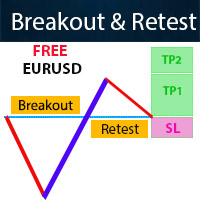
Contact me for any questions All Symbols version! It is free on EURUSD chart. Introduction The breakout and retest strategy is traded support and resistance levels. it involves price breaking through a previous level. The strategy is designed to help traders do two main things, the first is to avoid false breakouts. Many false breakouts start with a candlestick that breaks out of a level but ends with an immediate candlestick that brings the price back into the level. The second thing that the
FREE
This indicator is not an EA,so it does not have the 'ORDER' function. It only simulates placing orders, so please use it with confidence.
Instructions for use: |←:Choice Bar. →:Start.You can also press the 'X' key on the keyboard to go back and the 'Z' key to go forward. X1:Bar Speed. →|:Back to current time.
Note: If you pull too far forward in the big period, Bar in the small period may not read that far forward. At this time, you must first reduce the picture to the minimum, then press a
Индикатор определяет значение ATR (пунктов) классическим способом (с учетом паранормальных баров/свеч) и более корректно - игнорируя паранормальные движения инструмента. Правильно применять Индикатор это исключать из расчета паранормальные бары, игнорируя как чрезвычайно маленькие бары (менее 5% стандартного ATR) так и чрезвычайно большие бары (более 150% стандартного ATR). Расширенная версия - позволяет задавать параметры расчета и множество других входных параметров. Версия для МТ5

hint: my basic indicators are used like that KingLevel combind with KingSequence will provides basic insights of the price action of the markets and KingSequenceSgn is just for the convienent for watching. And plus with Forex Trading mentor subsccription I will assist you to win the market at first later if it's great will be upgraded to King Forex trading mentor.
It just the main chart sign of the "KingSequence" indicator.
Here is the detals from the "KingSequence" indicator
Slide 1: Ti

- It is 30$ now - 50% Discount (Real price is 60$) Contact me for instruction, any questions! Introduction Triangle chart patterns are used in technical analysis , which is a trading strategy that involves charts and patterns that help traders identify trends in the market to make predictions about future performance.
Triangle Pattern Scanner Indicator It is usually difficult for a trader to recognize classic patterns on a chart, as well as searching for dozens of charts and time frames w
Представленный продукт является эффективным трендовым индикатором который в зависимости от настроек может использоваться как для краткосрочной торговли (скальпинга) так и для среднесрочных/долгосрочных торговых стратегий. Простота использования индикатора делает его хорошим выбором как для новичков так и для опытных трейдеров. Суть индикатора NRTR (Nick Rypock Trailing Reverse) заключается в том, что он всегда находится на постоянном удалении от достигнутых экстремумов цен – под графиком на вос
Highly configurable Trader Dynamic Index (TDI) indicator.
Features: Highly customizable alert functions (at levels, crosses, direction changes via email, push, sound, popup) Multi timeframe ability (higher and lower timeframes also) Color customization (at levels, crosses, direction changes) Linear interpolation and histogram mode options Works on strategy tester in multi timeframe mode (at weekend without ticks also) Adjustable Levels Parameters:
TDI Timeframe: You can set the lower/higher
FREE

High and Low Levels EMA Технический индикатор в помощь трейдеру. Однажды пришла идея при изучении индикатора Moving A verage ( MA ).
Так как мувинги эти сглаженное, среднее значения цены за выбранный период, то как и у обычной цены и у мувинга
должны быть «хаи и лои».
Данный индикатор, показывает уровни High и Low . Динамических уровней поддержки и сопротивления.
О понятии High и Low .
Хай — от английского high — обозначает наиболее высокую цену («рынок на хаях » — капитализ
FREE

This indicator will show week and monthhigh low, very useful to understand the market sentiment. To trade within the range/ break out. Low- can act as support- can used for pull back or break out High- can act as resistance- can used for pull back or break out Breakout strategy refers to the day trading technique that provides traders with multiple opportunities to go either long or short . The main idea is to identify the trend in its most juicy state followed by a trending move.
FREE

hint: my basic indicators are used like that KingLevel combind with KingSequence will provides basic insights of the price action of the markets and KingSequenceSgn is just for the convienent for watching. And plus with Forex Trading mentor subsccription I will assist you to win the market at first later if it's great will be upgraded to King Forex trading mentor.
Slide 1: Title Slide Title: Unveiling Market Rhythms with Advanced Price Momentum Analysis Subtitle: A Revolutionary Trading Ind

Use GANN 369 to use a combination of 30's,60's,90's time to cross 3's,6's,9's. Any larger combination of these cross smaller combinations of these
Using GANN 369 Method for Trading Reversals The GANN 369 method, inspired by the works of W.D. Gann and Nikola Tesla's 3, 6, 9 numerical patterns, can be employed to identify potential reversals in financial markets. By combining specific periods (30, 60, and 90) with the numbers 3, 6, and 9, traders can seek opportunities for trend changes.
The Forex Trend Tracker is an advanced tool designed to enhance the trading capabilities of forex traders. This sophisticated indicator uses complex mathematical formulas alongside the Average True Range (ATR) to detect the beginnings of new upward and downward trends in the forex market. It offers visual cues and real-time alerts to give traders a competitive advantage in the fast-paced world of currency trading.
Key Features of Forex Trend Tracker:
Trend Detection: The indicator excels in

Overview
In the evolving landscape of trading and investment, the demand for sophisticated and reliable tools is ever-growing. The AI Trend Navigator is an indicator designed to meet this demand, providing valuable insights into market trends and potential future price movements. The AI Trend Navigator indicator is designed to predict market trends using the k-Nearest Neighbors (KNN) classifier.
By intelligently analyzing recent price actions and emphasizing similar values, it help
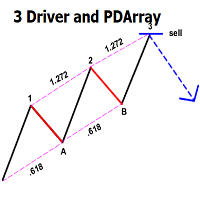
This indicator automatically identifies the SMC 3-Drive pattern and sends notifications to users when the pattern is detected. Additionally, the indicator identifies PDArray (including FVG and OB) and offers an option to combine the 3-Drive pattern with PDArray. This combination provides users with more reliable signals. What is the 3-Drive Pattern? This pattern is formed by three price pushes in one direction, providing a strong reversal signal (Figure 3). The key to identifying this pattern is
Our custom Kalman Filter indicator is a sophisticated, adaptive tool designed for MetaTrader 4 (MT4), giving traders a dynamic approach to analyzing the financial markets. This indicator is based on the Kalman Filter algorithm, a powerful statistical method used to estimate linear dynamic systems. It is specifically designed for traders who need an advanced, responsive tool to monitor market trends and make informed decisions. We have slightly modified the algorithm for this filter to provide b

on free demo press zoom out button to see back.. cnt number is bar numbers.you can change up to 3000 related to chart bars numbers. minimum value is 500. there is g value set to 10000. no need to change it.
this indicator almost grail,no repaint and all pairs ,all timeframe indicator. there is red and blue histograms. if gold x sign comes on red histogram that is sell signal. if blue x sign comes on blue histogram that is buy signal. this indicator on thise version works all pairs.al timeframe

You can visually backtest Elliot Wave Impulse to see how it behaved in the past!
Manual guide: Click here Starting price of $49 for the first 25 copies ( 1 left)! -- Next price is $120 .
This indicator is unstoppable when combined with our other indicator called Katana . After purchase, send us a message and you could get it for FREE as a BONUS! The Elliot Wave Impulse is a pattern identified in the Elliott Wave Theory, a form of technical analysis used to a

There is No use in the Testing Demo. You will understand nothing from running flashing numbers. It is a Dashboard. Just try to understand idea, get it and I will help in everything further. Symbols must be separated by commas (,) and entered into the parameters exactly as displayed by your broker to ensure they are recognized in the dashboard. These symbols will be used for analysis by the indicator.
With one click open any pair any timeframe directly from dashboard The MA Speedometer Dashboar

Introduction
The Price Action, styled as the "Smart Money Concept" or "SMC," was introduced by Mr. David J. Crouch in 2000 and is one of the most modern technical styles in the financial world. In financial markets, Smart Money refers to capital controlled by major market players (central banks, funds, etc.), and these traders can accurately predict market trends and achieve the highest profits.
In the "Smart Money" style, various types of "order blocks" can be traded. This indicator

volatility level indicator is a volatility oscillator to see trend reversal points. price trends has reverese when volatility inreased . this indicator show trend reversal points volatility. mostly same level up and down volatility is reversal points. red colour shows up points of volatilty.and probably trend will down. blue colour oscillator shows deep point of price when increased volatiliyty. on pictures horizontal lines on oscillator has drawed by hand.to see the before level and compare now

С помощью этого торгового инструмента вы можете одновременно сканировать 15 рынков.
Представляем новый торговый индикатор 2024:
️ Панель мониторинга Мультивалютность, мультитаймфрейм, двойной CCI.
Есть как минимум две причины, по которым я создал этот торговый инструмент:
Во-первых, мне надоело наблюдать только за одним рынком. Во-вторых, я не хочу упустить момент входа на другой рынок.
Вот почему я хочу одновременно знать и другие рыночные условия.
По этой причине мне нужен сканер

MACD is probably one of the most popular technical indicators out there. When the market is trending, it actually does a pretty good job, but when the market starts consolidating and moving sideways, the MACD performs not so well. SX Impulse MACD for MT5 is available here . Impulse MACD is a modified version of MACD that works very well for trading Forex, stocks, and cryptocurrencies. It has its own unique feature which perfectly filters out the values in a moving average range and enables it t
123456789101112131415161718192021222324252627282930313233343536373839404142434445464748495051525354555657585960616263646566676869707172737475767778798081828384858687888990919293949596979899100101102103104105106107108109110111112113114115116117118119120121122123124125126127128129130131132133134135136137138
А знаете ли вы, почему MetaTrader Market - лучшее место для продажи торговых стратегий и технических индикаторов? Разработчику у нас не нужно тратить время и силы на рекламу, защиту программ и расчеты с покупателями. Всё это уже сделано.
Вы упускаете торговые возможности:
- Бесплатные приложения для трейдинга
- 8 000+ сигналов для копирования
- Экономические новости для анализа финансовых рынков
Регистрация
Вход
Если у вас нет учетной записи, зарегистрируйтесь
Для авторизации и пользования сайтом MQL5.com необходимо разрешить использование файлов Сookie.
Пожалуйста, включите в вашем браузере данную настройку, иначе вы не сможете авторизоваться.