Смотри обучающее видео по маркету на YouTube
Как купить торгового робота или индикатор
Запусти робота на
виртуальном хостинге
виртуальном хостинге
Протестируй индикатор/робота перед покупкой
Хочешь зарабатывать в Маркете?
Как подать продукт, чтобы его покупали
Технические индикаторы для MetaTrader 4 - 8
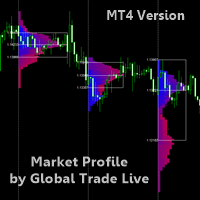
READ THE DESCRIPTION ITS IMPORTANT - ONLY TAKES 2 MINUTES - THIS IS A TOOL NOT A TRADING STRATEGY
Market Profile By Global Trade Live A Market Profile is a graphical representation that combines price and time information in the form of a distribution. A Market Profile is used to determine elapsed time, number of ticks and volumes traded at specific prices, or over a price interval, over a given period. A Market Profile also makes it possible to identify prices accepted or rejected by the ma
FREE

The swing continuation pattern happens in a trend direction after a short reversal / pull back . As the name suggests , these patterns occurs along the swing high and swing lows of a trend , this makes the patterns very low risk patterns with potential high rewards . The swing continuation indicator also combines Currency Meter as a filter for its execution. The idea is to go with both the price trend flow and currency trend flow. Which means the price action must be supported by the currency st

Calculation of Lot Size for many traders is a big challenge.
A case that is very important in money management. What many traders ignore.
Choosing an appropriate Lot Size in trades can improve results and it will ultimately lead to success.
This indicator calculates the authorized Lot Size for your trades.
The indicator uses the following values to get the appropriate Lot Size for positioning:
The distance of Stop Loss.
The Pip Value.
The amount of Risk Allowed For Each Trade.
T
FREE

Данный индикатор создан для поиска предполагаемых разворотных точек цены символа. В его работе используется небольшой разворотный свечной паттерн в совокупности с фильтром экстремумов. Индикатор не перерисовывается! В случае отключения фильтра экстремумов, индикатор показывает все точки, в которых есть паттерн. В случае включения фильтра экстремумов, работает условие – если в истории на Previous bars 1 свечей назад, были более высокие свечки и они дальше чем свеча Previous bars 2 – то тогда тако
FREE

It works based on the Stochastic Indicator algorithm. Very useful for trading with high-low or OverSold/Overbought swing strategies. StochSignal will show a buy arrow if the two lines have crossed in the OverSold area and sell arrows if the two lines have crossed in the Overbought area. You can put the Stochastic Indicator on the chart with the same parameters as this StochSignal Indicator to understand more clearly how it works. This indicator is equipped with the following parameters: Inputs d
FREE

CME Daily Bullettin Open Interest - является провайдером данных об открытом интересе фьючерсных контрактов на бирже CME для Ваших графиков. Открытый интерес - это особый вид объема, показывающий, сколько всего контрактов на каждый момент времени удерживается участниками рынка. Этот вид информации доступен только на фьючерсных рынках, но теперь, с помощью этого индикатора, Вы можете анализировать эти данные торгуя и на рынках спот, таких как FOREX. Кроме того, индикатор предоставляет данные по от

Title : Market Bias Indicator - Oscillator-Based Trading Tool Introduction : Discover the potential of the "Market Bias Indicator," a revolutionary oscillator-based trading tool designed for precise market analysis. If you're in search of a robust alternative to traditional bias indicators, your quest ends here. Market Bias Indicator offers unparalleled accuracy in identifying market sentiment and is your gateway to confident trading decisions. Recommended Trading Pairs : Market Bias Indicator i

Индикатор разработан бывшим сотрудником хедж-фонда, и он автоматически определяет паттерны "Двойная вершина" и "Двойное дно". Его также можно использовать для распознавания паттернов "Тройная вершина" и "Тройное дно". И он будет в частности искать формации, возникающие на вершине (или дне) тредна. Помните: "Двойная вершина" (или "Двойное дно") в конце тренда - это сильный знак того, что цена с трудом двигается дальше. Таким образом, существует большая вероятность того, что произойдет разворот. И
How To Trade
Execute your trades in 3 Easy Steps!
Step 1: Trade Setup Entry Buy in Signal price and TP1 in price indicator, You can use trailing stop in TP1. Entry Sell in Signal price and TP1 in price indicator, You can use trailing stop in TP1. Success Rate ≥ 75% 100:25 Step 2: Set Stop Loss Stop loss BUY ----> You can set stop loss on Line Order SELL. Stop loss SELL ----> You can set stop loss on Line Order BUY. Step 3: Set Take Profit Option 1: Take profit on TP1. Option 2: Partial take
FREE

The Key level wedge indicator automatically draws rising wedge pattern and falling wedge pattern for you on the chart. This pattern is really good when used as a confirmation entry at key support & resistance, supply & demand and reversal zones.
Advantages
The Key level wedge block DOES NOT RE-PAINT, giving you confidence when a signal appears and also helps when looking back. The Key level wedge includes an on/off button on the chart to easily keep the charts clean after analysis by jus
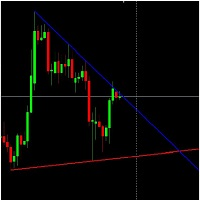
Standard Trend Lines (Automatic).
This indicator draws highly accurate trend lines.
It draws Trend Lines automatically.
This Trend Lines indicator was made by observing lot of discussions made about Trend Lines in forum.
The Trend Lines can also be used to create Expert Advisor.
Latest valid Trend Lines are drawn on Chart.
Trend Lines Work on basis of OHLC price data.
FREE

The purpose of the Combo OnOff indicator is combine differerent tecniques and approachs to the market in order to spot signals that occur simultaneosly. A signal is more accurate if it is validate from more indicators as the adaptive expectations can be used to predict prices.The On-Off feature and alarms help to look for the better prices to enter/exit in the markets
Moving Averages are statistics that captures the average change in a data series over time
Bollinger Bands is formed by upp

Представляем вам Market Structure Break Out для MT4 – ваш профессиональный индикатор MSB и зоны без изменений Присоединяйтесь к Каналу Koala Trading Solution в сообществе mql5, чтобы узнать последние новости о всех продуктах коалы, ссылка для присоединения указана ниже: https://www.mql5.com/en/channels/koalatradingsolution
Market Structure Break Out: ваш путь к чистому анализу волн рынка
Этот индикатор предназначен для отображения структуры рынка и движения волн, чтобы выявить лучший MSB
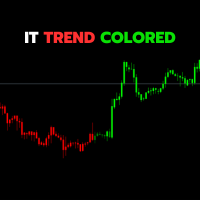
The IT Trend Colored indicator is a powerful tool designed by IT Trading (InfiniteTrades Software Corp) to assist traders in visually and effectively identifying market trends. This version is a custom indicator for the MetaTrader 4 trading platform.
Key Features:
• Trend Identification: The indicator uses a combination of simple moving averages (SMA) to determine the direction of the market trend.
• Intuitive Coloring: Upward trends are represented by bold green histograms, downward tren
FREE

FOLLOW THE LINE GET THE FULL VERSION HERE: https://www.mql5.com/en/market/product/36024 This indicator obeys the popular maxim that: "THE TREND IS YOUR FRIEND" It paints a GREEN line for BUY and also paints a RED line for SELL. It gives alarms and alerts of all kinds. IT DOES NOT REPAINT and can be used for all currency pairs and timeframes. Yes, as easy and simple as that. Even a newbie can use it to make great and reliable trades. NB: For best results, get my other premium indicators for more
FREE
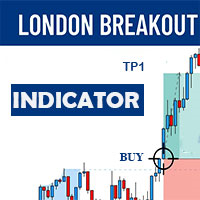
The London Breakout indicator is a technical analysis tool used in the forex market to help traders identify potential breakouts during the opening of the London trading session. This indicator is designed to help traders take advantage of the volatility and momentum that occurs during this time period, which can lead to significant price movements.
The London Breakout indicator works by identifying the range of price movement during the Asian trading session that precedes the London open, an

Ultimate Volatility Scanner (Multi Pair And Multi Time Frame) : ---LIMITED TIME OFFER: NEXT 25 CLIENTS ONLY ---46% OFF REGULAR PRICE AND 2 FREE BONUSES ---SEE BELOW FOR FULL DETAILS Volatility expansion and contraction is a fundamental market principle that will NEVER go away.
And some of the largest institutions in the world invest enormous amounts of capital into various
types of volatility strategies. Not only for profit driven trading strategies, but also for risk control.
VOLATI
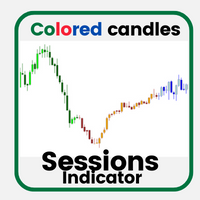
This indicator shows trading sessions using colored candles. It's made for volume profile and supply/demand traders to quickly see when specific candles are formed during different times or trading sessions.
Take a look at the screenshots for a usage example.
Core Features: Different colors for bullish and bearish candles, allowing users to distinguish between bullish/bearish candles.
FREE

Royal Prince Fibonacci , has the most advance Trend detection algorithm built into its Alert system combined with the RoyalPrince Non-repaint Arrows with it's own alert system you will never miss the opportunity of the trade.
2nd picture is how to use Guide on how i use it to Scalp or take long trades.
works on all Charts and all Timeframe on mt4. ︎Best Timeframe M15 for scalping H1 for Day Trading Options: • Fibonacci days High and Lows • Fibonacci Targets • Fibonacci Alert System • Tren

Индикатор устанавливает семафорные точки на максимуме и минимуме старшего, среднего и младшего периодов. Он включает в себя Треугольники A,B,C для более легкого определения разворотных моделей, которые формируются довольно часто и обладают высоким коэффициентом успеха. При появлении семафорных точек или треугольников A,B,C на графике предусмотрены алерты и push-уведомления на мобильное устройство. Эти индикаторы очень полезны для торговли на пробой и для определения уровней поддержки и сопротив

Внешне простой, но достаточно мощный трендовый индикатор. Могу поспорить, что вы сталкивались с индикатором или советником, содержащим множество разнообразных входных параметров, в которых сложно разобраться. Здесь вы не увидите дюжины входных параметров, суть работы которых полностью понятна только разработчику, вместо этого над настройкой параметров работает искусственная нейронная сеть.
Входные параметры
Индикатор максимально прост, поэтому тут только 2 входных параметра: Alert - в значен

Fractals Dynamic Fractals Dynamic – это модифицироанный бесплатный индикатор фракталов Била Вильямса, в котором можно вручную задавать количество баров слева и справа, тем самым строив на графике уникальные паттерны. Теперь все торговые стратегии, основанные, либо в основе которых присутствует индикатор Fractals Dynamic, будут иметь дополнительный сигнал.
Кроме того, фракталы могут выступать в качестве уровней поддержки и сопротивлений. А в некоторых торговых стратегиях показывать уровни л
FREE
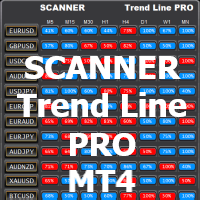
Работает с индикатором Trend Line PRO и set-файлами, созданными Optimizer Utility Вы можете скачать дополнительные программы: здесь
Сканер предназначен для приема новых сигналов индикатора Trend Line PRO на всех парах и таймфреймах от M5 до MN1
Для того чтобы сканер работал, у вас должен быть индикатор. Основным преимуществом сканер Trend Line PRO является возможность использовать индивидуальный файл набора для каждой пары и таймфрейма. Вы можете автоматически настраивать, измен
FREE

This dynamic indicator allows you to measure retracements of price between any two points in either direction. It displays the price points, percentages and also displays the extension levels.
User may Modify and Add addition levels and extensions." User may also Add multiple Fibonacci indicators on the chart and change their colors, style and sizes.
Can be used on any timeframe.
This is the only Fibonacci Tool you'll need to measure and trade on Structure.
MT5 Version Available as we
FREE

Этот инструмент дает возможность отображать уровни поддержки и сопротивления уровней разворота, а также уровни дневного открытия, недельного закрытия и месячного закрытия на графике с высокой гибкостью настройки. Уровни разворотов - это важные уровни поддержки и сопротивления, которые рассчитываются с использованием цен максимума, минимума и закрытия указанного периода (например, D1). При помощи этого индикатора вы сможете выбирать от часового до месячного таймфрейма для расчета точек разворота.
FREE

Мультивалютный и мультитаймфреймовый индикатор Commodity Channel Index (CCI). В параметрах вы можете указать любые желаемые валюты и таймфреймы. Также индикатор может отправлять уведомления при пересечении уровней перекупленности и перепроданности. По клику на ячейке с периодом будет открыт данный символ и период.
Параметры CCI Period — период усреднения;
CCI Applied price — тип цены;
Clear the chart at startup — очистить чарт при старте;
Set of Pairs — набор символов
— Market Watch — пар
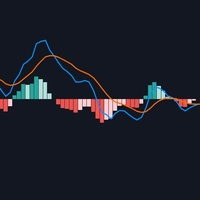
Moving average convergence divergence (MACD) is a trend-following momentum indicator that shows the relationship between two moving averages of a security’s price. The result of that calculation is the MACD line. A nine-day EMA of the MACD called the "signal line," is then plotted on top of the MACD line, which can function as a trigger for buy and sell signals. Traders may buy the security when the MACD crosses above its signal line and sell—or short—the security when the MACD crosse
FREE

В настоящее время праздничная скидка составляет $399! Цены могут вырасти в будущем. Читайте описание ниже!
Представляем Ultimate Dynamic Levels - ЛУЧШИЙ индикатор входов для Ultimate Sniper Dashboard! Чрезвычайно низкий риск своевременных входов и высокий RR!!!
Найдите Ultimate Sniper Dashboard ЗДЕСЬ. Самая важная способность как для начинающих, так и для профессиональных трейдеров - точно определить, где и когда рынок, скорее всего, развернется, и как безопасно войти в рынок и выйти из нег
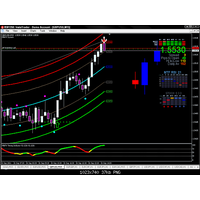
Gravity Timing Indicator -GTI- Индикатор GTI на сегодняшний день является самым простым и точным индикатором. Он использует поддержку и сопротивление гравитационным образом. Работать с ним очень просто, он состоит из 7 линий, самые мощные из которых — самая низкая и самая высокая линии, поэтому, когда индикатор отскакивает, это лучшее время для входа.
работает на всех парах без исключения
для временных рамок я предпочитаю небольшие временные рамки, такие как 5 минут и 15 минут для скаль
FREE
Противоречивая пятиступенчатая система, которую используют трейдеры, чтобы добиться успеха в торговле! Reversal Pro эффективно объединяет движение цены, идеальную локацию и надежную статистику в одном умном алгоритме. Понимание рынка с учетом этой уникальной перспективы дает вам возможность профессионально распознавать развороты трендов.
Раскройте секреты профессиональных трейдеров
Получить мгновенный доступ www.mql5.com/en/blogs/post/716077 Скопируйте то, что профессиональные трейдеры дела

Индикатор выполняет поиск паттерна "Квазимодо" ("Quasimodo") или "Над и Под" ("Over and Under"). Он автоматически находит точки разворота и может автоматически выставлять виртуальные сделки со стоп-лоссом и тейк-профитом. Нажмите на кнопку "Optimize", чтобы автоматически определить наиболее эффективные настройки. Паттерн состоит из четырех колен A,B,C,D, как показано на рисунках. Цены открытия и закрытия виртуальных сделок строятся по ценам Bid, но статистика на панели информации учитывает текущ
FREE

US30 Revolt a Technical indicator that is 100% non-repaint and appears on the current candlestick works on all timeframes (recommended M15,M30,H1) The indicator is made for US30 but it can be used on other pairs as well When a blue arrow appears look for buying opportunities When a orange arrow appears look for selling opportunities Please watch the YouTube video on how to properly set up and use the indicator
FREE

The current Rise and Fall is judged from the Commodity Channel Index (CCI) of the three cycles and displayed in a panel by color coding.
The second and third of the three cycles are changed according to the correction factor multiplied by the first cycle (minimum cycle).
In addition, each CCI is displayed with ATR (Average True Range) corrected for variation.
When two of the three CCI are complete, Trend_1 is displayed. When all three are complete, Trend_2 is displayed.
// ---
Sq
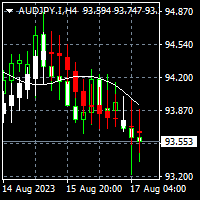
To download MT5 version please click here . - This is the exact conversion from TradingView: "Linear Regression Candles" By "ugurvu". - This is a non-repaint and light processing load indicator - You can message in private chat for further changes you need. This is a sample EA code that operates based on bullish and bearish linear regression candles . #property strict input string EA_Setting= "" ; input int magic_number= 1234 ; input string Risk_Management= "" ; input double fixed_lot_size=
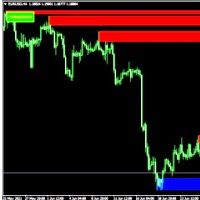
Use the indicator only in retest zones The newly formed zone should be used for scalping only New zones are repainted or recalculated When supports and resistances are violated, they are deleted as they no longer function. Recommended on M30 and higher timeframes You will see the trading zones and identify the most profitable points to open positions. The indicator marks the supply and demand zones. With this show you will now make profitable trades that will set the trends. Shows all support a

Introducing our A.I Currency Strength Meter Forex Indicator, a state-of-the-art tool designed to provide forex traders with real-time insights into the strength of various currencies. Leveraging the latest advancements in artificial intelligence and machine learning, this innovative indicator analyzes market data in real-time, providing users with accurate and up-to-date information to inform their trading decisions. In addition to its cutting-edge algorithms, the Currency Strength Meter Forex I

Паттерн Хиккакэ является специализированным индикатором, разработанным для выявления и обнаружения паттернов ценового действия Хиккакэ, которые формируются на графике. Эти паттерны основаны на концепции ложного прорыва внутреннего бара, что часто создает потенциальные торговые возможности. Основная функция индикатора - анализ последних пяти свечей на графике и определение, соответствуют ли они характеристикам паттерна Хиккакэ. Когда этот паттерн подтверждается, индикатор рисует прямоугольник в

** All Symbols x All Time frames scan just by pressing scanner button ** *** Contact me after the purchase to send you instructions and add you in "Harmonic Scanner group" for sharing or seeing experiences with other users. Introduction Harmonic Patterns are best used to predict turning point. Harmonic Patterns give you high win rate and high opportunities for trade in during one day. This indicator detects the best and successful patterns base on Harmonic Trading books . The Harmonic Patterns S

This indicator is SO SIMPLE… when the green Rise Coming arrow appears, a price drop may be on the way! Plain and easy profits! As you receive more than one 'Rise Coming' text signal in a downtrend, it means momentum is building larger for a bull run. HOW TO USE 1. When the green "Rise Coming" text appears, a price jump may be on the way! This indicator Never Repaints! To get the best setting it's a matter of tweaking the indicator until it gives you the best results. Our recommendation, and what
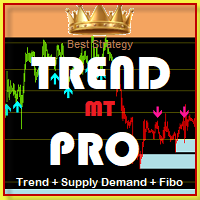
Please feel free to contact me if you need any further information.
Please let me know if you have any questions.
I hope the above is useful to you. MT Trend Pro: "Trade according to the trend and you will be a winner." There is Supply&Demand and Fibo to help set SL and TP. indicator for trade by yourself
TRADE: Forex
TIME FRAME: All Time Frame (Not M1)
SYMBOL PAIR: All Symbol
SETTINGS:
SIGNAL FOLLOW TREND: Input period (>1)
CANDLE MA FILTER TREND: Set MA to change the cand
From USD 49 to USD 39 Objective: To notify/alert traders if price touched or closed above/below the moving average. Features/Settings: Moving average method supported: Simple, Exponential, Smoothed and Linear Weighted Works on all currency pairs. Set the Moving Average Period/Shift value Timeframe supported: 1m, 5m 15m, 30m, 1H, 4H, 1D, 1WK, 1Mo Set the Applied Price: Close, Open, High, Low, Price, etc. Set the Candle Size Type: Full Length or Body Length Set the Candle Size to Trigger an Al

Индикатор отображает на графике рыночные профили, в любом произвольном месте, любой произвольной продолжительности. Создайте на графике прямоугольник, и данный прямоугольник автоматически будет заполнен профилем. Изменяйте размеры прямоугольника или перемещайте его - профиль автоматически будет следовать за изменениями.
Особенности работы индикатора
Управление индикатором осуществляется непосредственно из окна графика с помощью панели кнопок и полей для ввода параметров. В правом нижнем углу
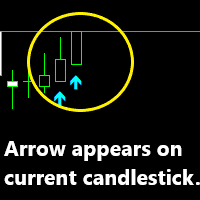
Advanced artificial intelligence indicator that is 100% non-repaint and appears on current candlestick. The indicator is based on arrows which serve as your entry points. Buy arrow is your buy signal and orange arrow are your sell signal as more arrows appear the stronger the trend and you can add more entries. The indicator works on all timeframe from the one-minute timeframe to the monthly timeframe. The AI Non-repaint indicator works on all forex pairs.

Contact me after payment to send you the User-Manual PDF File. How To Test
You can test the indicator by free version, to get the free version please contact me ( the free version scans charts in W1 and MN1 time-frames ) it's free.
123 Pattern Breakout
Trend is your friend, trade along the trend, but how do we identify trends? Sometimes the simplest methods have the best results. Pattern 123 is based on the breakout important price levels, when the price is trying to break the previou

В каждой хорошей системе для Форекса имеются следующие компоненты: Возможность распознавания направления тренда. Возможность определения силы тренда и ответа на основной вопрос Рынок торгующийся или бестрендовый? Возможность определения безопасных точек входа, что даст идеальное соотношения риск/прибыль по каждой позиции. Возможно вам ранее встречались различные версии измерителей силы валюты, но эта не похожа на остальные. Это более усовершенствованная версия и предлагает более подробную информ

Индикатор представляет собой ломаную линию( сегмент ZigZag ), которая отслеживает и соединяет между собой крайние точки цены графика отстоящие друг от друга не менее чем на заданный размер в пунктах по шкале цены.
Одним и единственным параметром настройки является минимальный размер(в пунктах) сегмента ZigZag. Индикатор отображает уровни для определения возможного разворота тренда:
уровень "LevelForUp" - пробитие данного уровня определяет возможный разворот тренда вверх (на покупку);
ур

Arrow indicator with trend filter. Generates trend input without delays or delays - on the emerging candle. Suitable for use on any trading tools and timeframes. Easy to use, contains the direction of the trend in the form of a histogram lines and signal generator.
Input parameters
Period Trend Line - Period of the Histogram Line Signal Generator Period - If the period is longer, then the arrows are less Play sound Display pop-up message Send push notification Send email Sound file signal -
FREE

Precision Trend Signals - индикатор, который стрелками на графике показывает точки разворота цены. Зеленая стрелка показывает, когда цена развернется вверх, а красная стрелка показывает, когда цена развернется вниз. Индикатор можно использовать на любых таймфреймах и любых валютных парах. Стратегия торговли с этим индикатором следующая:
когда появляется зеленая стрелка, закрываем ранее открытую (если есть открытая) сделку на продажу и открываем сделку на покупку. когда появляется красная стре
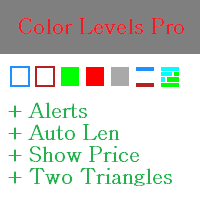
Color Levels Pro is a new version of the normal Color Levels. It allows setting two empty rectangles, three filled ones, two tredlines, and two triangles.
The indicator parameters are very simple and divided into blocks:
The ones beginning with 1 and 2 - empty rectangle (frame) parameters; 3, 4, and 5 - filled rectangle parameters; 6 and 7 - trendline parameters; 8 and 9 - triangle parameters. Simply click a desired object and it will appear in the corner.
Main Adjustable Parameters : C
FREE

"IF YOU'RE LOOKING FOR A UNIQUE TRADING APPROACH TO TRADING…AT AN AFFORDABLE PRICE…YOU'VE COME TO THE RIGHT PLACE!" Buy DayTradingArrow v1 Indicator And You Will Get Forex Trend Commander Indicator for FREE !
In forex trading, like any business, there are some rules that must be followed, which are disturbing for now, many adhere to the rule that if a system has losses, it is not profitable. To create the PERFECT strategy, the Perfect one for you, you need to experiment with all ways and for

BREAKOUT-SESSION-BOX ЛОНДОН ЕС США АЗИЯ Открытый
Ожидание волатильного движения выше или ниже диапазона открытия Мы берем максимум диапазона в качестве входа в длинную сделку, а стоп-лосс будет минимумом диапазона. и наоборот, минимум диапазона как вход для короткой сделки и максимум для SL. Размер диапазона - это расстояние до TP (Take Profit) Диапазон часов работы не должен превышать примерно 1/3 среднего дневного диапазона. 4 примера прорыва уже предопределены: Азия, Франкфурт, Лондон, США.
FREE

RSI divergence indicator is a multi-timeframe and multi-symbol indicator that help us find divergences between price chart and RSI indicator. Always use the divergence indicators with other technical assets like support resistance zones, candlestick patterns and price action to have a higher possibility to find trend reversals. This indicator will identify the peaks and troughs of both price and the RSI indicator. You can adjust the parameters to adjust the strength and weakness of these peaks a
FREE
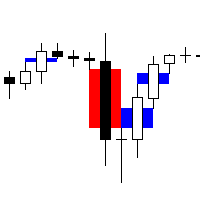
Fair Value Gap Scanner 4 is a sophisticated MetaTrader 5 indicator designed to detect fair value gaps (FVGs) in price action and display them as rectangles directly on the chart. This powerful tool empowers traders by providing visual representations of FVGs, enabling them to identify potential trading opportunities with ease and precision. With customizable parameters for color, width, and style, traders can tailor the indicator's appearance to suit their preferences and trading strategies. Key
FREE

DESCRIPTION
The CHAOS INDICATOR has been developed to be used for the TRADING STRATEGY OF CHAOS, as described in the book. The book is in italian language only and can be obtained only on my website indicated below.
DATAS COLLECTED AND SHOWN ON GRAPHS
The CHAOS INDICATOR apply easily to any graph and any asset, and it is a TRADING FACILITATOR, as it identify immediately the following items on any graph: - The GP (= RIGHT PRICE) i.e. the price to which the asset should be attracted within 24

Candle Power Signals - трендовый индикатор использующий стратегию поиска потенциальных волатильных сигналов для принятия торговых решений.
Анализируя рынок индикатор определяет зоны повышенной и пониженной волатильности в пределах направленного трендового движения.
Основные параметры генерации сигналов уже настроены, оставшиеся настройки и периоды проиндексированы в 2 параметра для ручной настройки:
1. "Candle calculation method" - 2 режима генерации сигналов, рекомендуется использовать об
FREE
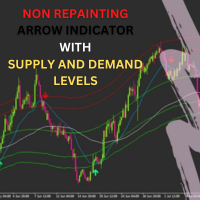
*****ARROWS NON REPAINT ***** Trade With Sam Simple Strategy Guide : https://www.mql5.com/en/blogs/post/740855
MT5 version of the indicator
Try Out and see the Difference
The Sam's Trend Blaster indicator tracks the market trend with an unmatched reliability, by ignoring sudden fluctuations and market noise. It has been designed to trend-trade intraday charts and small timeframes. Its winning ratio is around 85%. This is an arrow indicator that shows precise price reversals. A great ar
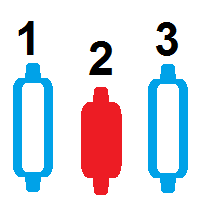
индикатор свечного счетчика этот индикатор считает свечи, которые есть на графике любого таймфрейма бесплатный барный счетчик для загрузки на mt4 счетчик свечей подсчитывает количество свечей на большом графике с помощью этого счетчика свечей вы можете выполнять автоматический подсчет свечей бесплатный индикатор количества свечей для автоматической загрузки и подсчета баров bar counter to count the bars count candle counter indicator mt4 count candle счетчик свечей для MT5 Если вам интересен это
FREE

Рынок несправедлив, хотя бы потому, что всего лишь 10% игроков управляют 90% капитала. У рядового трейдера мало шансов, чтобы противостоять этим «хищникам». Но выход есть, необходимо всего лишь перейти на другую сторону, необходимо находиться в числе этих 10% «акул», научиться распознавать их намерения и двигаться вместе с ними. Объем - это единственный опережающий фактор, который безупречно работает на любом периоде и любом торговом инструменте. Сначала зарождается и накапливается объем, и толь

Gendel Gendut is Binary Option Indicator From @realTatino Trade with expaired time Pairs : All Forex Pair Time Frame : M5 only Trade Time All Time Alert : Alert Message, Alert Email, Alerts Push Buffer : 4 Buffer (0,2 (Buy) || 1,3 (Sell) Broker Suitable : All Broker Binary With Forex Pair Auto Trade : Yes Repaint : NO Delay : NO Other Binary Indicator : https://www.mql5.com/en/market/product/70915 https://www.mql5.com/en/market/product/71054
https://www.mql5.com/en/market/product/57755
etc I

Average Daily Weekly Monthly Range Alerts.
The most complete multi-period dynamic range indicator with full alert options. Visually displays the Average Range lines on chart + real time distances to the Range Highs and Lows. Notifications are sent when the average ranges are hit. An essential tool for any serious trader! Average period ranges, especially the ADR (Average Daily Range) for day traders, are one of the most useful and consistently reliable indicators available to traders. Always a
MT5 Version Available Here: https://www.mql5.com/en/market/product/62376
Telegram Channel & Group : https://t.me/bluedigitsfx
V.I.P Group Access: Send Payment Proof of any of our Paid Products to our Inbox
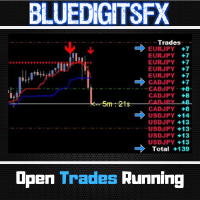
Recommended Broker: https://eb4.app/BDFXOsprey * The Most Sought After Pip Counter for Metatrader ! Features
Will show Currency Symbol in BLUE for Buy positions. Will show Currency Symbol in RED for Sell positions. Will Show pips in BLUE Color for Positive Pips Will Show pips in
FREE

This is Free product you are welcome to use for your needs! Also I very appreciate your positive feedbacks! Thanks a lot! // More great Expert Advisors and Indicators are available here: https://www.mql5.com/en/users/def1380/seller // Also you are welcome to join to profitable , stable and reliable signal https://www.mql5.com/en/signals/1887493 Forex Indicator: Heiken Ashi Candles for MT4. No Repaint. Heiken_Ashi_Candles has great combination with Trend Line MA indicator https://
FREE
Интеллектуальный индикатор Smart Breakout Indicator определяет уровни поддержки и сопротивления и также в виде гистограммы показывает точки пробоя уровней.
Программа содержит два индикатора в одном: 1 - линии поддержки и сопротивления, 2 - гистограммный индикатор основан на высоком колебании цен. Индикатор автономно вычисляет наиболее лучшие уровни поддержки и сопротивления и также в виде гистограммы показывает наиболее лучшие моменты пробоя линий.
Гистограммный индикатор создан на
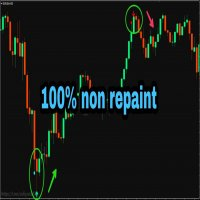
PLEASE NOTE You can customize the settings of K_period value, the oversold and the overbought value is customizable. You can change it as per your requirement. The accuracy will change as per your settings.
100% Non repaint indicator
Pre-alert (get ready) signals
Non-delay indications
24/7 signals
100% No lag
No recalculating The arrows wont repaint even if the signal fails, or you refresh or restart the mt4 Indicator is based on simple crossover strategy of main line and signal line
FREE

A huge overhaul and improvement on the highly successful Three Line Strike Finder https://www.mql5.com/en/market/product/60396?source=Site+Profile+Seller This fantastic tool will scan your selected timeframes, and display new three line strike patterns as they appear. No more having to flip through different timeframes to check if a new three line strike pattern has emerged. The supported timeframes are, the current timeframe, 15 minute, 30 minute, 1 hour, 4 hour and Daily, all of which can be
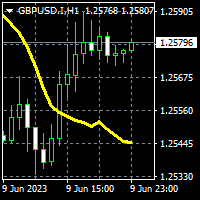
To get access to MT5 version please click here . This is the exact conversion from TradingView: "ZLSMA - Zero Lag LSMA" by "veryfid". This is a light-load processing indicator. This is a non-repaint indicator. Buffers are available for processing in EAs. All input fields are available. You can message in private chat for further changes you need. Thanks for downloading
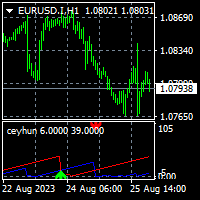
To get access to MT5 version please click here . This is the exact conversion from TradingView: "Top Bottom Indicator" by "ceyhun". This is a light-load processing and non-repaint indicator. All input options are available. This is not a multi time frame indicator. Buffers are available for processing in EAs. Extra option to show buy and sell signal alerts. You can message in private chat for further changes you need.

1分足から使える高精度のスキャルピング用逆張りサインツールです。
・すべての通貨ペア、時間足で利用でき、絶好のタイミングでのエントリー・チャンスをお知らせします ・ ボリンジャーバンドにタッチしてからの反転を 基本戦略とし、 独自のアルゴリズムを加えることで、精度の高い反転ポイントでサインを発信します ・勝敗判定機能により 直近の相場環境に対するこのインディケータの有用性を確認することができます ・ 初心者から上級者まで設定不要ですぐにお使いいただけます ・本サインツールの性能を確認いただくための専用EAを提供いたします。コメント欄をご覧ください
1分足での使用にも耐えるので、トレード頻度を高めることができます。またより高い時間足での使用では精度の向上が期待できます。トレンド・フィルターの機能を利用することで、トレンド方向での押し目買い、戻り売りに際し最適なタイミングでトレードすることができます。
設定項目は以下の通りです。 Bollinger Bands Period
Bollinger Bands Deviation
Bollinger Bands Shift
Особенности Tipu RSI 28-символьная, мультитаймфреймовая мощная панель для полного обзора рынка Настраиваемые оповещение о сигналах на покупку/продажу, push-уведомления, оповещения по email и всплывающее сообщение на экране. Отмечает уровни перекупленности и перепроданности. Трехцветный индикатор RSI отмечает нейтральное состояние рынка, а также состояния перекупленности и перепроданности. Индекс относительной силы (Relative Strength Index, RSI) - осциллятор, разработанный Уэллесом Уайлдером и оп
FREE

Stochastic Scanner is a multi symbol multi timeframe Stochastic dashboard that monitors the indicator for price entering and exiting overbought and oversold in up to 28 symbols and 9 timeframes.
Download Demo here (Scans only M1 and M5) Settings description here MT5 version here
Stochastic Scanner features: Signals price entering and exiting the overbought and oversold zones. Monitors up to 28 customizable instruments and 9 timeframes at the same time. You can choose between 3 alert mo
MetaTrader Маркет - уникальная площадка по продаже роботов и технических индикаторов, не имеющая аналогов.
Памятка пользователя MQL5.community расскажет вам и о других возможностях, доступных трейдерам только у нас: копирование торговых сигналов, заказ программ для фрилансеров, автоматические расчеты через платежную систему, аренда вычислительных мощностей в MQL5 Cloud Network.
Вы упускаете торговые возможности:
- Бесплатные приложения для трейдинга
- 8 000+ сигналов для копирования
- Экономические новости для анализа финансовых рынков
Регистрация
Вход
Если у вас нет учетной записи, зарегистрируйтесь
Для авторизации и пользования сайтом MQL5.com необходимо разрешить использование файлов Сookie.
Пожалуйста, включите в вашем браузере данную настройку, иначе вы не сможете авторизоваться.