Смотри обучающее видео по маркету на YouTube
Как купить торгового робота или индикатор
Запусти робота на
виртуальном хостинге
виртуальном хостинге
Протестируй индикатор/робота перед покупкой
Хочешь зарабатывать в Маркете?
Как подать продукт, чтобы его покупали
Технические индикаторы для MetaTrader 4 - 30
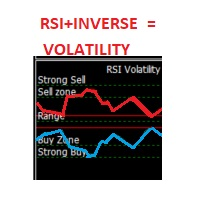
This indicator is an oscillator that shows the RSI (Relative Strength Index) in red and its inverse graph in a light green. Together this shows the volatility of the market (in its default setting). You can also change it to show only the RSI graph. It also gives you the possibility to change its Period. The oscillators zones (80,70,50,30,20) are marked by Strong Sell, Sell Zone, Range, Buy Zone, and Strong Buy respectively.
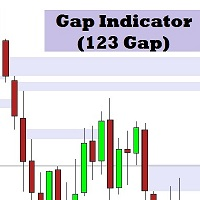
This indicator identifies the gap between the first and third candles in 3 consecutive candles. This area can be used to identify strong areas that the price may return to after a reversal or pullback.
The indicator has 4 user defined settings: 1. Display Distance: This is how many previous candles the indicator will use to identify gaps.
2. BearBarColor: This is the color that will be used for gaps created during a downtrend.
3. BullBarColor: This is the color that will be used for gaps cre

^With Mixin Combiner.
^You Can Combine 10 Indicators Together To Make One Arrow In The End
^You Can Filter Time You Want To Trade.
^You Can Control Which Candle Arrow Apear On It " Bullish Or Bearsh".
^There Is An Statistics To Can Filter "What success rate of the indicators you Combined? ".
^You Also Can Control The Appearance Of The Arrows At Any Time Of The Candle , "Is It In The Beginning Or At Any Time In Particular? ".

Are you tired of the uncertainty that arises when your orders fail to stop at a specific line due to the spread? Look no further! Introducing our indicator that plots candlesticks based on the Ask price instead of the traditional bid-based chart commonly used in MQL4. With this indicator, you can say goodbye to the frustrations caused by the bid-based chart, as it provides you with a more accurate representation of market movements. By utilizing the Ask price, which represents the price at whic
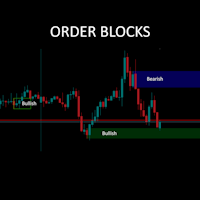
You have been waiting for it I know!! AVAILABLE NOW!! After more than 11000 MT5 downloads, hope it helps you as much as it does me. We added a candle timer and more prominent symbol info display as a bonus as well! This is a straight forward keep is simple style Order Block finder. No fancy algorithms but tends to be quite accurate for some symbols to predict bounce, return-to and break-through channels. It is a retrospective indicator (as they all are) and there to help you with better guesses
Description:
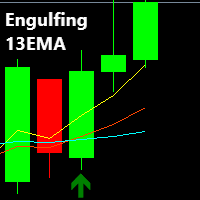
The Engulfing 13EMA is a Multi Timeframe Indicator that scans Multiple Symbols which will help you to identify potential trade set ups. As well as Forex, it can scan Crypto, Exotics, Metals, Indices, Energies or what ever else you have in your Market Watch list. You also have the option to enable/disable the time frames you want to scan. (M1,M5,M15,M30,H1,H4,D1,W1,MN1) All of these options are made possible from just ONE chart, from which the Indicator is attached
An alert is

RSI Levels generates buy and sell arrows based on RSI analysis. Signals are based on extreme levels breakouts and can be further filtered by a volatility metric. Trader can use the mode which compliments his/her trading style. Features:- Parameters for signal optimization and alerts. Usage:- RSI Levels can be used as a stand alone indicator with context or even be added to strategies to make confirmations more strong. Volatility based stop loss, take profit & position sizing can be very helpf

Trend Flasher
Trend is your friend is the age old saying quote in trading arena, there are though many ways to gauge the trend and its direction, more scientific measure and logically meaningful will be an ATR break outs to identify and spot the trend and its acceleration, so we created this easy to use trend identification panel and optimized super trend based multi time frame panel entry system to aid and help the traders to make their trading decision.
Unique Features of Trend Flasher
1
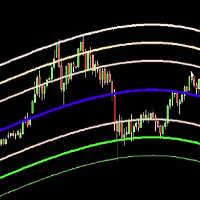
The Belkhayate center of gravity indicator is best used to confirm major turning points, and distinguish price extremes. Generally if price reaches the upper or lower levels one should expect a turn around coming soon, or at least a pull back towards the centre line if there is a strong trend. The upper and lower levels are red and green lines.
Our indicator use the same parameters as the well known trader M.Mostafa Belkhayate the inventor of the indicator, allow the use of buffers for your EA

The GGP ADX and DI MT4 Indicator is used to quantify trend strength. ADX calculations are based on a moving average of price range expansion over a given period of time. This indicator is MT4 conversion of the ADX and DI Indicator by “BeikabuOyaji “ in Trading View website and some alert methods are added to provide real-time alerts when a trading signal is generated, in order to allow traders to act quickly and efficiently. For MT5 version please click here . ADX is plotted as a single line w
Check My Product Contact me to discover all my services
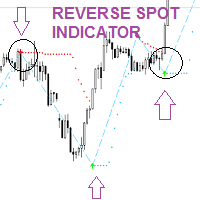
Reverse Spot is an indicator that can help you find and identify possible price reverse zones. This indicator can be used both as a trend continuation signal after a small period of consolidation or retracement and as a trend change signal.
Reverse spot is a very easy to use indicator and thanks to the signals it sends with the arrows it is easy for the trader to identify moments in which to evaluate his own operations.
Reverse Sp

Scanner and Dashboard for Money Flow Index for MT4 The Money Flow Index (MFI) is a technical oscillator that uses price and volume data for identifying overbought or oversold signals in an asset. It can also be used to spot divergences which warn of a trend change in price. The oscillator moves between 0 and 100. Advantages of the Scanner: - Full Alert Options. - Multi Timefrare - Works for all instruments including Currencies, Indices, Commodities, Cryptocurrencies and Stocks. - Fully customis

Supply and Demand Indicator + FREE Currency Strength Meter ADD-ON Looking for a powerful tool that can help you identify the most reactive zones in the forex market? Our supply and demand indicator for MetaTrader 4 and 5 is exactly what you need. With its advanced algorithms and real-time analysis, this indicator helps traders of all experience levels make informed trading decisions. The supply and demand indicator is a cutting-edge tool that helps traders identify areas where buyers and seller
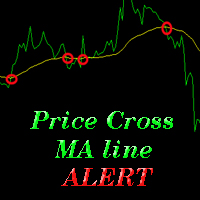
Индикатор выдает алерты при пересечении рыночной ценой скользящей средней. Вы можете выбрать любую линию скользящей средней на вкладке входных параметров (см. один из скриншотов внизу). Параметры (те же, что и четыре параметра, которые вы должны выбрать при добавлении на график линии скользящей средней): ma_period ma_shift ma_method (0=Simple; 1=Exponential...) ma_apply (0=Close; 1=Open; 2=High; 3=Low...) При пересечении ценой линии скользящей средней вы получите алерт, содержащий примерно так

Key Levels + Zones
Indicator cleanly displays even numbered price levels: “00s” and “50s” . Additionally, you can display “Mid-Lines” which are preset distance levels on both sides of the even numbered price levels (set to 12.5 pips by default). This 25-pip zone that straddles each even numbered price relates to where many traders place their stops and therefore can be a risk “Zone” to steer clear of when placing your stops. The zone also acts as support and resistance. Indicator p rovid
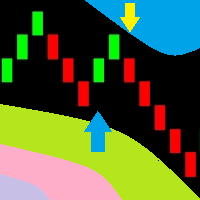
Теперь вы можете использовать обычные ценовые графики для отображения ренко-баров. Индикатор может отправлять сигнальные окна с оповещениями, push-уведомления на мобильные терминалы и на электронную почту. Вы можете легко использовать данный индикатор для создания советников, т.к. индикатор использует буферы.
Настройки индикатора Renko size, points - размер Renko-баров Arrows gap, points - расстояние до сигнальных стрелок Alerts - true/false - использовать всплывающее окно при сигналах Push no

Целью этой новой версии стандартного MT4 индикатора, входящего в поставку платформы, является отображение в подокне нескольких таймфреймов одного и того же индикатора и его расхождений. См. пример, приведенный на рисунке ниже. Однако индикатор отражается не как простой индикатор MTF. Это реальное отображение индикатора на его таймфрейме. Доступные настройки в индикаторе FFx Divergences: Выбор таймфрейма для отображения (от M1 до MN) Установка ширины (количество баров) для каждого окна таймфрейма

Система внешне напоминает Итальянский флаг и очень проста для понимания обычных людей. Разобраться сможет любой трейдер с любым уровнем подготовки. Торговая система Италия выдает 3 вида состояния рынка. Зеленая зона - рассматриваем только покупки. Красная зона - рассматриваем только продажи. Пустая зона - флет, ничего не делаем. Сигнал на покупку: Зеленая зона + появилась синяя стрелка. Закрытие всех позиций когда появился обратный сигнал (стрелка). Сигнал на продажу: Красная зона + появилась кр

FFx Universal Strength Meter PRO не просто измеряет силу. Помимо расчета цены, он располагает 19 встроенными режимами + 9 таймфреймов. С индикатором FFx USM вы сможете определить любой период для любого сочетания таймфреймов. Например, вы можете установить панель для последних 10 свечей для M15-H1-H4… Настройки очень гибкие! Индикатор прост в работе... Он выдает информацию по силе и слабости валют, позволяя вам находить наиболее подходящие пары для торговли. Пример: Если EUR сильна, а USD слаба,
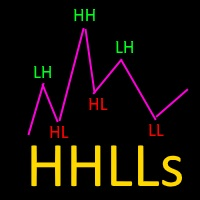
Индикатор импульса на основе идеи Виталия Апирина. Позволяет определить направление тренда. Если зеленая линия выше красной, тренд восходящий; если наоборот - нисходящий. Индикатор производит два отдельных вычисления: стохастик повышающихся максимумов (higher highs, HH) и стохастик снижающихся минимумов (lower lows, LL), вместе составляющих индикатор HHLLs. Виталий Апирин использует свои идеи при изучении стохастического осциллятора и процентного диапазона Уильямса, образующих новый индикатор на
This indicator uses candlesticks with large real bodies to predict possible market structure shift. Displacement is a very powerful move in price action resulting in strong selling or buying pressure. Generally speaking, displacement will appear as a single or a group of candles that are all positioned in the same direction. These candles typically have large real bodies and very short wicks, suggesting very little disagreement between buyers and sellers. Often, a displacement will occur just af

Meet the Tweezer Hunter, an essential tool for every Forex trader looking to make accurate, trend-following trades. This powerful, intuitive indicator helps traders spot potential trend reversals before they happen, providing a significant advantage in the fast-paced world of Forex trading. The Tweezer Hunter is more than your average tweezer candle indicator; it's designed with a built-in trend identification feature that accurately detects whether the market is bearish or bullish. By integrat
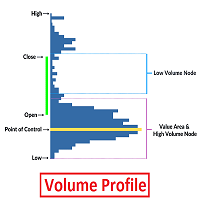
Volume Profile is an advanced charting study that displays trading activity over a specified time period at specified price levels. The study (accounting for user defined parameters such as number of rows and time period) plots a histogram on the chart meant to reveal dominant and/or significant price levels based on volume. Essentially, Volume Profile takes the total volume traded at a specific price level during the specified time period and divides the total volume into either buy volume or s

MT5 Version Kill Zones SMT Divergences Order Blocks ICT
The Order Blocks ICT indicator is a powerful tool for traders looking to gain an edge in the market. This indicator is based on the order flow and volume analysis, which allows traders to see the buying and selling pressure behind the price action. This information can be extremely valuable in identifying key levels of support and resistance, as well as potential turning points in the market.
The Order Blocks ICT indicator is easy
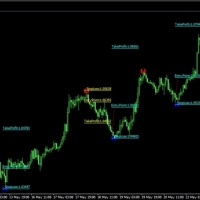
Best indicator for trend reversals How to use: wait for the candle to close above the entry price, then open the order Level lines appear when candle closes, The system shows you the best entry levels It is simple and easy to use, no additional settings are required. Best indicator for beginners and professionals By placing a pending order in the entry, you can set the displayed stoploss and the profit levels you want. You can use it alone or in addition to your strategy. All pairs with recom
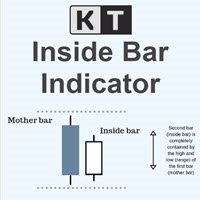
KT Inside Bar plots the famous inside bar pattern in which the bar carries a lower high and higher low compared to the previous bar. The last bar is also known as the mother bar. On smaller time-frames, the inside bar sometimes appears similar to a triangle pattern.
Features
Also plots entry, stop-loss, and take-profit levels with the inside bar pattern. No complex inputs and settings. Erase unwanted levels when the price reaches the entry line in either direction. All Metatrader alerts incl

The KT Buy Sell Volume is a powerful tool traders use to gauge the strength and weakness of price movements. In the whirlwind of the Forex market, traders aim to identify and ride the waves of a bullish or bearish trend that exudes strength and potential. However, recognizing these trends necessitates a method, metric, or indicator to quantify their strength. One crucial factor that traders examine for this purpose is volume. Volume refers to the number of shares or contracts traded in a securit

Индикатор определяет сигналы дивергенции - расхождения пиков цены и показаний осцилятора MACD. Сигналы отображаются стрелками в дополнительном окне и сопровождаются сообщениями во всплывающем окне, на электронную почту и на мобильное устройство.
Параметры индикатора MacdFast , MacdSlow , MacdSignal , MacdPrice - параметры индикатора MACD PeakPoints - количество точек для определения пиков; PeakDistance - минимальное расстояние между соседними пиками deltaPrice,deltaOscillator - минимальные от

Questo indicatore fractal ti invierà un messaggio telefonico (tramite app mt4) non è necessaria la configurazione dell'indicatore, basta impostare l'ID del tuo smartphone e potrai ricevere il messaggio BUY o SELL in tempo reale (affidabilità 80%)
per qualsiasi domanda o dubbio non esitate a contattarmi su mql5.com o telegram (link al gruppo disponibile in bio)

Bollinger Squeeze Trend Indicator is a technical analysis tool used in the investment and trading world. This indicator helps identify market trends by analyzing the price movements of assets.
The Bollinger Squeeze Trend Indicator uses a variation of Bollinger Bands and focuses specifically on the relationships between volatility and price movements. Essentially, the Bollinger Squeeze Trend indicator is designed to recognize periods of narrowing and widening of bands. This can help identify p

Smart ADR as an indicator displays the average daily range of 3 timeframes such as Daily, Weekly, and Monthly. Using the combination of 3 timeframes of ADR as a reference to shows fixed range and dynamic range targets as lines on your charts.
Inputs
Smart ADR Parameters Indicator Name - Display the indicator name Daily Periods - Display the Daily Periods of ADR Weekly Periods - Display the Weekly Periods of ADR Monthly Periods - Display the Monthly Periods of ADR Daily Line Show ON - Set

Индикатор определяет и отображает на графике паттерн М. Гартли "Бабочка". Выделение паттерна производится по вершинам индикатора ZigZag (включен в ресурсы, не требует дополнительной установки). В момент распознавания паттерна выводится сообщение во всплывающем окне, отправляются оповещения на мобильное устройство и электронный почтовый ящик. Схема паттерна и параметры волн приведены на скриншоте. Параметры, заданные в индикаторе по умолчанию, являются демонстрационными для увеличения количества

This is a volume profile that shows the volume with a fixed constant time frame that you set. The indicator also shows the maximum volume value (VPOC - VOLUME POINT OF CONTROL) and the average value, colors and settings you can adjust as you like, there are many possibilities. If you need an indicator that shows the variable volume range frames there is ...HERE... Volume Profile is an advanced charting study that displays trading activity over a specified time period at specified price leve
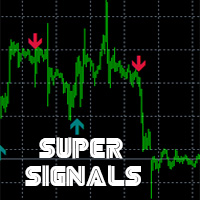
Indicador de Trading UltraPreciso para MetaTrader 4: "Mr Beast Signals no Repaint with alerts" Descubra la revolución en el análisis técnico con nuestro indicador Quantum Precision Pro diseñado para MetaTrader 4. Este avanzado indicador combina algoritmos de vanguardia con inteligencia artificial para ofrecer señales de compra y venta extremadamente precisas en tiempo real. Características destacadas: Precisión sin Igual: Nuestro algoritmo utiliza una combinación de análisis técnico y patrones d

Relative Momentum Index (RMI, Индекс Относительного Импульса) был разработан Роджером Альтманом и впервые опубликован в феврале 1993 года в журнале "Technical Analysis of Stocks & Commodities". Как следует из названия, Индекс Относительного Импульса добавляет компоненту импульса к традиционному RSI. Он направлен на увеличение надежности при помощи уменьшения ложных колебаний между заданными уровнями перекупленности и перепроданности. В индикаторе Relative Momentum Index имеется 2 составляющие. И

KT Price Border creates a three-band price envelope that identifies potential swing high and low areas in the market. These levels can also be used as dynamic market support and resistance. The mid-band can also be used to identify the trend direction. As a result, it also functions as a trend-following indicator. In addition, its ease of use and more straightforward conveyance of trade signals significantly benefit new traders.
Features
It works well on most of the Forex currency pairs. It
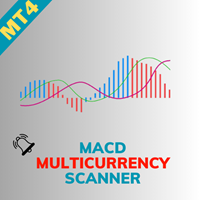
Welcome to the world of advanced trading with the MACD Multicurrency Scanner! Maximize your trading experience with our powerful MT4 indicator designed for seamless analysis and real-time insights. Key Features: Effortless MACD Scanning: Unlock the full potential of the MACD Multicurrency Scanner by effortlessly scanning multiple currency pairs. Receive instant alerts when specific Moving Average Convergence Divergence (MACD) conditions are met, ensuring you stay ahead of market movements. Comp
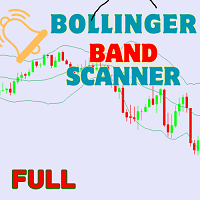
Welcome to the world of advanced trading with the Bollinger Bands Scanner! Maximize your trading potential with our powerful MT4 indicator designed for seamless analysis and real-time insights. Key Features: Effortless Bollinger Bands Scanning: Unlock the full potential of the Bollinger Bands Scanner by effortlessly scanning multiple assets. Receive instant alerts when specific Bollinger Bands conditions are met, ensuring you stay ahead of market movements. Comprehensive Dashboard Insights: Gai

ndicador ADX Crossing Alertby Mr Beast El Indicador ADX Crossing Alert v1.0 es una herramienta avanzada diseñada para potenciar tu análisis técnico en MetaTrader, centrándose en las señales generadas por el cruce del Indicador de Dirección del Movimiento (ADX). Este indicador ofrece alertas visuales en el gráfico y la conveniencia de alertas via email, permitiéndote estar siempre al tanto de las oportunidades de trading. Características Destacadas: ADX Crossing Signals: El indicador utiliza el c
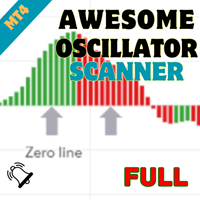
Welcome to the world of advanced trading with the Awesome Oscillator Scanner! Maximize your trading experience with our powerful MT4 indicator designed for seamless analysis and real-time insights. Key Features: Effortless Awesome Oscillator Scanning: Unlock the full potential of the Awesome Oscillator Scanner by effortlessly scanning multiple currency pairs. Receive instant alerts when specific Awesome Oscillator conditions are met, ensuring you stay ahead of market movements. Comprehensive Da

MAD - Moving Average Distance The MAD Indicator uses ATR and the distance to a moving average to determine if price has the potential for mean reversion. Works on all time frames and pairs. It will only check for the condition at the beginning of a new candle so it doesn't repaint. A signal will include an arrow on the chart, alert popup and cell phone notification.
Settings: ATR_Multiplier: Multiplier of ATR for the calculation. (Recommended: 5)
MA_Period: Moving Average Period to use (EMA

Better Support & Resistance показывает оптимальные линии и зоны поддержки/сопротивления. Он основан на фракталах (Fractals) с выбранным вами множителем. Все фракталы собираются, взвешиваются, расширяются и объединяются в четкий набор линий поддержки/сопротивления. Ближайшие линии отображаются в качестве зон, когда цена находится в данной зоне. Better Support & Resistance дает вам полное представление о важных ценовых уровнях.
Настройки Настройки индикатора Support & Resistance по умолчанию дос

Итерационная скользящая средняя - IMA. IMA получается путем коррекции обычной MA, что заключается в добавления к ней также скользящей усредненной разности между временным рядом Х и его MA, т.е. IMA(Х)=MA(Х) + MA (Х-MA(X)), что делается в несколько итераций (а, именно, 2 итерации в данном индикаторе) и с изменением периода усреднения. При этом точки временного ряда начинают более кучно (со всех сторон) группироваться вокруг получаемой IMA и с мен

Индикатор тиковых объемов с возможностью отслеживания резких значительных изменений цены в барах относительно установленного в настройках коэффициента - Change Factor. Цвет гистограммы индикатора характеризуют изменение объема в интересующем баре относительно предыдущей сессии. По умолчанию бары индикатора раскрашиваются в следующие цвета: Зеленый – незначительное увеличение объема, не превышающее Change Factor; Красный – незначительное уменьшение объёма, не превышающее Change Factor; Фиолетовый

Super Trend Bars - индикатор для определения тренда. Он старается найти тренды, которые наиболее склонны к продолжению. Используется набор индикаторов и набор алгоритмов. Вероятность тренда изменяет цвет при обнаружении тренда. Красный цвет означает нисходящий тренд. Светло-зеленый цвет означает восходящий тренд. Super Trend Bar меняет цвет при обнаружении тренда.
Особенности Этот индикатор является самостоятельным индикатором тренда. Он может работать без дополнительных индикаторов. При появл

My Intraday trading session indicator. SL Session Strength 28 Pair https://www.mql5.com/en/market/product/57585 This strategy is even used by the Banks to make profits. They take a strong currency and pitch against a weak currency This indicator allows you to analyze the hidden trends and correlations between the 8 most traded currencies via unique strength meter which creates multiple charts in a single window based on the price action of each currency in relation to all other currenci

Description: The indicator shows the TDI indicator in a separate window, and with the RSI component, the indicator finds possible divergences with M or W patterns. KEY LINKS: How to Install - Frequent Questions - All Products Functions: Finds Market Makers patterns. Finds extremes or exhaustion into the market. Looks for a trend continuation. Content: TDI Indicator Divergence and M or W Signals Note 1: This indicator should only be considered as a part of any trading strategy. You shoul
テクニカル指標開発の第一人者であるトム・デマークが考案した TDシーケンシャルは、 トレンドの転換点を判断するのに有用なインディケータです。このインディケータは TDシーケンシャルを裁量およびEAで実際に利用してきた私自身の経験から、より手軽に、かつ効果的に活用できるよう作成された裁量トレード用サインツールです。
強いトレンドが生じている際に多くのだましが生じるのはTDシーケンシャルの弱点と思われますが、これを克服するために強力なフィルターを装備しています。また、最も有効と思われるセットアップ9に絞ってサインを発信します。
全通貨ペア、全タイムフレームで利用できます。勝敗判定機能により、このインディケータの直近の相場環境に対する有効性を確認できます。
設定項目は下記のとおりです。 Enable Protect Mode...強いトレンドが発生した際の連敗を回避します Box Filter...下で設定する3つのタイムフレームでの移動平均でパーフェクト・オーダーが発生していない状態をボックス相場と判定し、サインを限定します Moving Average Time Frame1
The indicator measures the buying and selling force between the buyers and sellers in the form of a histogram/oscillator by using a BOP equation:
BOP = Moving Average of [close – open)/(high – low)]
Igor Levshin first introduced the Balance of power in the August 2001 issue of Technical Analysis of Stocks & Commodities magazine.
Features
Quickly find the buying and selling pressure among the traders. It comes with simple inputs and an interface. All Metatrader alerts included.
Appli

KT Pip Counter is a simple and informative indicator that shows some essential data and numbers on a real-time basis. Such critical information and data can benefit a trader during an intense trading session.
Features
Shows the current profit/loss in currency, pips, and percentage. Shows the current spreads. Shows the remaining time in the closing of the current bar. The different color schemes for profit/loss scenario. The text position and layout can be fully customized. It uses minimum

KT Trend Magic shows the trend depiction on chart using the combination of market momentum and volatility. A smoothing coefficient is used to smooth out the noise from the signal.It can be used to find out the new entries or confirm the trades produced by other EA/Indicators.
Usage
Drag n drop MTF scanner which scans for the new signals across multiple time-frames. Find new entries in the trend direction. Improve the accuracy of other indicators when used in conjunction. Can be used as a dyna
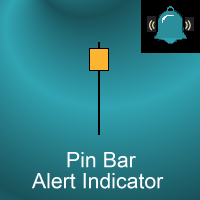
Introduction
This indicator marks Pin Bars (bars with an unusually long upper or lower candle wick) on your chart. It will also send alerts when one forms, including via e-mail or push notification to your phone . It's ideal for when you want to be notified of a Pin Bar set-up but don't want to have to sit in front of your chart all day.
You can configure all the settings including: What proportion of the bar should be made up of the wick How big or small the total size of the Pin Bar has

The KT Currency Strength Meter measures the individual currencies' strength and weakness by applying an aggregated mathematical formula over the major FX pairs. The strength is calculated using the bullish and bearish candles over a fixed period. After filling up the strength data, an algorithm sorts out the strongest and weakest currencies in a stack and updates their orders using the real-time incoming data.
Advantages
Improve your trading strategy instantly by filtering out the signals th
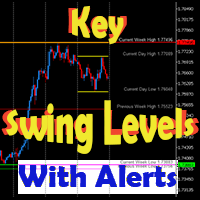
This dynamic indicator will draw the Key Swing High and Low Levels for any symbol on any timeframe!
User may Hide or Show any Level or Label and also Receive Alerts when price returns to that key level via Pop-Up, Push, Email or Sound.
Levels include Current Day High/Low, Previous Day High/Low, Current Week High/Low, Previous Week High/Low and Monthly High/Low.
The Key Levels are labeled with the Price Point Data Listed next to it for quick easy reference.
You can change the Style,

TeconLab Indicator User Guide Overview The TeconLab Indicator is a tool for MetaTrader 4 (MT4) users, fine-tuned to gather price information, including Date, Time, Open, High, Low, Close, and Volume, and update this data in real-time. Uniquely, this indicator autonomously refreshes the CSV file every minute or less, meaning there's no need for manual restarts—just activate it once, and it will continuously collect data as long as MT4 is running. It maintains the latest data according to the size

Вы торгуете внутри дня/недели/месяца, или же вы быстрый скальпер? MCTS покажет вам лучшие валюты в состоянии тренда для торговли на любом таймфрейме. MCTS измеряет силы отдельных валют при помощи уникального алгоритма, а затем объединяет их в пары, чтобы показать вам наилучшие пары для торговли. Контролируйте все 8 основных валют и все 28 пар. Отслеживает силы следующих валют: EUR, USD, GBP, JPY, AUD, NZD, CHF, CAD. Измеряйте истинную силу валюты на любом таймфрейме. Будьте в курсе того, у какой

Индикатор отображает на графике ренко-бары, вычисляет и отображает по их данным скользящую среднюю, PriceChannel и выделяет сигналы для покупки/продажи. Ренко - специализированное отображение движения цены, при котором на график выводится бар временного интервала лишь при условии, что цена прошла более заданного количества пунктов. Ренко-бары не привязаны к временному интервалу, поэтому индикатор с одинаковой эффективностью может работать на любом таймфрейме. PriceChannel - индикатор, отображающ

Индикатор Candle Patterns отображает на графике популярные свечные модели: внутренний бар, длинные тени (Large Wick), поглощение, марубозу, молот, падающая звезда, три белых солдата и три черные вороны. Свечи раскрашены в разные цвета. Также найденная модель отображается с помощью функции point and click.
Настройки Message box - при клике на свечу найденная модель отображается в специальном блоке на графике. Все настройки 'Message Box' относятся к блоку. Show Inside Bars - при true отображаютс

KT Volume Profile shows the volume accumulation data as a histogram on the y-axis providing an ability to find out the trading activity over specified time periods and price levels.
Point of Control (POC) in a Volume Profile
POC represents a price level that coincides with the highest traded volume within the whole volume profile histogram. POC is mostly used as a support/resistance or as an essential price level where market retest before going in a specific direction.
Features Very easy

GG TrendBar Indicator - Your Multitimeframe ADX Trading Solution Experience the power of multi-timeframe trading with the "GG TrendBar Indicator." This versatile tool, built upon the ADX indicator, offers precise insights by considering multiple timeframes, ensuring you make well-informed trading decisions. Basic Details : Indicator Type : GG TrendBar Indicator (Multi-Timeframe ADX) Key Metrics : Real-time ADX analysis across multiple timeframes. Customization : Enable or disable specific timefr
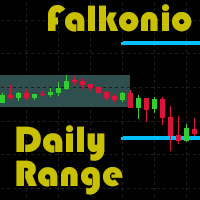
Индикатор подсвечивает указанный период с учетом максимальной и минимальной цен. Можно указать любой период от 1 часа до 24 часов. А так же опционально отображает целевые уровни при торговле на выходе из диапазона в любую сторону. Величина целевого уровня задается в процентах от ширины предшествующего диапазона. Индикатор является развитием и расширением бесплатной версии . Работает на таймфреймах от M1 до H1. На более старших выдает предупреждение.
Настройки индикатора: Length in history - гл

Мультитаймфреймовый индикатор Fisher Divergence для MetaTrader 4, с сигнальными стрелками и свободно перемещаемой панелью сигналов, которая цветом показывает последние сигналы и их время. Индикатор рисует линии на основе времени сигнала. На таймфреймах ниже H4 индикатор ищет сигналы дивергенций H40и строит их на графике толстыми трендовыми линиями, а также рисует для них стрелки. Он также проверяет текущий таймфрейм, рисует линию на месте расположения дивергенции и помещает сигнальные стрелки. Д

Уникальный индикатор IceFX VelocityMeter Mini для платформы MetaTrader 4 измеряет скорость рынка Forex . Это не обычный индикатор объемов или других величин. IceFX VelocityMeter способен понять скорость скрытых в тиках движений рынка, а эта ценная информация не доступна в обычных свечах, поэтому не может быть получена простым индикатором. Этот индикатор контролирует приход тиков (частоту и величину изменения) в пределах указанного диапазона времени, анализирует эти данные, определяет, записывает

Support and Resistance Barry Indicator - Your Path to Precision Trading Explore the world of precision trading with the "Support and Resistance Barry Indicator" for MetaTrader 4. This robust tool is designed to help you identify key support and resistance levels with exceptional accuracy, enhancing your ability to make well-informed trading decisions. Basic Details : Indicator Type : Support and Resistance Barry Indicator Key Metrics : Real-time identification of crucial support and resistance l

Trendfinder SMA With Zone and Alert are Colored candlesticks showing the trend based on two SMA as Signal and two SMA as a Buy and Sell Zone and the slope of the slow moving average. This indicator will give you the color change on the next bar on the confirmation candle and will provide alert on Buy and sell signal, when it enters the buy and sell zone and when the market test the buy or sell zones as support or resistance and will never repaint . This indicator has the following: 2 SMA for th
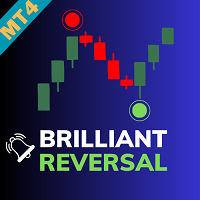
Brilliant Reversal Indicator - Your Ultimate Alert-Driven Trading Solution Unlock the potential for unparalleled trading success with the "Brilliant Reversal Indicator." This powerful tool has been meticulously designed to empower traders by identifying critical reversal opportunities with lightning-fast alerts. Key Features : Precise Reversal Detection : The Brilliant Reversal Indicator specializes in pinpointing potential trend reversals, helping you seize opportunities to enter or exit positi

このインディケータはボリンジャーバンドを裁量およびEAで実際に利用してきた私自身の経験から、より手軽に、かつ効果的に活用できるよう作成された裁量トレード用サインツールです。 ブレイクアウトでの順張り、リバウンドでの逆張りの両面で利用でき、各種のフィルター機能でより精度の高いサインを発信します 勝敗判定機能により、このインディケータの直近の相場環境に対する有効性を確認できます 全通貨ペア、全タイムフレームで利用できます。リペイントはしません
設定項目は以下の通りです。 Bollinger Bands Period
Bollinger Bands Deviation
Bollinger Bands Shift
Entry Mode ...ボリンジャーバンドにタッチしてからのBreakout(順張り), Rebound(逆張り)のどちらかを指定 Plus Filter ...独自アルゴリズムによるフィルターでシグナルの精度を高めます(Reboundモード専用) Trend Filter ...下で設定する移動平均のトレンド方向でのシグナルに限定します Moving Aver

Индикатор строит веер трендовых линий (после клика по определенной свече), подобный классическим углам Ганна. Особенностью индикатора является то, что он строит углы не только по фиксированной шкале, а использует так же среднестатистическую цену определенного количества баров (на выбор). В индикаторе есть два способа расчета средней цены для углов (на выбор): 1) расчет среднего хода цены (за определенное количество баров) от High до Low; 2) расчет среднего хода цены от Open до Close;
Параметры

This indicator provides several drawing tools to assist in various methods of chart analysis.
The drawings will keep their proportions (according to their handle trendline) across different chart scales, update in real time, and multiple drawings are supported.
#
Drawing Option
Description
1 Grid box draggable boxed grid, user defines rows x colums, diagonal ray option 2 Grid partial or fullscreen grid, sized by handle line 3 Grid flex a diagonal grid, sized and sloped by handle line
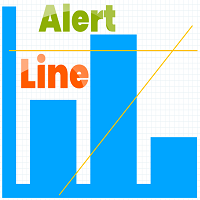
Indicator Rua Alert Line. This indicator will notify when the High-price of candle breaks any TrendLine or HorizontalLine on the chart. Notifications will be sent to the phone and on MT4. And it have ArrowBuy/ArrowSell on chart. It is very useful for those of you who use the TrendLine or HorizontalLine but do not have time to observe the chart. RuaCoder Zalo_Tel: 033.818.8914 Telegram : https://t.me/Ruacoder
MetaTrader Маркет - единственный магазин, где можно скачать демоверсию торгового робота и подвергнуть его проверке и даже оптимизации на исторических данных.
Прочитайте описание и отзывы других покупателей на заинтересовавший вас продукт, скачайте его прямо в терминал и узнайте, как протестировать торгового робота перед покупкой. Только у нас вы можете получить представление о программе, не заплатив за неё.
Вы упускаете торговые возможности:
- Бесплатные приложения для трейдинга
- 8 000+ сигналов для копирования
- Экономические новости для анализа финансовых рынков
Регистрация
Вход
Если у вас нет учетной записи, зарегистрируйтесь
Для авторизации и пользования сайтом MQL5.com необходимо разрешить использование файлов Сookie.
Пожалуйста, включите в вашем браузере данную настройку, иначе вы не сможете авторизоваться.