Смотри обучающее видео по маркету на YouTube
Как купить торгового робота или индикатор
Запусти робота на
виртуальном хостинге
виртуальном хостинге
Протестируй индикатор/робота перед покупкой
Хочешь зарабатывать в Маркете?
Как подать продукт, чтобы его покупали
Технические индикаторы для MetaTrader 4 - 18

Indicator measures strength of each currency in your list.
Main idea: It simply iterates through all combinations of pairs and adds difference between open and close in percent. Parameters: List of currencies - what currencies will be calculated (maximum is 8) Calculation type - from which data will be strength calculated Calculation data input - used as input related to calculation type Symbol suffix - used in case of suffix on symbols, e.g: when your symbols look like EURUSDm, EURUSDmicro et
FREE

If you trade Forex, having detailed information about the currency strength and currency pairs correlation can take your trading to new heights. The correlation will help to cut your risk in half, and strength analysis will help to maximize the profits. This indicator provides a hybrid approach for selecting the most appropriate currency pairs using the strength analysis and currency pairs correlation.
How to use the Currency Strength Analysis
Suppose your trading strategy provides a buying o

EZ Risk Reward Ratio — это простой в использовании индикатор MT4, который позволяет пользователю автоматически изменять соотношение риска и вознаграждения для открытой сделки, просто перетаскивая линии тейк-профита или стоп-лосса в желаемые позиции на любом графике. Соотношение риска и вознаграждения отображается в любом углу, и его можно изменить, просто перетащив линии TP и SL. Сначала поместите индикатор EZ Risk Reward Ratio на график MT4, где должна быть размещена сделка. Во-вторых, откройте
FREE

Индикатор Supply and Demand Zones - один из лучших инструментов, которые мы когда-либо создавали. Этот замечательный инструмент автоматически рисует зоны спроса и предложения - лучшие места для открытия и закрытия позиций. Он имеет множество дополнительных функций, таких как поддержка зон на нескольких таймфреймах, отображение ширины зон, уведомления об измененных зонах и многое другое. Благодаря фрактальности рынка, этот индикатор можно использовать для любого вида торговли. Не имеет значения,
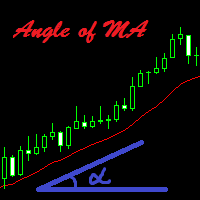
Индикатор высчитывает угол наклона скользящей средней (Moving Average) и выводит результат на экран. Пользователь может выбрать стартовую и конечную точку для измерения угла наклона MA. Так же можно задать значение угла, и если угол наклона будет превышать заданное значение, то индикатор оповестит об этом звуковым сигналом и сообщением на экране.
Настройки Left_Shift_of_MA=1; - Сдвиг МА для вычисления угла наклона (начальная точка) Right_Shift_of_MA=0; - Сдвиг МА для вычисления угла наклона (к

ON Trade Индикатор свечного паттерна Марубозу Паттерн Марубозу — мощный и прямолинейный свечной паттерн, который может предоставить ценную информацию о настроениях рынка и потенциальных разворотах тренда. Он характеризуется свечой с очень маленькой или отсутствующей тенью (килец) на одном конце и длинным телом, простирающимся в направлении текущего тренда. Этот паттерн указывает на сильный дисбаланс между покупателями и продавцами, что подразумевает, что движение на рынке сильно одностороннее. О
FREE
LT Triple Support Resistance Screen Method is a kind of levels indicator that consist of three SR lines. It is built by MQL4 programming language and can be used to MT4 platform. A free version indicator to determine the support and resistance levels easily This indicator works based on the screen method to calculate the most appropriate value for each buffer. A complex algorithm based on long research is applied to this free custom indicator. But this indicator has limited features and simpler
FREE

Те тренды, что Вы видите на графиках не всегда являются трендами или, точнее, трендами на которых можно заработать. Дело в том, что есть два вида трендов: 1) истинные тренды , которые вызываются фундаментальными экономическими причинами, что стабильны и, поэтому, могут обеспечить трейдеру надежный профит; 2) и есть ложные трендовые участки , что только похожи на тренд и возникают из-за цепочек случайных – сдвигающих цену (преимущественно) в одну сторону,

The Breaker Blocks with Signals indicator aims to highlight a complete methodology based on breaker blocks. Breakout signals between the price and breaker blocks are highlighted and premium/discount swing levels are included to provide potential take profit/stop loss levels.
This script also includes alerts for each signal highlighted.
SETTINGS
Breaker Blocks
Length: Sensitivity of the detected swings used to construct breaker blocks. Higher values will return longer te

This is the only Indicator you need to navigate TIME and PRICE . Here I present to you: ICT Killzone Gem Indicator . This indicator will SAVE YOU TIME marking up the charts so you can FOCUS more on your Trades. You can customize it however you like. There is also a toggle switch where you can toggle on or off a specific part so that you can make your charts clean. Watch the video for a Full Explanation . Leave a Review about your experience with this Indicator : ) Inside the Indicator:
2

Индикатор "Scalper Arrows" разработан для скальпингового метода торговли внутри трендовых направлений.
Принцип действия индикатора.
Большие стрелки определяют направление тренда.
Красные стрелки - для медвежьего направления, Зеленые стрелки для бычьего.
Внутри бычьего или медвежьего тренда действует алгоритм генерации сигналов для скальпинга в виде маленьких стрелок.
Так же по направлению тренда рисуются линии направления тренда, по их направлению формируются сигналы маленьких стрелок.
Ж

PipTick Heiken Ashi - это наша версия индикатора Heiken Ashi. В отличие от конкурирующих продуктов, этот индикатор предлагает широкие возможности для расчета свечей Heiken Ashi. Он может отображаться в классическом или сглаженном виде. Данный индикатор рассчитывает Heiken Ashi со скользящей средней четырьмя способами: SMA - простая скользящая средняя SMMA - сглаженная скользящая средняя EMA - экспоненциальная скользящая средняя LWMA - линейно-взвешенная скользящая средняя
Основные характеристи
FREE

O indicador criado por Didi Aguiar, o mestre das Agulhadas!
O padrão do indicador é o cruzamento de três médias móveis simples. Média rápida, período 3. Média normalizada, período 8. Média lenta, período 20.
Quando as três médias se cruzam próximas o suficiente, acontece a agulhada! Pela posição das médias é possível identificar: Agulhada de compra, agulhada de venda, ponto falso e beijo da mulher aranha.
Quer saber mais? Procure pelo site dos robôs oficiais da Dojistar: tradesystembots.co
FREE

TH3ENG CURRENCY STRENGTH SCANNER The best currency strength reader based on more than 4 excellent modes, based on Price action and Volume with various algorithms. This indicator reads all pairs data to measure and find the best results of all currencies and arrange it in a separated dashboard panel.
You can find the strongest currency and the weakest currency, then trade on them pair. NOT COPLICATED NOT REPAINTING NOT LAGING
Input Parameters
=== SYSTEM SETTING === Calc. Mode ==> Calculatio
FREE

MA MTF Overlay Chart is software that allows you to overlay the candlestick chart of a financial instrument with a second candlestick chart of the same one, or of another, financial instrument, by setting a different timeframe from that of the basic chart. The software is very simple to use and the input parameters are listed below.
Input parameters: Overlay chart set-up Financial instrument : financial instrument that you want to overlay on the base chart Time period : secondary instrum
FREE

Keltner Trend Pro - Unleash the Power of Price Action! Are you ready to transform your trading approach? Meet Keltner Trend Pro, an Expert Advisor meticulously crafted to harness the dynamic movements of the market using the renowned Keltner Channel and Average True Range (ATR) indicators. Limited-time Special Opportunity: Seize the moment! Be among the first 10 (Purchasing 0/10) to seize this unique opportunity, and not only will you acquire a top-tier trading algorithm but also enjoy an exclu
FREE

Индикатор ищет зоны покупки и продажи, где можно открыть сделку с минимальным стоп-лоссом и лучшим соотношением риск/прибыль (Risk Reward Ratio). В основе индикатора - качественный поиск паттерна Двойная вершина/Двойное дно. Эта версия работает только на паре USDCAD! Полностью рабочую версию индикатора можно купить здесь - https://www.mql5.com/ru/market/product/29820
Принцип работы индикатора Ищет локальные вершинки/низинки, которые потенциально смогут стать Разворотной зоной Ожидает импульсно
FREE

Прекратите искать и пробовать новые индикаторы! Получите индикатор Winshots Massive FX Profits и выделитесь из толпы.
Годы опыта торговли привели нас к созданию этого универсального индикатора!
Торгуйте как профессионал с Winshots Massive FX Profits!
Этот индикатор использует следующие методологии, чтобы помочь вам стать более последовательным прибыльным трейдером:
- ПРОФИЛЬ ОБЪЕМА РЫНКА - ЕЖЕДНЕВНЫЕ УРОВНИ ПОВОРОТОВ - АНАЛИЗ ЦЕНОВЫХ ЦИКЛОВ
Что такое ОБЪЕМНЫЙ ПРОФИЛЬ?
Профиль об
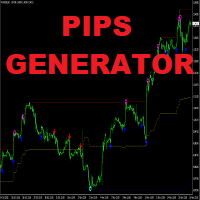
Apollo Pips Generator — это система, которая подает сигналы в направлении тренда. Индикатор предоставляет несколько точек входа, поэтому вы всегда можете найти торговую возможность для получения прибыли. Индикатор также определяет зоны перекупленности и перепроданности, которые можно использовать для закрытия позиции. Рекомендуемый тайм фрейм - H1. После покупки ПОЖАЛУЙСТА, СВЯЖИТЕСЬ СО МНОЙ, чтобы ПОЛУЧИТЬ МОИ РЕКОМЕНДАЦИИ ПО ТОРГОВЛЕ И БОНУС! Желаю вам удачной торговли!

Индикатор Supertrend Line выявляет тренд при помощи расчетов на основе ATR.
Как она работает? Supertrend рисует линию, следующую за текущим трендом. Эта линия строится на основе расчетов по ATR. Линия под свечой означает вероятность бычьего тренда Линия над свечой означает вероятность медвежьего тренда
Как торговать с индикатором CSL Покупайте, когда линия Supertrend находится ниже уровня цены, и продавайте, когда линия Supertrend находится выше уровня цены. Настоятельно рекомендуется исполь
FREE
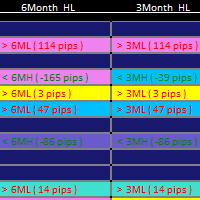
1. Updated usage instructions in blog below: Smart Market Structure Trading System and Automatic Scanner - Trading Systems - 13 October 2023 - Traders' Blogs (mql5.com) https://www.mql5.com/en/blogs/post/754495 2. The Smart Market Structure Opportunity Scanner is a great tool to find trading entries and exits based on Smart Money Concepts. It has a build-in custom choice of Forex pair lists to choose from for the scan, and it also has a user-defined entry choice to put down your own list of Fo
FREE

Ichimoku Trend Finder is a multi symbol multi timeframe trend dashboard that helps traders to monitor and identify potential market trends from one chart. This panel scans the Ichimoku Kinko Hyo indicator in 28 configurable instruments and 9 timeframes for classic Ichimoku trend signals with a deep scan feature to scan all market watch symbols (up to 1000 instruments!).
Download Demo here (Scans only M1 and M5) Settings description here MT5 version here
After the purchase, don't fo

Стрелочный индикатор показывающий разворотные места, где вероятнее всего цена совершит разворот.
Возможности
Может использоваться на любых финансовых инструментах. Сигналы не перерисовываются Работает на любых тайм-фреймах. Имеется несколько видов оповещений для сигналов
Входные параметры
Channel period - Период канала который определяет развороты Smoothing - Сглаживает появление сигналов Calculation method - По какой цене расчет. Close или High/Low Number Bars - Число баров на граф
FREE

Эта система поможет найти высоковероятностные сделки в направлении сильных трендов. Возможность заработать прибыль появляется с помощью поиска завершения движения в одну сторону.
Важная информация Для максимального использования потенциала сканера прочитайте полное описание (на английском языке): www.mql5.com/en/blogs/post/718109 Использование индикатора описано в записи в логе (на английском): Professional Trading With Strong Momentum Бесплатная версия индикатора работает только на парах EURU

M1Arrows is a MT4 trend arrows Indicator
* Smart Scalper Setup (M1) :: Signal 5 Main 20 + Signal 20 Main 80 + Fibonacci ZigArcs 20
(Screenshot1) Add the indicator with first setting,
then add it again to the same graph with other settings.
You can add as many as you want, but 2 M1Arrows in just one graph is enought
Never open orders againt the slow setting trend
Do not open more than 3 orders per slow setting trend
It will work better in Europe/USA markets, * M15 Day Trade Setup: Sig
FREE

Pullback Viewer is designed to show valid pullback points in a bearish or bullish trend.
What is considered a valid pullback?
A valid pullback needs to have a body close outside the previous candle high (in a bearish trend ) or previous candle low (in a bullish trend ). If the candle wicks out the previous candle, it's not a valid pullback.
Pullback must liquidate the previous candle with a clean candle body close.
When is this indicator useful?
It's useful to under
FREE

This indicator will show week and monthhigh low, very useful to understand the market sentiment. To trade within the range/ break out. Low- can act as support- can used for pull back or break out High- can act as resistance- can used for pull back or break out Breakout strategy refers to the day trading technique that provides traders with multiple opportunities to go either long or short . The main idea is to identify the trend in its most juicy state followed by a trending move.
FREE

It is an indicator that analyzes the high and low prices in real time by Dow theory, draws a trend line, and draws the predicted arrival point in the Box format after breaking the low price and the high return price. The high and low prices are determined by the nBars parameter (initial value = 5), but displaying the corresponding moving averages (SMA and EMA 4 to 5 times nBars) at the same time makes it easier to understand the trend change. (D ownload the demo version of the free GreenBox and

CPR Pivot Lines It Will Draw Pivot Point R1,R2,R3 S1,S2,S3 Tc Bc Best Part Is That You Can Even Add Values Of High,Low,Close Manually Also To Get Your All Levels On Chart. So If Your Broker Data Of High ,Low ,Close Is Incorrect Then You Don’t Have To Depend On Them Anymore. You Can Even Modify All Lines Style. It Will Show Line In Floating Style And Not Continues Mess.
FREE

Линии сопротивления скорости - м ощный инструмент для определения тренда и линий сопротивления. Индикатор строит линии с использованием экстремумов графика и специальных математических формул. Индикатор можно использовать для определения направления тренда и точек разворота. <---------------------------->
Параметры индикатора: "Depth of search" - глубина (в барах) поиска экстремумов графика "Back step of search" - минимальное расстояние (в барах) между экстремумами "Deviation of price" - допу
FREE

Time Range Separator - полезный инструмент для отображения разделителей периодов в платформе. Нужно только открыть настройки индикатора, выбрать необходимый диапазон и все. На наш взгляд, это очень полезно, поэтому мы хотели бы поделиться им бесплатно со всеми нашими подписчиками.
Входные параметры: TimeFrame Period Separator - таймфрейм
VLine_Color - цвет вертикальной линии VLine_Style - стиль вертикальной линии VLine_Width - ширина вертикальной линии Удачной торговли и до скорых встреч.
FREE

BeST_ Classic Pivot Points is an MT4 Indicator that is based on the widely known and definitely classic Pivot Point of a market prices activity. A pivot point is calculated as an average of significant prices (high,low,close) from the performance of a market in the prior trading period. If the market in the following period trades above the pivot point it is usually evaluated as a bullish sentiment, whereas trading below the pivot point is seen as bearish. A pivot point and the associated suppo
FREE
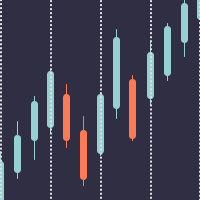
Better Period Separators For MetaTrader 4 The built-in period separators feature doesn’t allow users to specify the time period, so you can use this indicator to create more customizable period separators. On intraday charts, you could place period separators at a specific time, you could also place extra period separators at a specific time on Monday to mark the start of a week. On higher timeframe charts, this indicator works the same as the built-in period separators, On the daily chart, peri
FREE

ITS FREE I Recommend www.CoinexxBroker.com as a great broker and the one I personally use Asia session 1:00 to 9:00 (6pm est to 2 am est) Eur means London Session 10:00 to 18:00 (3 am est to 11 am est) USA means New York Session 15:00 to 23:00 (8 am est to 4 pm est) Session indicator highlights the start of each trading session. You can show all sessions or edit the settings to only show the hours you want highlighted (Asia) means Asian Session ,(Eur) means London Session , (USA) means New
FREE
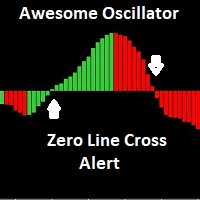
The Awesome Oscillator (AO) is an indicator used to measure market momentum. AO calculates the difference between a 34 Period and 5 Period Simple Moving Average. The Simple Moving Averages that are used are not calculated using closing price but rather each bar's midpoints. This indicator has email and pushup "mobile" features Alert, for any suggestions, please don't hesitate, thanks
FREE

The three white soldiers and the three black crows candlestick patterns are reversal patterns that predict a change in the direction of a trend. The pattern consists of three consecutive long-bodied candlesticks that open within the previous candle's real body and a close that exceeds the previous candle's. It's important to note that both formations are only valid when they appear after a strong uptrend or a downtrend, while their efficiency decreases in choppy markets.
Inputs AlertOn - e
FREE

Волатильность под контролем. Индикатор показывает оптимальную глубину для установки целей внутри дня и на среднем тренде. Также он строит опорные зоны для предполагаемой глубины коррекции. В качестве сопровождения отображаются ключевые уровни структуры по нескольким таймфреймам. Для расчёта используются классические индикаторы волатильности ATR & ADX на фиксированных таймфреймах. В расчётах учитывается спред, и если рынок слабо волатилен вы увидите предупреждение о риске. Можно менять цвет всех
FREE

This indicator tool provides mini charts, with adjustable symbol/tf that can be dragged into place. Lightweight operation with multiple mini charts are supported.
Chart features: adjustable symbol and tf draggable multiple mini charts color styling and font sizing, foreground/background colors candle coloring candle styles; candles, bars, line, high-low channel
zoom in/out
FREE

Или «МАК». Этот индикатор разработан, чтобы помочь вам уловить тренд и торговать по нему. Идею этого индикатора можно объяснить следующими шагами:
Нарисуйте быстро движущийся средний конверт. Нарисуйте конверт медленных средних. Верхняя полоса MAC - это наивысшее значение между максимумом обоих конвертов. Нижняя полоса MAC - это самое низкое значение между минимумом обоих конвертов. Облако гистограммы MAC заполняет расстояние между двумя полосами, чтобы показать вам изменение направления. Син
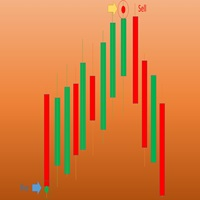
Wave Entry Alerts Oil is a custom indicator developed by Azad Gorgis for MetaTrader 4. This indicator is designed to provide alerts based on ZigZag patterns, specifically tailored for trading on the Oil (XIT/USD) symbol.
Key Features: - Chart Window Indicator: The indicator is designed to be displayed on the main chart window. - Arrow Signals: The indicator generates arrow signals on the chart, indicating potential reversal points based on ZigZag patterns. - Customizable Parameters: Traders c
FREE

Индикатор полностью основывается на классическом индикаторе MFI. Рекомендую посмотреть моего советника - Night Zen EA В нем заложены две базовые стратегии торговли: Выход линии MFI из зон перекупленности/перепроданности. Вход линии MFI в зоны перекупленности/перепроданности. Стрелки рисуются после подтверждения сигнала по стратегиям и не перерисовываются. Также прописаны оповещения: Алерты Push-уведомления в мобильный терминал email Подпишись на мой telegram канал, ссылка в контактах моег
FREE

The Donchian channel is an indicator that takes a series of user-defined periods and calculates the upper and lower bands. Draw two lines on the graph according to the Donchian channel formula. This straightforward formula is based on:
The top line is the highest price for the last periods n The bottom line is the lowest price for the last periods n
Trend systems follow periods when support and resistance levels are broken. in this case when the price breaks the upper line or the lower line
FREE
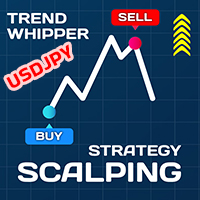
Download the free version here.
A Full Concept of BUY/SELL Scalping Strategy Trend detection is one of the basic challenges of every trader. Finding a way to tell when to enter a trade is very important, timing is a game changer, not too early and not too late. Sometimes, due to not knowing the market conditions, the trader closes his positions with a small profit or allows the losses to grow, these are the mistakes that novice traders make. Indicator Trend Whipper is a complete trading st
FREE
Индикатор Macd 2 линии с торговыми стрелками.
Включает :
Сигнал MACD и линия MACD 2-цветная гистограмма 0 уровень возможные торговые стрелки Как читать :
Индикатор покажет вам стрелку после того, как произошло пересечение, и быстрая линия пройдет выше или ниже нулевой линии! Используйте надлежащее управление рисками и не торгуйте на новостях о высокой волатильности!
ПОСМОТРЕТЬ ДРУГИЕ ПРОДУКТЫ: https://www.mql5.com/en/users/gabedk/seller
FREE

Introduction To Time Box Indicator Time Box Indicator is a must have indicator for any trader. It will display daily, weekly and Monthly box according to your preferences. Yet, you can extend any important price levels in your chart automatically. You can use them as the significant support and resistance levels. It is very simple but effective tool for your trading.
Graphic Setting Use White Chart Line Style for Current Open price
Daily Setting Update Timeframe for daily box Number of days
FREE

Простой алгоритм индикатора с высочайшей точностью генерирует входные сигналы с помощью пересечения линий. Стратегия для торговли по тренду, фильтрация и все необходимые функции, встроенные в один инструмент! Принцип работы индикатора заключается в том, чтобы при размещении на график автоматически определять текущее состояние рынка, анализировать исторические данные, на основании исторических данных и выводить на экран трейдеру указания к дальнейшим действиям. Система сама показывает в виде пере

Индикатор IceFX Heatmap показывает участки на графике, на которых цена наиболее долго оставалась в боковике в пределах последних нескольких дней. Такие участки отображаются в стиле тепловой карты ("Heatmap style"), наглядно демонстрируя основные уровни. Участки, на которых цена задерживалась наиболее долго, показаны более светлым цветом (при черно-белом отображении) или красным цветом (при цветном отображении).
Настройки Days - количество дней, для которых рассчитывается тепловая карта. Resolu
FREE

The MACD 2 Line Indicator is a powerful, upgraded version of the classic Moving Average Convergence Divergence (MACD) indicator.
This tool is the embodiment of versatility and functionality, capable of delivering comprehensive market insights to both beginner and advanced traders. The MACD 2 Line Indicator for MQL4 offers a dynamic perspective of market momentum and direction, through clear, visually compelling charts and real-time analysis. Metatrader5 Version | How-to Install Product | How-t
FREE
This automated VOLUME SCALPING INDICATOR can be utilized to manage trades and identify potential areas of support and resistance for both buying and selling. It is designed to identify zones for Sell/Buy trades based on the volume analysis and can be effectively used in conjunction with other indicators, such as order block indicators, and more. Currently designed for MT4, it will later be adapted to function on MT5. We also offer the opportunity to customize the robot according to your trading
FREE

Простой, но эффективный помощник, который позволит Вам отслеживать, как глобальные, так и локальные тенденции рынка. Индикатор совмещается в себе работу двух осцилляторов: Stochastic и RSI. Оба индикатора можно настроить на любой таймфрейм.
Преимущества использования Мультитаймфреймовость - Вы сможете настроить оба индикатора на нужные таймфреймы. Для получения точек входа можно использовать систему трех экранов Элдера. Гибкая настройка - Вы сможете настроить не только параметры индикаторов, н
FREE
Drawdown Alerts Free ! Meta Trader 4 Indicator. Please leave a review about this product to help other users benefit from it. This Drawdown Alerts indicator shows the drawdown percentage in real time and alerts you when the limit you specify is reached. Calculation of drawdown depends on the amount of the trade balance. You can customize Drawdown Alerts for Corner - Left , Right , Up , Down X Y Color Number of decimal digits Popup messages and sound - Turn on / off notifications Notification
FREE

Этот индикатор является основой для эксперта, который можно отнести к категории "почти Грааль". См. подробности ниже. Этот индикатор отображает проекцию графика ренко на ценовой график. Эта проекция отображается в виде ступенчатой линии, а не в виде "кирпичей" (прямоугольников). См. слайды 1 и 2. Сокращённое название индикатора: LRC – L ine of R enko on the price C hart . Принцип его построения очень прост. Сначала строится сетка горизонтальных линий (уровн
FREE

BuySell Volume is an indicator that approximates Buy and Sell volumes based on price movement. Input Description: applied_model: Choose the applied model. In low reversal mode, price is considered receive low bearish pressure during bullish candle's creation (high bearish pressure on high reversal model. In other words, Bullish Marubozu candles has really high Buy Volumes in low reversal model than in high reversal one.
Output Description: Buy and Sell Volume: Determines how many Buy and Sell v
FREE

Heiken Ashi Button Heiken-Ashi , often spelled Heikin-Ashi, is a Japanese word that means "Average Bar." The Heiken-Ashi approach can be used in conjunction with candlestick charts to spot market trends and forecast future prices. It's useful for making candlestick charts easier to read and analysing patterns. Traders can use Heiken-Ashi charts to determine when to stay in trades while the trend continues and close trades when the trend reverses. The majority of earnings are made when markets a
FREE

Индикатор PipTick Pivot автоматически рассчитывает и отображает линии уровней разворота, а также уровни поддержки и сопротивления. Уровень разворота может рассчитываться по разным формулам: классическая, Floor, Fibonacci, Woodie, Camarilla или DeMark. Можно выбрать период для расчета индикатора. Период может быть дневным, недельным, месячным или пользовательским.
Типы пивотов: Классический. Floor. Fibonacci. Woodie. Camarilla. DeMark.
Основные характеристики Индикатор показывает текущие и ис
FREE
Highly configurable Macd indicator.
Features: Highly customizable alert functions (at levels, crosses, direction changes via email, push, sound, popup) Multi timeframe ability Color customization (at levels, crosses, direction changes) Linear interpolation and histogram mode options Works on strategy tester in multi timeframe mode (at weekend without ticks also) Adjustable Levels Parameters:
Stochastic RSI Timeframe: You can set the lower/higher timeframes for Stochastic RSI. Stochastic RSI
FREE
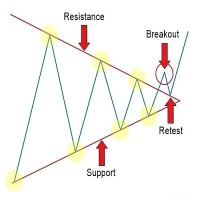
Индикатор автоматически строит значимые трендовые линии и отображает сигналы на покупку и продажу. Сигналы формируются на отражение и на пробой от линий поддержки и сопротивления. При появлении сигнала индикатор отображает его в виде стрелки заданного цвета а также отправляет заданный во входных параметрах тип сообщений. В настройках индикатора можно задавать тип сигнала, максимальное расстояние до трендовой линии, тип оповещений а также настройки линий и стрелок. Индикатор имеет панель на котор

The Trend Finding Channels indicator was developed to help you determine the trend direction by drawing channels on the graphical screen. It draws all channels that can be trending autonomously. It helps you determine the direction of your trend. This indicator makes it easy for you to implement your strategies. The indicator has Down trend lines and Up trend lines. You can determine the price direction according to the multiplicity of the trend lines. For example , if the Down trend lines s
FREE

Представляем Ms. Fibonacci , мощный и бесплатный индикатор, разработанный для упрощения процесса рисования и корректировки уровней Фибоначчи на графике. Этот индикатор автоматически идентифицирует и отмечает новые самые высокие и самые низкие уровни Фибоначчи, обеспечивая точное и точное размещение. Одной из ключевых особенностей Ms. Fibonacci является его способность правильно рисовать уровни Фибоначчи, указывать точки на точки и отмечать соответствующие ценовые уровни. Эта функция экономи
FREE

Indicator automatically draw bullish and bearish engulfing without any rules. Bearish and Bullish engulf is well known area for supply and demand area marking. This indicator can be used in any strategy that required supply demand zone. Show Last Engulf : Enable this option to show unfresh engulfing Candle to calculate : set 0 will load all history bar and can use up more memory Bearish Engulfing Colour : Pick any colour that suit Bearish Engulfing Colour : Pick any colour that suit
-Use thi
FREE

Based on famous and useful indicator - Super Trend, we add some features to make this Indicator much easier to use and powerful. Ease to identify the trend of any chart. Suitable for both Scalping & Swing Better to use in the trending market be careful in sideway market, it might provide some fake signals Setting: ATR Multiplier ATR Period ATR Max Bars (Max 10.000) Show UP/DOWN node Nodes size Show Pull-back signals Pull-back filter ratio Period of MA1 Mode of MA1 Period of MA2 Mode of MA2 A
FREE

To download MT5 version please click here . This is the exact conversion from TradingView: "B-Xtrender" By "QuantTherapy". - It is an oscillator based on RSI and multiple layers of moving averages. - It is a two in one indicator to calculate overbought and oversold zones for different RSI settings. - This indicator lets you read the buffers for all data on the window. - This is a non-repaint and light processing load indicator. - You can message in private chat for further changes you need.
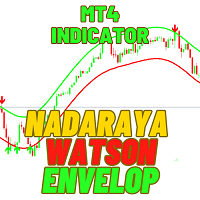
The Nadaraya Watson Envelope is a technical indicator available in the MetaTrader 4 (MT4) platform. It uses a non-parametric method to estimate the underlying trend of a financial asset based on its past price movements. The envelope is created by calculating a weighted average of the asset's past prices, with more recent prices being given greater weight. This produces a smooth curve that represents the estimated trend of the asset. The envelope is then drawn around this curve, with upper and l

Pattern Trader No Repaint Indicator
MT5 Version of the indicator: https://www.mql5.com/en/market/product/57462 Advanced Chart Patterns Tracker MT4: https://www.mql5.com/en/market/product/68550
I ndicator searches for 123 Pattern, 1234 Pattern, Double Top, Double Bottom Patterns , Head and Shoulders, Inverse Head and Shoulders and ZigZag 1.618 Pattern.
Pattern Trader indicator uses Zig Zag Indicator and Improved Fractals to determine the patterns. Targets and Stop Loss Levels are defined

Концепция спроса и предложения с возвратом к среднему значению Концепция торговли по спросу и предложению полагается на несовпадение объемов покупок и продаж на финансовых рынках. Для обычных трейдеров зоны спроса и предложения служат точками разворота. При рассмотрении первоначальной концепции было обнаружено, что первоначальная торговля по спросу и предложению может выполняться лучше на периоде возврата к среднему значению, а не на периоде тренда. Для демонстрации этой концепции, чтобы какая-л

Introduction This indicator detects volume spread patterns for buy and sell opportunity. The patterns include demand and supply patterns. You might use each pattern for trading. However, these patterns are best used to detect the demand zone (=accumulation area) and supply zone (=distribution area). Demand pattern indicates generally potential buying opportunity. Supply pattern indicates generally potential selling opportunity. These are the underlying patterns rather than direct price action. T

The Investment Castle Chances indicator will show signals on the chart for entering a buy or sell trade. There are 2 types of signals for each direction as follows: Buy / Sell (Orange colored candlesticks) Strong Buy (Green colored candlesticks) / Strong Sell (Red colored candlesticks) You may place a buy trade once you see the Buy arrow or vise versa, or you might prefer to wait for a further confirmation “Strong Buy” / “Strong Sell”. This indicator works best with the high time frames H1, H
FREE

The Multi-Timeframe High Low Points (MTF High Low Points) indicator is a powerful tool for traders using MetaTrader 4 (MT4) to analyze price movements across different timeframes. This versatile indicator helps traders identify significant support and resistance levels by displaying the highest and lowest price points within a specified number of bars on multiple timeframes simultaneously. Key Features: Multi-Timeframe Analysis: MTF High Low Points allows traders to monitor high and low price le
FREE

This indicator identifies No Demand –No Supply candles to your chart and plots volume bars colored according to the signal. It can be applied to all timeframes or to a specific one only. It can also be used as regular volume indicator but with exceptional future of WEIGHTED VOLUME. Furthermore is has an alert notification, sound and email when a signals occurs. The indicator does not repaint but the alert will come on two candles back due to the definition of No Demand No Supply. The VSA (Volum

Fibonacci SR Indicator Индикатор рисует линии поддержки и сопротивления. Продукт основан на уровнях коррекции и расширения Фибоначчи (Fibonacci Retracement and Extension levels). Индикатор учитывает многочисленные комбинации уровней Фибоначчи и рисует линии поддержки/сопротивления. При этом в расчетах используются значения вершин и оснований, построенных индикатором ZigZag. При необходимости ZigZag также может быть отображен на графике. Индикатор учитывает многочисленные комбинации предыдущих то
FREE
Узнайте, как легко и просто купить торгового робота в MetaTrader AppStore - магазине приложений для платформы MetaTrader.
Платежная система MQL5.community позволяет проводить оплату с помощью PayPal, банковских карт и популярных платежных систем. Кроме того, настоятельно рекомендуем протестировать торгового робота перед покупкой, чтобы получить более полное представление о нем.
Вы упускаете торговые возможности:
- Бесплатные приложения для трейдинга
- 8 000+ сигналов для копирования
- Экономические новости для анализа финансовых рынков
Регистрация
Вход
Если у вас нет учетной записи, зарегистрируйтесь
Для авторизации и пользования сайтом MQL5.com необходимо разрешить использование файлов Сookie.
Пожалуйста, включите в вашем браузере данную настройку, иначе вы не сможете авторизоваться.