适用于MetaTrader 5的付费技术指标 - 40

Description: Dimatis Watchtower is a powerful backtesting tool designed for traders seeking for an efficient way to test and optimize their trading strategies on the MetaTrader 5 platform. With a minimalist interface and advanced features, this tool provides an outstanding solution for evaluating the performance of your strategies in various market conditions. Key Features: Backtesting: Perform precise and reliable backtests of your strategies using historical data from your broker directly on M

Spread Pulse MT5 指标是一种有效的工具,可为交易者提供有关图表上当前点差的信息。 点差是一种工具的买入价和卖出价之间的差额。
该指标以图表上显示的文本形式呈现。 这使得交易者可以轻松跟踪当前的点差。
Spread Pulse 指标的主要优点之一是其颜色可视化。 根据跨页大小,文本颜色会发生变化。 默认情况下,当点差较小时,文本将为绿色,这意味着点差较低,交易可能会更有利可图。 然而,当点差变高时,指示文字会自动变为红色。
此外,用户还可以自定义与高差和低差相关的颜色。 您还可以更改字体大小以使信息更易于阅读。
Spread Pulse 指标对于任何交易者来说都是理想的选择,无论经验水平和交易策略如何。 它可以快速、轻松地访问有关当前点差的信息,帮助交易者做出明智的决策并改善交易结果。
如果您发现该指标有用,请留下评论。 您的意见对我们非常重要,将帮助我们使指标变得更好。
选项 Spread size - 确定文本颜色的展开大小。 如果跨度大于跨度大小值,则文本为红色(默认情况下)。 当价差较高时,颜色为绿色。 High spread

Supertrend is a trend following indicator based on the Average True Range (ATR) . Calculating the odd line combines trend detection and volatility. It can be used to detect changes in trend direction and position stops.
Basic knowledge Supertrend is a trend following indicator. It takes up space on the main chart and its plots show the current trend. A Supertrend can be used for varying durations (daily, weekly, intraday, etc.) and varying instruments (stocks, futures or forex). Super

Certainly! Let’s discuss the RSI Rush , an aggressive momentum indicator that combines weighted moving averages (WMAs) at lows, mid-price, and tight highs. Here are the key components: Weighted Moving Averages (WMAs) : The RSI Rush employs three WMAs: WMA at Lows : Calculated based on the lowest prices during a specific period. WMA at Mid-Price : Considers the average price (midway between highs and lows) during the same period. WMA at Tight Highs : Based on the highest prices during the speci
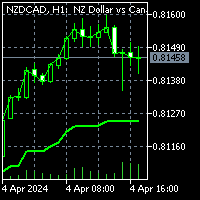
To get access to MT4 version please click here . This is the exact conversion from TradingView: "G-Channel Trend Detection" by "jaggedsoft". This is a light-load processing and non-repaint indicator. You can message in private chat for further changes you need. All input options are available. Buffers are available for processing within EAs. Highlight option is omitted as does not show good in Metatrader.

Breakouts with strong momentum are challenging to catch. The purpose of the Super Breakouts Monitor is to identify such market conditions. This indicator is inspired by a concept from renowned Technical Analyst Tushar Chande, who combines two highly adaptive indicators, VIDYA and the Dynamic Momentum Index (both his creations), to capture the early stages of a successful breakout. At Minions Labs, we've added our unique enhancements to adapt these great ideas for modern markets like stocks, cryp

Higher Timeframe Chart Overlay will display higher timeframe candles, including the number of candles high/low you specify.
You no longer need to switch timeframes to check the candles. Everything can be shown in one chart. MT4 Version : https://www.mql5.com/en/market/product/115680 Almost everything can be change as you want. You can change/set:
- Choose different colors for the body and top/bottom wicks.
- Panel's height and width.
- The width of the body and wicks
- Change backgrou

I'm excited to introduce you to the fifth bar on Martin Armstrong's Forecast Array - The Trading Cycle .
This innovative tool represents a transverse form of cyclical frequency analysis, offering a unique perspective on market trends.
The model employs a color-coded system for easy interpretation. In this model, green signals the ideal timing for highs, red indicates ideal lows, and yellow signifies a convergence of highs and lows occurring simultaneously. This intuitive approach allows

Subscribe to the MA7 Trading channel to receive notifications about new programs, updates and other information. Ask questions in the profile on the MQL5 .
Description of work The MA7 Clover indicator is based on candle shapes. Shows the "Pin Bar" candle pattern. Detailed information about the MA7 Clover indicator.
Indicator settings General settings: Min body size ; Max body size ; Min nose size ; Max nose size ; Minimum pattern size ; Maximum pattern size ; Analysis of the candle directio
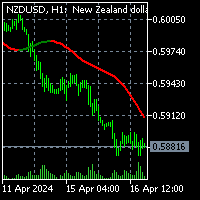
To download MT4 version please click here. - This is the exact conversion from TradingView: "Sentiment Range Ma" By "ChartPrime". - This is a non-repaint and light processing load indicator - You can message in private chat for further changes you need. - All input options are available. - Buffers are available for processing within EAs. - Highlight option is omitted as does not show good in Metatrader.

To download MT4 version please click here .
- This is the exact conversion from TradingView: " PA-Adaptive Hull Parabolic " By "Loxx".
- This is a non-repaint and light processing load indicator
- You can message in private chat for further changes you need.
- All input options are available.
- Buffers are available for processing within EAs.
- Highlight option is omitted as does not show good in Metatrader.

这个 DYJ PowerSignalSource 是基于ATR技术指标的完整交易系统。该指标将分析并记录从M5-MN中每个周期和当前货币对趋势强度 DYJ PowerSignalSource 通过评估这些数据来创建一个趋势强度和入口点信号列表显示。当趋势百分比达大于等于75%时认为是强货币,如果趋势强度百分比达到100时候是最强,则一个警告会弹出来指示这种情况。 该指标可以独立使用判断大趋势信号,并在适当价格进场和离场,并且指标配备了发送信号策略,使用 跟单软件DYJ GameDevice 实现自动开仓关仓。您也能使用震荡类型信号源(例如 DYJ WPR 指示器)接收这些趋势信号,辅助震荡指标的精确入场和离场! Input
InpUseLanguage = English InpPowerSignalMinPercent = 100 // InpPowerSignalMinPercent:Min InpPowerSignalMaxPercent = 100
立即获得触及 3、4 或 5 次的战略区域,使价格磁化 | 根据强力区自动获得点数或价值的 TP1/TP2/TP3 | 直观检查您的风险/回报比是否安全 限时优惠 - 然后恢复到 $99 购买后 | 请联系我的频道 获取推荐设置 MT5 - MT4 版本 | 查看我们的三步MetaMethod,最大化您的利润: 1. TrendDECODER 2. PowerZONES 3. BladeSCALPER 想要获取多日信号图表? >> 订阅我们的 mql5 频道。
为什么更好?
我们在基本的支撑位和阻力位概念上进行了创新,增加了新的功能: 区域: 与线型相比,更符合现实交易情况 强度: 我们提供了一个简单的选项,显示支撑位/阻力位在过去被触及的次数 区域密度: 即两个区域之间的距离;密度越高,区域越多 区域颜色的变化取决于其位置与价格的关系: 如果价格低于区域,则 区域颜色变为 红色;如果价格高于区域,则 区域颜色变 为蓝色。 PowerZONES 将改变您的交易习惯,帮助您避免冲动交易。
我们的指标首次
MA Killer 指标是使用移动平均线的交易者的终极武器。它是一个完整的系统,使用可通过管理面板直接访问的多种工具。借助其工具,您可以全面了解市场并为入职决策提供宝贵帮助。
它包含:
- 趋势图表主指标,使用颜色代码直接在图表上显示趋势。该趋势是通过使用两个移动平均线和多个振荡指标的算法来计算的。
- 移动平均线扫描仪指标,这是一个市场扫描仪,显示 9 个时间单位内与多个移动平均线(最多 4 个)相关的价格位置。
- 是否独立显示多个移动平均线。无需通过指示器选项卡添加或删除它们。
MT4 version
每个系统都有其警报,可以通过弹出、电子邮件和推送通知来接收。警报可以直接通过控制面板激活或不激活。
整个过程由直接显示在图形上的控制面板进行管理。该管理面板允许您通过单击显示或不显示每个功能,以及通过单击管理警报。
它甚至具有“裸图表”功能,只需单击一下即可删除所有元素。
一切的设计都是为了让您的任务更轻松,以便您可以专注于您的决策。
所有系统组件均可通过指示器调整参数进行调整。
所有警报文本均可定制。

indicator is no repaint trend indicator.for mt5 when white stars up to Red histogram that is probably end of long trades. when White stars up to Blue histogram that is probably end of down trades. indicator can use all pairs and lower than weekly charts, to use weekly chart need to at least 500 bars data on back.and lowering processing value 500. it is also suitable for 1m charts. indicator hold long way to go. there is not too many signals.
RSI Pro 分析器指标是一款功能强大的工具,专为希望在多个时间范围内同时做出明智决策的交易者而设计。 该指标利用 RSI 提供超买、超卖和趋势信号,更容易识别入市机会。 它的主要优点是易于阅读, 因为它具有清晰而独特的颜色代码来指示不同的市场状况。
该指标显示五个不同时间范围(D、H4、H1、M30、M15) 的 RSI 值和相关信号,使交易者能够获得全面的市场视角并在多个时间范围内做出明智的决策。
使用颜色变化来识别不同时间范围内的趋势和潜在逆转。 寻找超买和超卖区域,以发现反趋势或趋势逆转的交易机会。
红色: RSI 指示下降趋势。
绿色 :RSI 指示上升趋势。
深红色 :RSI 表示超卖区域。
深绿色 :RSI 发出超买区域信号。
您还可以通过弹出、电子邮件和推送通知发送的精确警报来通知购买和销售条目。
RSI Pro 分析器指标是交易者决策过程中的补充工具。 建议将其与其他指标和分析结合使用,以了解市场概况。
MT4版本。
输入参数:
RSI period: 14(默认),可根据您的喜好调整。
Enab
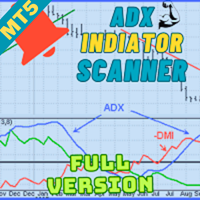
Welcome to advanced trading with the ADX Multicurrency Scanner for MT5! Elevate your trading experience with our powerful MT5 indicator, meticulously designed to offer seamless currency scanning and real-time insights. Key Features: Effortless Multicurrency Scanning: Unlock the full potential of the ADX Multicurrency Scanner for MT5 by effortlessly scanning multiple currencies. Receive instant alerts when specific conditions are met, ensuring you stay ahead of the market and capitalize on every

DYJ StochasticSignalSource随机振荡指标 显示为两条线。主线称为%K线。第二条线,称为%D线,是%K的移动平均线。 %K线通常显示为实线而%D线显示为虚线。有很多方法来解释随机振荡指标。其中有4种方法比较常用: 随机振荡指标(或%K或%D)降到特定水平以下(例如,20),可以买入。当随机振荡指标上升到特定水平以上(例如,80),需要卖出。 在线内区域交叉:K、D线在20以下时,%K线升到%D线以上买入。K、D线在80以上时,%K线降到%D线以下卖出。 只要交叉:%K线升到%D线以上买入。%K线降到%D线以下卖出
随机振荡指标(或%K或%D)升到特定水平以上(例如,20),可以买入。当随机振荡指标下降到特定水平以上(例如,80),需要卖出。 您能使用 DYJ Mathematical model trader 指标交易分析模型,显示指标真实交易开仓和关仓以及计算总体利润和最大浮动亏损! 此外, DYJ StochasticSignalSource随机振荡指标 还在入场点和出场点标记了彩色箭头,并且还根据这些位置实时统计总利润和最大浮亏2项判断交易概率的重要数据
Welcome to the world of advanced trading with the MACD Multicurrency Scanner for MT5! Elevate your trading experience with our powerful MT5 indicator meticulously designed for seamless analysis and real-time insights. Key Features: Effortless MACD Scanning: Unlock the full potential of the MACD Multicurrency Scanner for MT5 by effortlessly scanning multiple currency pairs. Receive instant alerts when specific Moving Average Convergence Divergence (MACD) conditions are met, ensuring you stay ahea

This indicator obeys the popular maxim that: "THE TREND IS YOUR FRIEND" It paints a Blue line for BUY and also paints a RED line for SELL. (you can change the colors). It gives alarms and alerts of all kinds. IT DOES NOT REPAINT COLOR and can be used for all currency pairs and timeframes. Yes, as easy and simple as that. Even a newbie can use it to make great and reliable trades. https://www.mql5.com/en/market/product/115553

Welcome to the future of trading! Are you ready to elevate your trading game to new heights? Introducing a groundbreaking trading indicator that is set to redefine the way you approach the markets. With its unparalleled features and cutting-edge technology, this indicator is not just another tool in your arsenal – it's your secret weapon for success. Imagine having access to real-time alerts that keep you ahead of the curve, ensuring you never miss a lucrative opportunity. Picture a tool that

buy sell stars is a no repaint ,all pairs and all time frames indicator. first set control periot 500 to see signals. it need minimum 500 bars on charts. concept of indicator is wery easy. if white point on the red histogram that means sell . if white point on blue histogram that means buy.. indicator is no repaints.but some times makes drawdown. so case it need to look one upper time frame. indicator is not guarantie the win..

MOST is applied on this RSI moving average with an extra default option added VAR/VIDYA (Variable Index Dynamic Moving Average)
MOST added on RSI has a Moving Average of RSI and a trailing percent stop level of the Moving Average that can be adjusted by changing the length of the MA and %percent of the stop level.
BUY SIGNAL when the Moving Average Line crosses above the MOST Line
LONG CONDITION when the Moving Average is above the MOST
SELL SIGNAL when Moving Average Line crosses belo

Trend based on Extremum Levels and Volatility (基于极端和波动性的趋势1)指标是一个方便的工具,旨在帮助交易者在不同的时间框架上识别趋势突破点和潜在的获利水平。
该指标可用于外汇、期货、股票、指数、商品和加密货币市场。
该通用指标根据局部极值、波动率和平均价格偏差构建趋势,提供可用于小时间框架和大时间框架的有价值信息。
Trend based on Extremum Levels and Volatility 指标的显著特点是能够考虑到独立于输入参数的局部极值,这使其成为分析市场趋势的更客观、更可靠的工具。这种方法消除了将指标拟合到历史数据以显示夸大盈利能力的可能性,从而使其具有更高的价值。这确保了该指标能根据实际市场情况提供更准确、更客观的信号,而不是人为夸大指标。
基于极值和波动性的趋势指标还有一个有用的功能,允许用户使用四种不同的方法获得趋势反转的通知。
- Print
- Alert
- Notification
- Send Mail
此外,该指标还提供根据止损点和进场点计算获利水平的功能

ATR 波段警报是一种通道指标,其通道宽度计算为常数乘数(“乘数”)和“平均真实范围”指标的值。与布林带不同,带宽不会经常改变 - 在 ATR 波段警报指标中,波段通常有长直线。
ATR 波段警报的解释基于这样的事实:价格大多数时间都位于波段内,如果价格达到其中一个边界,则可能表示趋势发生变化。
该指标的特点包括: 如果价格超出该区间,我们应该预期趋势将继续走向突破。
该指标使用 DRAW_COLOR_BARS 样式 - 彩色条(请不要与彩色蜡烛图混淆)。因此,建议将图表切换到条形显示模式。
如果趋势反转,指标会显示买入箭头或卖出箭头。这些箭头的代码可分别在“买入箭头代码”和“卖出箭头代码”参数中设置。箭头代码取自“Wingdings”字体。
如果出现趋势,还可以连接警报:可以包含声音文件,警报,电子邮件或推送到移动终端。
DYJ SignalSourceOfRSI 是一种动量振荡器, 它通过将指定数量的周期内收盘价的升降运动进行对比,指示价格强弱 。
DYJ SignalSourceOfRSI 提供两种信号:
DYJ SignalSourceOfRSI 达到超买或超卖水平,然后出现一点反转: DYJ SignalSourceOfRSI 低于水平 (30) 时生成买入信号,RSI 高于水平 (70) 时生成卖出信号; DYJ SignalSourceOfRSI 跌破水平 (30) 然后升至水平 (30) 上方可被解释为买入信号。 DYJ SignalSourceOfRSI 上升到水平 (70) 以上然后跌破水平 (70) 可以被解释为卖出信号。 您能使用 DYJ Mathematical model trader 指标交易分析模型,显示指标真实交易开仓和关仓以及计算总体利润和最大浮动亏损! 此外, DYJ SignalSourceOfRSI 振荡器还用彩色箭头标记了入场点和出场点,并且还根据这些持仓实时统计总盈利和最大浮动亏损,这是判断交易概率的重要数据。 并且这些BUY与SELL信号

The Heikin Ashi Delta Pro leverages the refined elegance of Heikin Ashi candlesticks, renowned for their ability to filter market noise and highlight clearer trends and reversals. Building on a solid foundation, this advanced indicator integrates the Hull Moving Average method, enhancing its precision and responsiveness. Alongside an intuitive alert system, it transforms raw market data into actionable trading insights, empowering traders to make more informed decisions swiftly. Learn more about

Do you want to know how an economic event will impact price? What will happen to price after the news? How has an economic news affected price in the past? This indicator can help you with that.
Do you like technical analysis? Do you enjoy studying the tick history to predict the future? But what do you think could be more important than technical analysis, what could improve technical analysis? Of course, it's fundamental analysis! After all, economic events directly impact the market, and t
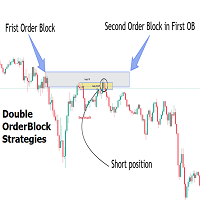
Introduction
The Price Action, styled as the "Smart Money Concept" or "SMC," was introduced by Mr. David J. Crouch in 2000 and is one of the most modern technical styles in the financial world. In financial markets, Smart Money refers to capital controlled by major market players (central banks, funds, etc.), and these traders can accurately predict market trends and achieve the highest profits.
In the "Smart Money" style, various types of "order blocks" can be traded. This indicator
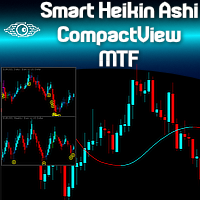
Are you already a fan of the Minions Labs Smart Heikin Ashi chart analysis tool? Or perhaps you're looking for a versatile Heikin Ashi chart capable of operating across multiple timeframes? Want to see the bigger picture before diving into the details, to make smarter ENTRY decisions? Do you want to build your own Dashboard of Symbols in just one chart, without dealing with messy multi-window MT5 stuff? Welcome to the Minions Labs Smart Heikin Ashi CompactView MTF indicator! Please see the power

The Ultimate Trend and Reversals Detector The Ultimate Trend and Reversals Detector is a powerful tool designed to identify potential trend reversal zones in the financial markets. Here are the key features: Objective : Detect trend directions and reversals. Signal Colors : Green : Indicates a potential bullish trend reversal. Red : Signals a potential bearish trend reversal. Non-Repainting : The indicator’s signals are not redrawn, providing reliable information. Suitable for All Styles : Scal

Introduction
"Smart money" is money invested by knowledgeable individuals at the right time, and this investment can yield the highest returns.
The concept we focus on in this indicator is whether the market is in an uptrend or downtrend. The market briefly takes a weak and reversal trend with "Minor BoS" without being able to break the major pivot.
In the next step, it returns to its main trend with a strong bullish move and continues its trend with a "Major BoS". The "order bloc

Introduction
The "Smart Money Concept" transcends mere technical trading strategies; it embodies a comprehensive philosophy elucidating market dynamics. Central to this concept is the acknowledgment that influential market participants manipulate price actions, presenting challenges for retail traders.
As a "retail trader", aligning your strategy with the behavior of "Smart Money," primarily market makers, is paramount. Understanding their trading patterns, which revolve around supply
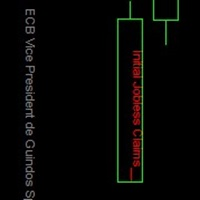
This is one of the most powerful indicators I've ever made.
I was tired of looking at other windows/websites for economical news, and regularly something would happen without me realising.
So I made this indicator which displays all news at the exact time of arrival, directly on the charts!
Now you too can just focus on the charts and know that you won't miss any news events.
There are options:
1. You can choose to display on the price line, or at the bottom of the chart. 2. You can
This is one of my most important indicators. Did you ever miss the session open/close? I did, which is why I made this indicator. It took a long time to get this right, since depending on your platform and timezone, it can be incorrect. It should be accurate for everyone now. It takes into account Daylight savings for NY and EU timezones, and should just work like magic on your charts.
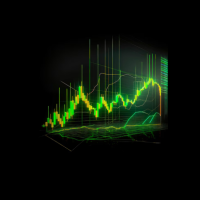
The Boom300 Spike Indicator is a powerful tool designed to identify significant price spikes in the market.
Key Features: Real-time Spike Detection: The indicator continuously scans the market for sudden spikes in price action, providing timely alerts when significant spikes occur. And recommend to use the 1Min chart Customizable Alerts: Traders can customize alerts to suit their preferences, including audible alerts, email notifications, and push notifications to mobile devices. User-Friend

Description: The Spike Sniper Crash Market Indicator is a sophisticated tool designed to identify and navigate volatile market conditions, often associated with sudden price spikes and market crashes. Leveraging advanced algorithms and technical analysis, this indicator serves as a vigilant guardian, alerting traders to potential market disruptions and providing actionable insights to mitigate risks and capitalize on opportunities. Key Features: Precision Spike Detection: The indicator employs c

The indicator determines the ATR value (points) in a classic way (taking into calculation paranormal bars/candles) and more correctly - ignoring paranormal movements of the Instrument. Correctly it is excluding paranormal bars from the calculation, extremely small bars (less than 5%( customizable ) of the standard ATR) and extremely large bars (more than 150% ( customizable ) of the standard ATR) are ignored. This is a Extended version - allows you to set calculation parameters a
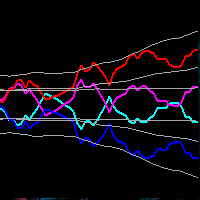
This indicator obeys the popular maxim that: "THE TREND IS YOUR FRIEND" Channel indicators incorporate volatility to capture price action. The Bollinger Bands is widely used, however, there are other options to capture swing action opportunities. Each study you will find here is unique, and reveals different types of price action.
https://www.mql5.com/en/market/product/116256
https://www.mql5.com/en/market/product/115553

This is the MT5 version of Ku-Chart.
This is an indicator devised by Ku-chan, a famous Japanese trader, based on the dealings of Lehman Brothers' discretionary traders. Unify the measuring stick of currencies to display the true value of currencies.
Although it is an indicator, it does not use a buffer and is displayed using objects such as trend lines. Also, instead of drawing on the subchart, it is drawn in an area far above the current price of the main chart, so you can switch from the

Introduction
The "Smart Money Concept" transcends the realm of mere technical trading strategies to embody a comprehensive philosophy on the dynamics of market operations. It posits that key market participants engage in price manipulation, thereby complicating the trading landscape for smaller, retail traders.
Under this doctrine, retail traders are advised to tailor their strategies in alignment with the maneuvers of "Smart Money" - essentially, the capital operated by market makers

Introducing our state-of-the-art Wave Indicator, meticulously designed for the discerning traders of the MQL5 community! At the core of this innovative tool lies an unmatched sensitivity to capture even the slightest market movements. Our Wave Indicator serves as the foundational element for constructing comprehensive trading strategies, providing you with an unwavering edge in the dynamic world of finance. Whether you're aiming to refine short-term tactics or develop long-term systems, this ind
利用 MetaTrader 5 的终极仪表板指标 XDashboard MT5 充分发挥您的交易指标的潜力。 XDashboard MT5 专为追求精准和效率的交易者而设计,可提供跨多个符号和时间范围的任何指标的无与伦比的视图, 全部通过单一、可定制的界面进行。 ** 此价格为限时优惠 ** 特征: 自定义指标集成
全面的多符号监控 多时间框架分析 用户友好界面 实时更新 灵活的警报系统 性能优化
XDashboard MT5 不仅仅是一个指标;它是一个可提高您的交易效率和效力的强大工具。
通过提供市场的整体视图,它使您能够自信地做出明智的决策。
无论您是初学者还是经验丰富的专业人士, 指标仪表板(XDashboard MT5)都能适应您的需求并提升您的交易体验。
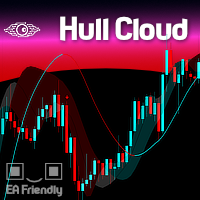
The Hull Moving Average is known for its ability to reduce lag and provide a clearer, more accurate depiction of market trends. By smoothing price data more effectively than traditional moving averages, it helps traders identify trend directions and reversals with greater precision. The Hull Cloud indicator elevates this by using four Hull Moving Averages working together like an orchestra. This combination creates a dynamic system that highlights short, medium, and long-term trends, giving trad
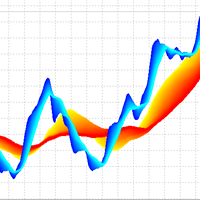
3D Trend Indicator is a non-repaint indicator using multiple moving averages with a 3D surface view. By using this indicator, you can remove uncertainties that can happen using a single and fixed moving average period. You can use a cloud area using a range of moving average periods. Also a wide range of visual settings are added to this indicator to have a better view from the cloud area. Alert and notification system added to the indicator to inform the trader about the action of candles on t
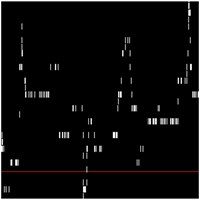
Apresentamos o Indicador de novo grafico - uma ferramenta poderosa para traders que buscam uma análise de preço suave e clara. Este indicador inovador calcula a média simples dos preços, oferecendo uma visão precisa e ajustada dos movimentos do mercado. Como Funciona : O Indicador de Média de Preços Simples (SMA) utiliza uma fórmula simples e eficaz: Ele soma o valor do último preço com o preço anterior. Em seguida, divide essa soma por 2 para obter a média. Fórmula : SMA = U ˊ ltimo Pre c ¸ o +

The Multi Asset Monitor Panel is a game-changer for traders who need to keep an eye on multiple markets simultaneously. This innovative panel allows you to monitor any symbol and any timeframe you need, all within a single, organized interface. With up to three lists of symbols and customizable MT5 templates, you can tailor your monitoring setup to fit your specific trading strategy. What sets the Multi Asset Monitor Panel apart is its flexibility and customization options. You can control the s

O LIVRO VISUAL é uma ferramenta que auxilia na identificação de escoras e renovação de ordens, para quem opera Tape Reading ou fluxo no gráfico é uma excelente ferramenta. Porem ele funciona somente em Mercados Centralizados ou com profundidade nível 2. É de fundamental importância você saber que ele não funciona em Mercado de FOREX. Porem pode ser utilizado no Mercado da B3.

欢迎使用 KMeans Price Zones Detector,这是一款创新的 MetaTrader 指标,利用机器学习的强大功能来识别关键的价格区间。该工具使用 KMeans 聚类算法动态检测价格数据中的中心点,突出显示价格更可能遇到支撑、阻力或整合的区域。 创新的 KMeans 算法 KMeans Price Zones Detector 之所以出众,是因为它先进地使用了 KMeans 聚类算法,这是一种在模式识别中以其效率和准确性而著称的机器学习技术。通过分析历史价格数据,指标识别代表显著价格水平的集群或中心点。然后利用这些中心点计算支撑和阻力区,为交易者提供关于潜在价格反转、突破和整合的重要信息。 主要特点 动态区域检测: 指标根据最新的市场数据不断更新价格区域,确保交易者始终掌握最相关的信息。 适用于所有时间框架: 无论您是在 1 分钟图表上进行短线交易还是在日线图表上进行长期投资,KMeans Price Zones Detector 都能无缝适应,提供准确的区域检测。 兼容所有外汇对: 该指标设计用于任何外汇对,为交易多种货币的交易者提供了灵活性和多功能性。 全面的 A

使用RAR(Relative Adaptive RSI)指标优化您的交易策略! 这一先进的技术分析指标结合了相对强弱指数(RSI)的强大功能和自适应技术,比常见的振荡器提供了更精确和可靠的信号。 什么是RAR指标? RAR是一种为MetaTrader 5设计的指标,使用指数移动平均线(EMA)和自适应移动平均线(AMA)来平滑RSI并动态调整其市场条件。这种创新的组合可以更高的精确度和速度检测市场趋势和强度的变化。 RAR指标的优势 动态适应性 :RAR自动调整以适应不断变化的市场条件,与传统RSI相比,提高了信号的准确性。 市场噪音的减少 :使用EMA和AMA来平滑RSI,减少市场噪音,提供更清晰和可靠的信号。 直观的可视化 :包括一个彩色柱状图,有助于识别市场趋势和强度的变化,帮助做出更明智的交易决策。 有效的趋势检测 :基于平滑RSI的趋势检测功能,能够更有效地识别趋势方向。 高可配置性 :允许调整关键参数,如RSI周期,EMA和AMA,以适应不同的交易策略和风格。 使用方法和信号确认 入场确认 : 支撑和阻力区域 :在价格位于关键支撑和阻力区域时使用RAR确认入场。如果RAR在

Индикатор тиковых объемов представляет собой инструмент технического анализа, используемый для оценки активности трейдеров на рынке. Этот индикатор отображает количество тиков (изменений цен) за определенный временной период и показывает преобладание тиков, направленных на покупку или продажу.
Основные характеристики и функции индикатора тиковых объемов: Гистограмма объемов:
Белый цвет: Означает преобладание тиков, направленных на покупку. Когда количество покупок превышает количество прода
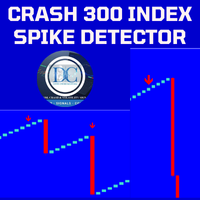
Spike Detector for Boom and Crash Indices
The Spike Detector is specifically designed to cater to the unique needs of traders in the Boom and Crash indices markets. Optimized for M1 (1-minute) and M5 (5-minute) timeframes, this tool ensures you receive timely and actionable insights. Below, you'll find a comprehensive guide on its key features, advantages, installation process, and how to use it effectively.
Key Features and Advantages
1. Non-Repainting: The Spike Detector guarantees accu

Добро пожаловать в новую эпоху торговли с индикатором AI Moving Average, передовым индикатором MetaTrader 5, разработанным для предоставления трейдерам предсказательной информации о движениях рынка. Этот инструмент сочетает в себе мощь ИИ с надежностью экспоненциального скользящего среднего без запаздывания для точных и своевременных прогнозов будущих ценовых тенденций. Инновационная модель линейной регрессии Индикатор AI Moving Average использует модель машинного обучения линейной регрессии для

本指标显示吞没形态,吞没形态是资金流最直接的体现.
吞没形态(Engulfing Pattern)是技术分析中一种常见的价格反转形态,通常出现在价格趋势的终点或关键的支撑与阻力位。它可以分为两种类型:看涨吞没形态(Bullish Engulfing Pattern)和看跌吞没形态(Bearish Engulfing Pattern)。
看涨吞没形态(Bullish Engulfing Pattern) 特征:
前一根K线:这是一个小实体的阴线(开盘价高于收盘价)。 后一根K线:这是一个大实体的阳线(开盘价低于收盘价),且阳线的实体完全包住前一根阴线的实体。 含义:
出现位置:通常出现在下跌趋势的末端,表明卖方力量逐渐衰竭,买方力量开始占据主导。 预示着价格可能反转向上,是一种看涨信号。
看跌吞没形态(Bearish Engulfing Pattern) 特征:
前一根K线:这是一个小实体的阳线(开盘价低于收盘价)。 后一根K线:这是一个大实体的阴线(开盘价高于收盘价),且阴线的实体完全包住前一根阳线的实体。 含义:
出现位置:通常出现在上升趋势的末端,表明

实际应用中的作用
趋势反转识别 :K线倒计时指标通过识别市场的过度买卖行为,帮助交易者捕捉趋势反转的信号。这个指标在市场处于极端状态时尤为有效。 风险管理 :该指标可以帮助交易者在趋势反转之前识别市场的潜在风险,及时调整仓位以避免损失。例如,在看涨倒计时完成时,可以考虑减少多头头寸或在看跌倒计时完成时减少空头头寸。 交易策略 :交易者可以将K线倒计时指标作为交易策略的一部分,与其他技术指标结合使用,以提高信号的可靠性。例如,可以与移动平均线、相对强弱指数(RSI)、布林带等指标结合,以确认趋势反转信号。 时间窗口 :通过倒计时阶段的设定,交易者可以更清晰地了解潜在反转的时间窗口,从而更有效地规划交易策略和执行时间。

Price update indicator — can issue any type of alert when the price reaches certain levels set by a trader. There are three types of price levels: the first one is used when the price rises above certain level (displayed with the green line on the chart), the second one is used when the price falls below certain level (displayed with the red line on the chart), and the third one is used when the price reaches the certain level exactly (displayed with the yellow line). Three alert types include

Evaluate operational viability in each timeframe and in any instrument, according to their respective spread and percentage volatility, which are essential for correct risk management in your trades.
This indicator is essential for both Day Traders and Swing Traders, as in addition to evaluating operational viability in each timeframe, it is also possible to identify the fair minimum stop for each period and instrument.
Example in Swing Trade: your broker charges a spread equivalent to 0.05
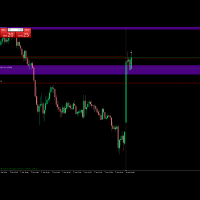
Your average price indicator for the position you were looking for. This indicator inserts a horizontal line on your chart when you are positioned, long or sold, after completing the partial. After completing the partial, it inserts the horizontal line on the graph visually showing where the true BreakEven of the operation is. Take a look the line of point 0 of operation.
OBS: This indicator only works in Netting Account.
Seu indicador de preço médio da posição que estava procurando. Este i

多时间框架和多符号市场扫描仪。该指标将在您选择的所有工具和时间框架上测试所选的技术策略,并在几分之一秒内显示扫描结果。
用例 启动指标,设置交易时间和交易逻辑。确保扫描结果在大多数工具上都是有利可图的,然后通过单击鼠标切换到预期图表。交易信号已准备就绪。确保信号频率适合您,如有必要,请使用“触发灵敏度”选项进行更改。设置屏幕和电话警报。一切已为实时交易做好准备。
特征 - 时间和交易逻辑可自定义。选择顺势、逆势、局部突破、均值回归策略。设置是否在亚洲、伦敦、纽约交易时段进行交易。 - 扫描结果可滚动并按获胜概率排序,可点击切换到扫描图表并绘制交易。 - 不重绘,不滞后。 - 止损和目标根据符号波动性动态计算。对于固定止损,将“最小止损”设置为等于“最大止损”,将“最小获利”设置为等于“最大获利”。 - 可评估的自动交易缓冲区。以下是缓冲区数字:0 - 买入,1 - 卖出,2 - 平仓买入,3 - 平仓卖出,4 - 止损,5 - 获利。这些值是针对打开图表的最后一条柱设置的。 - 在策略测试器中工作。
--- 根据可检查和可重复的数据做出交易决策。如对此指标工作有任何疑问,请

StochastiX is an extension of a well-known indicator.
1) StochastiX is displayed in the range of -100 to 100.
2) A histogram is calculated from the difference of the main and signal curves - again as a stochastic, but without smoothing.
The histogram gives the user a hint about the dynamics of oscillator changes. Patterns need to be studied from real graphs.
I wish you successful trading.

Why the RSI Alert Indicator is Essential for Your Trading Toolkit
In the fast-paced world of trading, timely and accurate information is crucial. The RSI Alert Indicator is a powerful tool designed to help you stay ahead of the market by providing real-time alerts when the Relative Strength Index (RSI) reaches critical levels. Whether you're a novice trader or a seasoned professional, this indicator can significantly enhance your trading strategy by pinpointing potential market reversals with
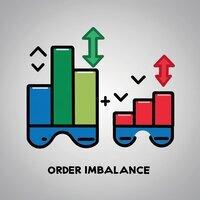
The Order Imbalance indicator, crucial in the toolkit of traders and market analysts, serves to highlight significant disparities between buy and sell orders within a specific financial asset. Essentially, it reveals the difference in volume between buy and sell orders over a defined period, typically in short, frequent intervals ( You can choose the frequency ). For traders, Order Imbalance can be interpreted as a signal of buying or selling pressure in the market. A positive imbalance, where s

Trilliant趋势指标.
Trilliant趋势是一个先进的外汇指标,结合了隐藏的受尊敬的指标来早日发现趋势。 正如名字所示,它是一种趋势指标,但被纳入交易几乎所有外汇战略(所有在一个),操纵设置,带和线在指标。
任何外汇策略都可以使用三元趋势进行交易。 当形成蜡烛触及三角形上带给出购买信号的箭头时,条件会得到满足,而下带则给出卖信号箭头。 中心线(MA)会发出信号箭头,条件是形成蜡烛会穿过它。
Trilliant指标有四个伟大的指标; 1. Trillient带 -- TB (main indicator -None Repainting)
2. 相对强度指数 -- -- 先进的RSI
3. T rilliant Moving Average --Advanced MA
4. 平均真实范围 -- ATR
用来交易时间范围,市场大多是由相对于一天的时间的会议定义。 这取决于每届会议的流动性和速度。
注 : 这个指标中所看到的频段与波林格频段不一样,这是一个名为Trilliant的特别频段,它对早期和比任何频段指示器更快的信号检测产生了最佳效
This is a multi time frame Support and resistance indicator which works on all forex pairs and commodities. Users can also see the historical support and resistance levels which got taken out . For Major Forex pairs like EURUSD, GBPUSD, USDCAD , USDCHF, NZDUSD, AUDUSD, EURCHF enable the s&r levels from 5 minutes from the settings. (Lower timeframe snr levels may act as as noise for major currency pairs.) For Gold and Silver enable all timeframe s&r levels.
Results may vary from broker to br

Indicator Description This indicator displays the highest and lowest prices for the previous day, week, and month. Additionally, it shows pivot levels calculated using different methods: Standard, Fibonacci, Woodie, Camarilla, and Floor pivots. Features: Previous Day High/Low: Indicates the highest and lowest prices of the previous trading day. Previous Week High/Low: Indicates the highest and lowest prices of the previous trading week. Previous Month High/Low: Indicates the highest and lowest p

Jabidabi Session Indicator The Market Session Indicator is a powerful tool used by traders to identify and track different trading sessions within the forex and stock markets. It visually highlights key trading periods, such as the Asian, European, and North American sessions, directly on the trading chart. This indicator is especially useful for traders who follow ICT (Inner Circle Trader) strategies, which emphasize the significance of various market sessions for optimal trading opportunities.

Subscribe to the MA7 Trading channel to receive notifications about new programs, updates and other information. Ask questions in the profile on the MQL5 .
Description of work The MA7 Moss indicator is based on the standard Accelerator Oscillator (AC) indicator. Shows overbought and oversold zones. Detailed information about the MA7 Moss indicator.
Indicator settings General settings: Upper level ; Lower level .
Message settings: Send message to the terminal (Alert) – permission to send m

IMPORTANT: The indicator will remain at the price of $34.90 until the release of the update scheduled for July 16, 2024. The New Price will be $49.90 (taxes excluded) FVG indicator. If you are an SMC trader this indicator will be very useful to you, it automatically identifies the FVGs on the graph distinguishing them into 2 types: bearish FVGs and bullish FVGs (see the photos to understand better). This indicator works on any Timeframe and on any market you want to use it. If you are interested


Order Block indicator, highs and lows; the indicator focuses mainly on OBs, on the chart they are represented with a horizontal line on the minimum and maximum of that candle. While for the maximums and minimums only one line is marked (see the images to understand better). The indicator is for MT5, it works on all Timeframes, on any Forex Pair, on any index and on crypto markets. (For any information on the indicator do not hesitate to contact me). Limited time discount (50%) 74.90$ -> 38.60$
您知道为什么MetaTrader市场是出售交易策略和技术指标的最佳场所吗?不需要广告或软件保护,没有支付的麻烦。一切都在MetaTrader市场提供。
您错过了交易机会:
- 免费交易应用程序
- 8,000+信号可供复制
- 探索金融市场的经济新闻
注册
登录