Guarda i video tutorial del Market su YouTube
Come acquistare un Robot di Trading o un indicatore
Esegui il tuo EA
hosting virtuale
hosting virtuale
Prova un indicatore/robot di trading prima di acquistarlo
Vuoi guadagnare nel Market?
Come presentare un prodotto per venderlo con successo
Indicatori tecnici a pagamento per MetaTrader 5 - 40

Indicator Description This indicator displays the highest and lowest prices for the previous day, week, and month. Additionally, it shows pivot levels calculated using different methods: Standard, Fibonacci, Woodie, Camarilla, and Floor pivots. Features: Previous Day High/Low: Indicates the highest and lowest prices of the previous trading day. Previous Week High/Low: Indicates the highest and lowest prices of the previous trading week. Previous Month High/Low: Indicates the highest and lowest p

Jabidabi Session Indicator The Market Session Indicator is a powerful tool used by traders to identify and track different trading sessions within the forex and stock markets. It visually highlights key trading periods, such as the Asian, European, and North American sessions, directly on the trading chart. This indicator is especially useful for traders who follow ICT (Inner Circle Trader) strategies, which emphasize the significance of various market sessions for optimal trading opportunities.
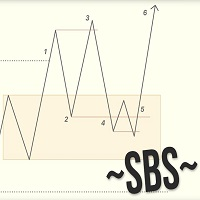
Swing Breakout Sequence | SBS presents a comprehensive trading strategy designed to help traders identify and capitalize on market swings and breakouts. The Swing Breakout Sequence (SBS) strategy is built around a series of well-defined steps to optimize trading decisions and improve profitability. Key Components of the SBS Strategy: Breakout Identification : The initial step involves identifying potential breakouts in the market. This is a crucial phase where traders look for key levels where t
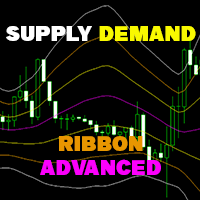
Supply Demand Ribbon is an indicator with moving supply and demand lines that help you identify price zones more easily.
The indicator helps you determine flexible entry, stop loss, and take profit areas.
There are also strategies for algorithmically changing ribbon colors.
From there you can come up with many trading strategies for yourself! You can try the Basic version here ! MT4 version: Click here!
Feature in Advanced version: Hide/Show 2 Supply/Demand Over lines. Hide/Show

Subscribe to the MA7 Trading channel to receive notifications about new programs, updates and other information. Ask questions in the profile on the MQL5 .
Description of work The MA7 Moss indicator is based on the standard Accelerator Oscillator (AC) indicator. Shows overbought and oversold zones. Detailed information about the MA7 Moss indicator.
Indicator settings General settings: Upper level ; Lower level .
Message settings: Send message to the terminal (Alert) – permission to send m

Indicatore di Order Block, massimi e minimi; l'indicatore si concentra principalmente sugli OB,a grafico sono rappresentati con una linea orizzontale sul minimo e sul massimo di quella candela. Mentre per i massimi e minimi viene segnata solo una linea(guarda le immagini per capire meglio). L'indicatore è per MT5, funziona su tutti i Timeframe, su qualsiasi Coppia Forex, su qualsiasi indice e sui mercati cripto. (Per qualsiasi informazione sull'indicatore non esitate a contattarmi). sconto a tem

Indicatore di massimi, minimi e Bos per MT5; L'indicatore funziona su qualsiasi tipo di mercato e su tutti i TimeFrame. Funziona anche sul Tester di MetaTrader5. la funzione principale dell'indicatore è individuare i massimi e i minimi segnandoli con un punto sopra/sotto la candela, poi con una linea orizzontale va a segnare i Bos. E' molto semplice ed intuitivo, sono presenti solo 2 input: -il colore dei massimi -il colore dei minimi Per qualsiasi altra informazione non esitare a contattarmi.
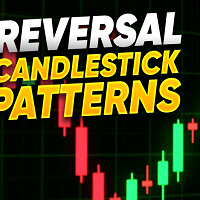
The Reversal Candlestick Structure indicator detects multiple candlestick patterns occurring when trends are most likely to experience a reversal in real-time. The reversal detection method includes various settings allowing users to adjust the reversal detection algorithm more precisely.
A dashboard showing the percentage of patterns detected as reversals is also included. USAGE Figure 1 Candlestick patterns are ubiquitous to technical analysts, allowing them to detect trend continuati
The DYJ SignalSource WPRBashboard signal source is based on the WPR indicator information dashboard It can be used for any currency pair and time frame.
WPR suggests that a metric value between 80% and 100% indicates oversold in the market The indicator value between 0 and 20% indicates that the market is overbought.
The entry signal of this indicator is a turning point in the trend.
It provides reverse trend selection direction.
This indicator uses simulated trading techniques.
It pr

Questo assistente alle notizie è progettato per ottenere gli eventi economici richiesti dai trader dalle principali fonti editoriali, che pubblicano notizie in tempo reale sulla base del Market Watch del terminale con vari e semplici filtri.
I trader Forex utilizzano indicatori macroeconomici per prendere decisioni informate sull'acquisto e sulla vendita di valute. Ad esempio, se un trader ritiene che l’economia statunitense crescerà più velocemente di quella giapponese, potrebbe acquistare i

Questo prodotto è progettato per visualizzare le sessioni di trading di 15 paesi in base al fuso orario del server del tuo broker e varie modalità di visualizzazione in base alle impostazioni desiderate per evitare la congestione del grafico e la possibilità di impostare una sessione con l'orario desiderato dall'utente.
Il sole non tramonta mai sul mercato Forex, ma il suo ritmo balla al ritmo di sessioni di trading distinte. Comprendere queste sessioni, le loro sovrapposizioni e le loro atmo
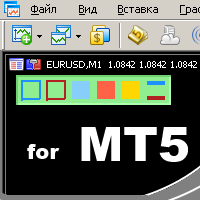
удобный инструмент для тех, кто использует технический анализ с использованием таких инструментов, как Трендовая линия и Прямоугольник. Имеется возможность настройки двух пустых прямоугольников, трех закрашенных и двух трендовых линий. Настройки индикатора крайне просты и делятся на пронумерованные блоки: С цифрами 1 и 2 вначале - настройки пустых прямоугольников (рамок); С цифрами 3, 4 и 5 - настройки закрашенных прямоугольников; С цифрами 6 и 7 - настройки трендовых линий. Объекты создаются оч

To get access to MT4 version please click here . This is the exact conversion from TradingView: " WaveTrend" by LazyBear.
This is a light-load processing and non-repaint indicator. All input options are available. Buffers are available for processing in EAs. You can message in private chat for further changes you need. The filling area option is omitted to fit into MT5 graphics.
Indicatore di Forza della Valuta (Currency Strength Index - CSI) PRIMA DI ATTIVARE L'INDICATORE RICORDA DI METTERE "TRUE" PER VISUALIZZARE LE COPPIE L'indicatore di Forza della Valuta (Currency Strength Index - CSI) è uno strumento potente utilizzato nel trading forex per misurare la forza relativa delle principali valute. Questo indicatore aiuta i trader a identificare le valute più forti e più deboli in un dato momento, permettendo di prendere decisioni di trading più informate. Caratteristic

L'indicatore del dashboard delle bande di Bollinger offre un modo comodo e informativo per monitorare i segnali degli indicatori delle bande di Bollinger in diversi intervalli di tempo utilizzando un pannello (Dashboard). Questo strumento consente ai trader di ottenere rapidamente e facilmente le informazioni di cui hanno bisogno, consentendo un processo decisionale efficiente nel mercato.
Caratteristiche principali:
1. **Pannello Segnali**: il Dashboard mostra i segnali delle Bande di Boll
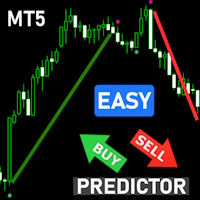
Overview: Elevate your trading strategy with the Advanced SuperTrend Buy Sell Signals Indicator! Designed for both novice and professional traders, this indicator provides clear and accurate buy/sell signals based on the popular SuperTrend algorithm, enhanced with customizable parameters and visual alerts. Features: Clear Trend Visualization: Identifies UpTrends (green line) and DownTrends (red line) with precision. Customizable Parameters: Adjust ATR period and multiplier to fit your trading s

Key Features: Pattern Recognition : Identifies Fair Value Gaps (FVGs) Spots Break of Structure (BOS) points Detects Change of Character (CHoCH) patterns Versatile Application : Optimized for candlestick charts Compatible with any chart type and financial instrument Real-Time and Historical Analysis : Works seamlessly with both real-time and historical data Allows for backtesting strategies and live market analysis Visual Representation : Draws rectangles to highlight significant areas on the cha

the Spike detector show multiple indication for entries, for max profits enter on each indication given u can also add on lots size as entries go to secure max profits before spike occure, the more entries you enter along the way ,the more profits u have after the initial spike, after spike hold 3-5 candles before close for max profits . good on al timeframes max stop loss is 22candles.

RSI Divergence Signal
The RSI Divergence Signal is a technical analysis tool used in financial markets to identify potential trend reversals. It compares the Relative Strength Index (RSI) with price action to detect divergences. When the RSI moves in the opposite direction of the price, it signals a potential change in momentum, suggesting that the current trend may be weakening. This divergence can indicate a buying opportunity in a downtrend or a selling opportunity in an uptrend. Traders
Magnified Price Experience trading like never before with our Magnified Price indicator by BokaroTraderFx , designed exclusively for MetaTrader 5. This revolutionary tool provides traders with instant insights into price movements, offering a clear advantage in today's fast-paced markets.
Key Features: 1. Real-time Precision: Instantly magnify price action to uncover hidden trends and patterns. 2. Enhanced Visibility: Clear visualization of price movements with adjustable zoom levels. 3. Use

** All Symbols x All Time frames scan just by pressing scanner button ** *** Contact me after the purchase to send you instructions and add you in "Order Block group" for sharing or seeing experiences with other users. Introduction: The central banks and financial institutions mainly drive the market, Order block is considered a market behavior that indicates accumulation of orders from banks and institutions, then the market tends to make a sharp move(Imbalance) on either side once

Market Heartbeat is in your hand! Introduction The Market Heartbeat indicator with a special enhanced algorithm (volume, money flow, cycle of market and a secret value) is a very repetitive trend finder with a high success rate . Interestingly, this Winner indicator indicates that the trend has changed its direction or the end of a trend retracement or even appears at the range market. The Market Heartbeat can use in scalping trading or trend trading. It finds immediately with alarm, n
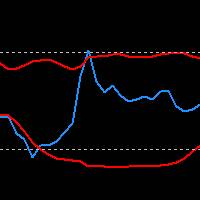
Indicatore RSI con bande di Bollinger: massimizza il win rate con precisione e strategie avanzate di trading. Personalizza il periodo dell'RSI, la media delle bande e la deviazione per adattare l'indicatore alle tue strategie uniche. Su richiesta, offriamo anche la possibilità di personalizzare o creare indicatori customizzati per soddisfare al meglio le tue esigenze di trading.
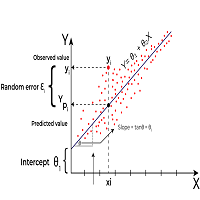
Linear Regression is a statistical method used to model the relationship between two or more variables. The primary goal of Linear Regression is to predict the value of one variable (called the dependent variable or outcome variable) based on the value of one or more other variables (called independent variables or explanatory variables) Linear Regression can be applied to technical analysis, and it is indeed one of the tools used by traders and analysts to make predictions and identify trends i
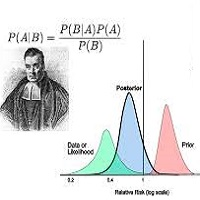
Bayesian methods can be effectively applied to predict price trends in financial markets, including Forex, stocks, and commodities. Here’s how Bayesian techniques can be used for trend prediction: 1. Bayesian Linear Regression Bayesian linear regression can be used to model the relationship between time and price. This method allows for the incorporation of prior beliefs about the trend and updates the trend as new data comes in. Example: Suppose you want to predict the price trend of a currency
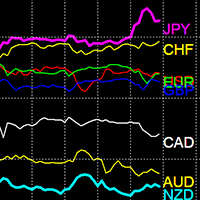
Indicatore di forza valutaria
L’indicatore della forza valutaria è un potente strumento per identificare le tendenze. Confronta la forza e la debolezza di diverse valute e semplifica la ricerca delle coppie di valute di tendenza.
Prezzo di vendita: $ 49
Caratteristiche
Distingue efficacemente tra valute forti e deboli Identifica automaticamente le valute di tendenza Multi-orizzonte temporale Carica 28 coppie di valute Prestazioni ottimizzate
Utilizzo dell'indicatore Valute forti: le v

Dominant Candle Finder is a significant candlestick on a price chart that stands out due to its size, volume, or price movement compared to surrounding candles. It often indicates strong buying or selling pressure and can be used to identify potential reversal points, breakouts, or continuations in the market. Dominant candles can serve as key indicators for traders to make informed decisions, providing insights into market sentiment and potential future price movements. MT4 Version - https://w
This indicator will draw lines for previous day Highs and Lows, current day open price and current day price plus and minus ATR. This will provide an overview of the support and resistance for the price movement of the current trading day. The ATR is fixed to the 1 day period, so this indicator is suitable for the time frames lower than 1 day, i.e. 4HRTF, 1HRTF or 15MTF.

If you like this project, leave a 5 star review.
Follow on TikTok: @quantum.trader
[ Any Symbol Can Be ADDED ] DM me for adding any Pair symbol, crypto, index, stock or anything related. you can also DM me in TikTok [@quantum.trader] Works on [ EURUSD-GBPUSD-GBPJPY-USDJPY-XAUUSD ]
This indicator calculate and draw the Prediction or Forecast the peaks of the current day ( forecast high - forecast low - forecast middle - forecast upper q - forecast lower q )
These are important
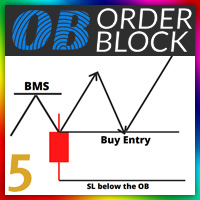
Orde Block Detector: The order block detector can automatically identify the breakthrough of the market structure. After the trend framework breaks through, the order block area can be drawn automatically. In order to draw the OB area more accurately, we also automatically find the candle on the left and right sides of the original candle according to its trading principle, and draw a more accurate ob area through more subtle quantitative rule judgment. Futures : 1. Customize the BMS color, a

RTS5Pattern AVG RTS5Pattern AVG is a revolutionary statistical indicator designed for the MetaTrader 5 platform, bringing an innovative approach to technical analysis and market movement prediction. This indicator combines advanced mathematical methods, including normalization and historical data analysis, with a user-friendly interface and precise trading capabilities. RTS5Pattern AVG is an ideal tool for traders looking to improve their trading strategies and achieve better results. Key Featur
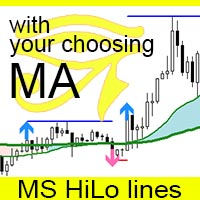
The MS High Low Lines indicator is a tool designed to enhance trend visualization for MT5. It displays high and low prices as lines, using your preferred Moving Average (MA) settings (either SMA or EMA, with customizable periods). The indicator shows configured signals when prices break above or below these MAs. By setting it up with highly functional MAs, traders can better understand market trends and make trades with a statistical edge. You can modify settings and place multiple indicators o

Here is a version for MetaTrader 5 of the famous Wave Trend indicator. Introducing the Wave Trend Oscillator Indicator for MT5 We are excited to present our Wave Trend Oscillator Indicator, exclusively designed for MetaTrader 5. This advanced tool is a must-have for traders who seek precision and efficiency in their trading journey. Our oscillator is built on the principles of wave trend analysis, capturing the ebb and flow of market trends with unparalleled accuracy. It helps traders identify p
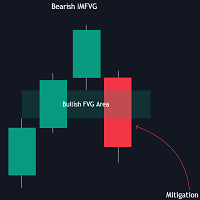
The FVG Instantaneous Mitigation Signals indicator detects and highlights "instantaneously" mitigated fair value gaps (FVG), that is FVGs that get mitigated one bar after their creation, returning signals upon mitigation.
Take profit/stop loss areas, as well as a trailing stop loss are also included to complement the signals.
USAGE Figure 1 Instantaneous Fair Value Gap mitigation is a new concept introduced in this script and refers to the event of price mitigating a fair value gap

Easy Fibonacci è un indicatore per MT5 che permette di tracciare facilmente i ritracciamenti di Fibonacci. Caratteristiche È possibile impostare fino a 10 livelli di Fibonacci dalle impostazioni dell'indicatore. Ogni livello può avere uno stile di linea diverso, colore della linea, larghezza della linea e altre impostazioni personalizzabili. È possibile utilizzare un mouse con pulsanti extra per mappare i tasti V e B e tracciare comodamente i livelli di Fibonacci. Azioni dei pulsanti: B e V: Tra

Indicatore finanziario SolarTrade Suite: Indicatore del mercato terrestre: la tua guida affidabile nel mondo dei mercati finanziari!
Questo sostituisce le candele giapponesi grigie standard, che utilizza speciali algoritmi innovativi e avanzati per calcolarne il valore e ha anche un design gradevole alla vista.
È molto semplice comprendere le letture di questo indicatore: colore blu - acquista, colore rosso - vendi. Più luminoso è il colore, più forte è il segnale.
Dai un'occhiata agli al
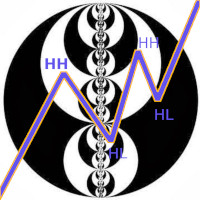
L'indicatore della struttura del mercato nel periodo di tempo corrente trova:
1. Tendenza (onde ascendenti e discendenti). Il cambio di direzione dell'onda si verifica dopo un'interruzione dell'estremo (rimozione della liquidità dal lato opposto). Il rendering della tendenza avviene tenendo conto delle barre esterne (ci possono essere 2 estremi su una barra esterna). La tendenza può essere disegnata tenendo conto del numero minimo di barre nell'onda (2 o più). Configurato dal parametro QTY_ba

The indicator displays the total number of ticks during the formation of a single bar. It can be used to analyze market activity in financial trading. Peaks and troughs of the indicator effectively highlight potential reversal points in price movements. This tool is particularly useful for traders seeking to identify periods of high volatility, allowing them to make informed decisions based on tick volume patterns. By observing changes in tick frequency, traders can gain insights into market se

Limited-Time Offer: Only $49!
Get Insight Flow now for just $49 (was $99)! Hurry, this special price is valid until 30th August . After that, the price returns to $99 . Don't miss out—boost your market analysis today! First and foremost, the Insight Flow Indicator stands out as a Non-Repainting, Non-Redrawing, and Non-Lagging tool. This makes it a prime choice for both manual and algorithmic trading, ensuring reliable and consistent signals. User Manual: Settings, Inputs, and Strat

The trendlines with breaks indicator return pivot point based trendlines with highlighted breakouts. Users can control the steepness of the trendlines as well as their slope calculation method.
Trendline breakouts occur in real-time and are not subject to backpainting. Trendlines can however be subject to repainting unless turned off from the user settings.
The indicator includes integrated alerts for trendline breakouts. Any valid trendlines methodology can be used with the indicator, u
Introducing the Gold Market Arrow Indicator, specifically designed for the 15-minute chart. This advanced tool provides clear and actionable buy and sell arrows, enabling traders to make timely and informed decisions in the gold market. Whether you're a seasoned trader or a novice, our indicator simplifies complex market data into straightforward signals, ensuring you never miss an opportunity to capitalize on gold price movements." This indicator works with a custom build in strategy The indic

Financial Indicator SolarTrade Suite: Uranus Market Indicator - La tua guida affidabile nel mondo dei mercati finanziari!
Si tratta di due medie mobili che utilizzano speciali algoritmi innovativi e avanzati per calcolare il loro valore e hanno anche un design gradevole.
È molto facile comprendere le letture di questo indicatore: colore blu - acquisto, rosso - vendita.
Più luminoso è il colore, più forte è il segnale.
Dai un'occhiata agli altri nostri prodotti della serie SolarTrade Sui

Financial Indicator SolarTrade Suite: Neptune Market Indicator - La tua guida affidabile nel mondo dei mercati finanziari!
Si tratta di sei medie mobili che utilizzano speciali algoritmi innovativi e avanzati per calcolare il loro valore e hanno anche un design gradevole.
È molto facile comprendere le letture di questo indicatore: colore blu - acquisto, rosso - vendita.
Più luminoso è il colore, più forte è il segnale.
Dai un'occhiata agli altri nostri prodotti della serie SolarTrade Su

Per un download gratuito, unisciti al nostro gruppo. Offerta limitata! Panoramica: Identifica le valute più forti a colpo d'occhio con il Currency Strength Chart per MetaTrader 5. Questo potente indicatore fornisce una chiara rappresentazione visiva della forza relativa delle principali valute negli ultimi 30 giorni, permettendoti di prendere decisioni commerciali più informate. Caratteristiche Principali: Analisi Comparativa di 30 Giorni: Confronta la forza di ciascuna valuta principale su un p
A simple indicator for plotting a tick chart.
This indicator will allow you to track the spread dynamics and the price behavior in general.
In the settings, you can select the price to display on the chart - Bid, Ask or both prices at the same time.
Tick Chart Indicator will definitely be useful when using scalping strategies. The MT4 version is available here . Good luck to everyone and successful trading!

Per un download gratuito, unisciti al nostro gruppo. Offerta a tempo limitato! Presentiamo il nostro innovativo indicatore MQL5, progettato per migliorare la tua esperienza di trading fornendo segnali visivi chiari dei confini delle candele giornaliere su timeframe inferiori. Questo strumento è perfetto per i trader che vogliono essere informati sull'andamento delle candele giornaliere, garantendo decisioni migliori ed esecuzione delle strategie. Caratteristiche principali Visualizzazione della
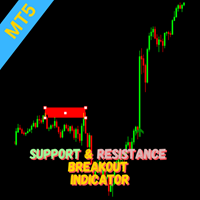
Indicator Overview This indicator utilizes the Zigzag indicator to identify potential support and resistance levels. When the price action breaks through one of these levels, a trading signal is generated. How it Works The Zigzag indicator is employed to pinpoint significant price highs and lows, forming potential support and resistance areas. A signal is triggered when the current candle closes beyond a previously established support or resistance level. Traders can consider entering a position

Breakthrough signal indicator for the MT5 platform: Your reliable assistant in the world of trading!
We are pleased to present you with an innovative signal indicator, which was created in collaboration with an outstanding mathematician. This indicator combines advanced algorithms and the best of the world of mathematical analysis, providing traders with a unique tool for predicting market movements.
Why is this indicator unique?
1 .Entry signals without redrawing If a signal appears, it
The VSA Scanner Dashboard is a multi-symbol, multi-timeframe scanner that displays VSA signals. It is based on the Volume Plus and VSA Signals indicator. Features Displays the VSA signal of the last closed candle. Monitors 28 customizable instruments (symbols) and up to 21 timeframes at the same time. Easily arrange symbols in any order. Each signal has a tooltip that displays the name and time of appearance. Click on each signal to open a new chart. All types of alerts (sound, pop-up, email,
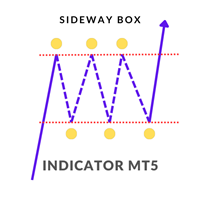
Sideway Box Indicator The Sideway Box Indicator is an advanced trading tool designed to help traders identify and capitalize on sideways market conditions. This powerful indicator detects periods when the market is in a sideways (ranging) phase, providing traders with clear visual cues. Key Features: Sideways Market Detection : The Sideway Box Indicator accurately identifies sideways market conditions, allowing traders to recognize when the price is consolidating within a specific range. Buy/Sel

Adjustable Consecutive Fractals looks for 2 or more fractals in one direction and sends out a on screen alert, sound alert and push notification, for strong reversal points .
Adjustable Consecutive Fractals, shows the fractals on chart along with a color changing text for buy and sell signals when one or more fractals appear on one side of price.
Adjustable Consecutive Fractals is based Bill Williams Fractals . The standard Bill Williams fractals are set at a non adjustable 5 bars, BUT withe
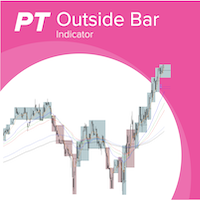
Outside bars (Außenstäbe) are important in professional price action trading and were made popular by Michael Voigt. Highs and lows of outside bars ( Aussenstäbe ) can be utilized as entry and exit for trades following different strategies. With combining different timeframes you can more easily detect the overall trend of the market, see potential resistance and support levels and also detect change in trend and framing of the market. Examples for strategies with inside bars (Innenstäbe) an

This MQL5 Speed Indicator script calculates the average speed of price movements for a selected financial instrument over a specified period. It uses the arithmetic mean to determine the average speed, which is computed by dividing the distance (change in price) by the time interval. The indicator then displays this value as a histogram in a separate window. Average Speed Calculation : The speed is calculated using the formula v = d t v = \frac{d}{t} v = t d , where d d d is the price differen
The "Order Block Indicator for MetaTrader 5" is an advanced trading tool designed to help traders identify key order block zones in the financial markets. Order blocks are areas of institutional buying and selling, often marking significant price levels where market reversals or continuations are likely to occur. This indicator provides a visual representation of these zones directly on the chart, enabling traders to make more informed trading decisions. Key Features: Accurate Order Block Identi

Session Box Indicator for MetaTrader 5
Description: The SessionBox indicator is designed to visually represent the trading sessions on a chart, specifically the Asian, European, and American sessions. This indicator draws customizable rectangles around each session, allowing traders to easily identify different trading periods. It also includes labels to denote each session, enhancing clarity.
Users only need to input the session start and end hours in their server time. Please note, the As
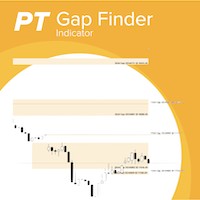
With the gaps finder indicator gaps between trading session are automatically added to you chart and you will never miss a gap which you can use in your trading strategies. Gaps often act as a magnet where the markets returns to or when a gap is closed often constitutes a reversal point.You don't have to draw manually gaps anymore. Key Features: Support for multiple trading sessions in a single chart, e.g market session and future session Configurable number of days to look back for gaps Highly
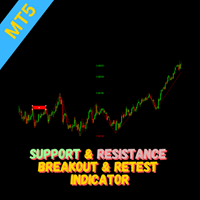
Overview The Breakout and Retest indicator is designed to identify potential trading opportunities by detecting price breakouts from significant support and resistance levels followed by a retest of the broken level. How it Works The indicator analyzes price data to determine key support and resistance areas. When the price decisively breaks through one of these levels and then retest it, then a potential breakout is signaled when it breakout again. To increase the probability of a successful t
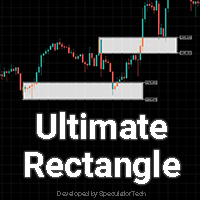
ST Ultimate Rectangle MT5
Introducing our latest MT5 indicator: the upgraded Rectangle Object Indicator. This powerful tool boasts an enhanced rectangular object, allowing for simultaneous color fill and outlining. Plus, it offers the flexibility to display prices conveniently at both the top and bottom of the rectangle. Streamline your trading analysis with this versatile indicator, designed to provide clarity and precision in every trade.
We value your input in further refining our indic

Nel mondo del trading, la chiave per il successo si trova nell'avere gli strumenti giusti al momento giusto. Il nostro innovativo indicatore di Volume Profile è stato sviluppato con un unico obiettivo in mente: fornire ai trader un accesso senza precedenti alle informazioni vitali sulle attività di mercato. Questo strumento all'avanguardia ti permette di vedere non solo dove e quando si scambiano i volumi, ma anche di comprendere la profondità del mercato con una chiarezza mai vista prima. Carat

Introducing our Smart Money Concepts (SMC) and Inner Circle Trader (ICT) Indicator, specifically designed for professional traders seeking precision in their market analysis. This tool seamlessly integrates key SMC/ICT concepts directly onto your charts, providing clear and accurate visual cues.
Key Features: Order Blocks Identification: Automatically detects and highlights both bullish and bearish order blocks, allowing you to see where institutional orders are placed. Customize the color

Massimizza le Tue Opportunità di Trading con l'Indicatore "Auto Trendlines" Scopri l'Indicatore "Auto Trendlines": "Auto Trendlines" è lo strumento essenziale per ogni trader tecnico. Questo indicatore traccia automaticamente le linee di tendenza, identificando i livelli di supporto e resistenza con precisione chirurgica. È ideale per coloro che cercano di capitalizzare sui breakout e sui movimenti di inversione del mercato. Caratteristiche Principali: Tracciamento Automatico delle Linee di Tend

Ottimizza le Tue Decisioni di Trading con l'Indicatore "autoFibo" Scopri l'Indicatore "autoFibo": "autoFibo" è l'indispensabile strumento di analisi per i trader che vogliono sfruttare al massimo i livelli di Fibonacci senza il fastidio di tracciare manualmente. Questo indicatore automatizza il processo di ritracciamento di Fibonacci, offrendo un immediato accesso visivo a supporti e resistenze chiave. Caratteristiche Principali: Ritracciamento Automatico di Fibonacci: Traccia automaticamente i
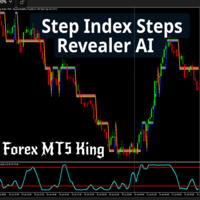
Unlock precision in your trading with the Step Index Steps Revealer AI . This advanced MT5 indicator is your ultimate tool for identifying key price levels on major forex pairs, including GBP/USD, EUR/USD, and others, as well as the step index
Key Features 1. Accurate Price Level Identification Plots precise key levels on major forex pairs like GBP/USD, EUR/USD, USD/JPY, and more. Ideal for traders looking to capitalize on bounce backs and breakouts with accuracy. 2. Optimized for Step Index C

Migliora le Tue Performance di Trading con l'Indicatore "Better Volume" Scopri l'Indicatore "Better Volume": Il "Better Volume" è l'indispensabile strumento di analisi dei volumi di mercato per i trader che desiderano distinguersi. Analizza i volumi dei tick con una precisione senza precedenti, grazie alla sua funzione avanzata di media mobile (PERIOD_MA) e allerte personalizzabili per buy e sell. Caratteristiche Principali: Analisi Avanzata dei Volumi: Riconosci i picchi di volume che segnalano

Il SuperTrend è uno degli indicatori tecnici più efficaci e utilizzati nel trading, ideale per identificare la direzione della tendenza e generare segnali di ingresso e uscita dal mercato. Basato su volatilità e trend, questo indicatore si adatta dinamicamente alle condizioni di mercato, offrendo un riferimento visivo chiaro per i trader. Caratteristiche Principali: Rilevazione della Tendenza: Il SuperTrend segue il trend di mercato, disegnando una linea che si posiziona al di sopra del prezzo i

Fractal Indicator Strategy is an advanced MetaTrader 5 indicator specifically designed for traders who use fractal analysis in their strategies. This indicator provides an essential tool for marking key levels on the chart with horizontal lines, making it easier to identify and follow fractal patterns in the market. Key Features: Fractal Horizontal Lines: Automatically draws horizontal lines at customizable intervals in pips, based on key levels essential for fractal analysis. These horizontal l

Financial Indicator SolarTrade Suite: Comet Market Indicator - La tua guida affidabile nel mondo dei mercati finanziari!
Questo è un indicatore di periodo che utilizza speciali algoritmi innovativi e avanzati per calcolare il suo valore, e ha anche un design gradevole e funzioni aggiuntive.
È molto facile capire le letture di questo indicatore: una linea verticale verde è l'inizio di un nuovo periodo. Come funzioni aggiuntive: - clicca più volte nella metà superiore della finestra del grafi
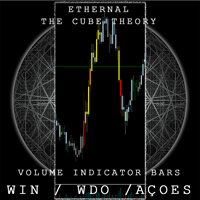
The Cube Bars Brasil pinta os candles de acordo com o volume , excelente para saber os picos de compra e venda . Pode ser regulado livremente pelo usario . Possui regulagem de parametro de entrada para que o usuario tenha a liberdade de regular o colume de acordo com o ativo que escolher . Possui 4 cores que diferenciam os candles de acordo com o tamanho do volume naquele instante
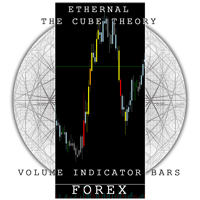
The Cube Bars Forex is an indicator for meta trader 5 created by me Tomas Lekim to color the candlesticks based on the volume peaks of the large investors in the forex market. It tracks the buy and sell peaks and paints the candles according to the amount of money invested by the other robots. It is a powerful tool against large robots because it identifies the moments when it must make decisions. It can be configured according to the currency pair you will use. It has 4 different colors so that

Indicator "Fair Value Gap" (FVG) - Scopri il Potere delle Aree di Sbilanciamento nel Mercato Il mondo del trading è pieno di opportunità nascoste, ma solo chi ha gli strumenti giusti può identificarle e sfruttarle al meglio. Il nostro Indicatore FVG è stato progettato per aiutarti a fare proprio questo. Se sei un trader che cerca di migliorare la sua capacità di leggere il mercato e di trovare i migliori punti di ingresso e uscita, l'Indicatore FVG è l'alleato perfetto per te. Cos'è un Fair Valu
Sai perché MetaTrader Market è il posto migliore per vendere strategie di trading e indicatori tecnici? Non c'è bisogno di pubblicità o di protezione del software, nessun problema di pagamento. Tutto ciò è fornito da MetaTrader Market.
Ti stai perdendo delle opportunità di trading:
- App di trading gratuite
- Oltre 8.000 segnali per il copy trading
- Notizie economiche per esplorare i mercati finanziari
Registrazione
Accedi
Se non hai un account, registrati
Consenti l'uso dei cookie per accedere al sito MQL5.com.
Abilita le impostazioni necessarie nel browser, altrimenti non sarà possibile accedere.