MetaTrader 5용 유료 기술 지표 - 40

Blue and red support and resistance levels displayed directly on the chart. Alerts for close above resistance and close below support. Defaults:
EnableNativeAlerts = false; EnableEmailAlerts = false; EnablePushAlerts = false;
Really easy to trade with. There's no place like SR trading!
Disclaimer:
Support occurs where a downtrend is expected to pause due to a concentration of demand. Resistance occurs where an uptrend is expected to pause temporarily, due to a concentration of supply

Trend change > Arrows (' Up ' and ' Down ') When the icon appears in the indicator buffer ('Up' or 'Down'), Alerts are triggered. You can use 200 EMA to reduce false signals.
Enter trade when the arrow appears but wait until the candle closes Close trade when the line's color changes or use your own closing strategy. Works on all timeframes Works on all currencies Note
works better with other indicators or an existing strategy

SMT (Smart Money Technique) Divergence refers to the price divergence between correlated assets or their relationship to inversely correlated assets. By analyzing SMT Divergence, traders can gain insights into the market's institutional structure and identify whether smart money is accumulating or distributing assets. Every price fluctuation should be confirmed by market symmetry, and any price asymmetry indicates an SMT Divergence, suggesting a potential trend reversal. MT4 Version - https:/
the Spike detector show multiple indication for entries, for max profits enter on each indication given u can also add on lots size as entries go to secure max profits before spike occure, the more entries you enter along the way ,the more profits u have after the initial spike, after spike hold 3-5 candles before close for max profits . good on al timeframes max stop loss is 22candles.

ObieTrader is a short term signals indicator. It is used for intraday trading. ObieTrader identifies the short term trend using Williams percent R indicator and average true range. When a short term trend is confirmed by the indicator, it plots semaphores on the bar to show the trend. Bars with red dots indicate downtrend and bars with blue dots indicate uptrend.
When a trend is identified, open positions in the direction of the trend. When red circles appear open short position. When blue c

RSI Divergence Signal
The RSI Divergence Signal is a technical analysis tool used in financial markets to identify potential trend reversals. It compares the Relative Strength Index (RSI) with price action to detect divergences. When the RSI moves in the opposite direction of the price, it signals a potential change in momentum, suggesting that the current trend may be weakening. This divergence can indicate a buying opportunity in a downtrend or a selling opportunity in an uptrend. Traders

The indicator is based on the relationship between two sets of Stochastic lines. The first set consists of 6 Stochastic with periods: 5, 8, 10, 12, 14, 16. The second set consists of 6 Stochastic with periods: 34, 39, 44, 50, 55, 60. These periods are customizable. Input parameters Stochastic MA Method Method of calculation ===== Short-term ===== Stochastic #1 %K Period Stochastic #2 %K Period Stochastic #3 %K Period Stochastic #4 %K Period Stochastic #5 %K Period Stochastic #6 %K Period Short

Magnified Price Experience trading like never before with our Magnified Price indicator by BokaroTraderFx, designed exclusively for MetaTrader 5. This revolutionary tool provides traders with instant insights into price movements, offering a clear advantage in today's fast-paced markets.
Key Features: 1. Real-time Precision: Instantly magnify price action to uncover hidden trends and patterns. 2. Enhanced Visibility: Clear visualization of price movements with adjustable zoom levels. 3. Us
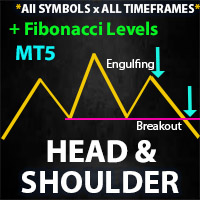
** All Symbols x All Timeframes scan just by pressing scanner button ** *** Contact me after the purchase to send you instructions and add you in "Head & Shoulders Scanner group" for sharing or seeing experiences with other users. Introduction: Head and Shoulders Pattern is a very repetitive common type of price reversal patterns. The pattern appears on all time frames and can be used by all types of traders and investors. The Head and Shoulders Scanner indicator Scans All char

** All Symbols x All Time frames scan just by pressing scanner button ** *** Contact me after the purchase to send you instructions and add you in "Order Block group" for sharing or seeing experiences with other users. Introduction: The central banks and financial institutions mainly drive the market, Order block is considered a market behavior that indicates accumulation of orders from banks and institutions, then the market tends to make a sharp move(Imbalance) on either side once

Market Heartbeat is in your hand! Introduction The Market Heartbeat indicator with a special enhanced algorithm (volume, money flow, cycle of market and a secret value) is a very repetitive trend finder with a high success rate . Interestingly, this Winner indicator indicates that the trend has changed its direction or the end of a trend retracement or even appears at the range market. The Market Heartbeat can use in scalping trading or trend trading. It finds immediately with alarm, n
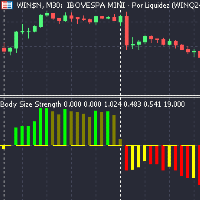
Body Size Strength Indicator Overview The Candle Body Size Strength Indicator provides a comprehensive suite of calculations that analyze daily price movements, delivering actionable insights that can significantly enhance your trading strategies.
Why Choose the Body Size Strength Indicator? Quantitative traders will appreciate the extensive calculations and buffers that this indicator offers. It is designed to integrate seamlessly with algorithmic trading systems, enhancing the precision and
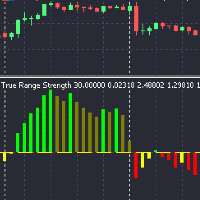
고급 트리거 옵션을 갖춘 트루 레인지 강도 지표 이 지표는 일일 가격 변동과 관련된 다양한 메트릭을 계산하고 표시합니다: 메트릭 트루 레인지 (TR): (고가 - 저가, |고가 - 이전 종가|, |저가 - 이전 종가|)의 최대값 TR 변화율 (TR_ROC): 일일 기준 가격에 대한 TR의 백분율 변화 일일 긍정적 TR ROC 합계: 하루 동안 긍정적인 TR ROC 값의 누적 일일 부정적 TR ROC 합계: 하루 동안 부정적인 TR ROC 값의 누적 일일 긍정적 및 부정적 TR ROC 합계 차이: TR ROC의 순 누적 사용법 지표를 별도의 차트 창에 추가하세요 입력에서 원하는 플롯 유형, 값 유형 및 트리거 유형을 선택하세요 지표를 사용하여 일일 변동성과 가격 이동 추세를 평가하세요 색상 히스토그램은 순 누적 추세에 대한 빠른 시각적 참고 자료를 제공합니다 참고: 이 지표는 각 거래일 시작 시 계산을 초기화합니다
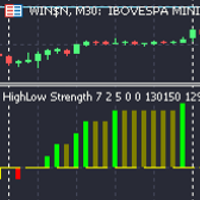
고저 강도 지표 개요 고저 강도 지표 는 하루 중 새로운 일일 최고치와 최저치가 얼마나 자주 발생하는지 모니터링하고 표시하도록 설계된 강력한 도구로, 피크 및 트로프라고도 하며 최고치와 최저치의 빈도를 추적합니다. 이 지표는 시장 동향과 잠재적 반전을 강조하여 시장 분석 및 거래 전략을 강화하려는 투자자, 일일 트레이더 및 양적 트레이더에게 필수적입니다.
주요 기능 이 지표는 "Count New Daily Highs and Lows"와 "Count Highs and Lows"의 두 가지 다른 방법으로 작동합니다. "Count New Daily Highs and Lows" 모드에서는 하루 중 새로운 최고치와 최저치를 추적하여 일일 시장 피크 및 트로프에 대한 통찰력을 제공합니다. "Count Highs and Lows" 모드에서는 현재 기간 내에서 최고치와 최저치를 카운트하여 즉각적인 가격 행동 분석을 수행합니다. 각 모드는 Cumulative Highs, Cumulative
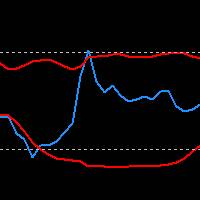
RSI Indicator with Bollinger Bands: Maximize Your Win Rate with Precision and Advanced Trading Strategies Take your trading to the next level with the RSI Indicator combined with Bollinger Bands. Customize the RSI period, band moving average, and deviation to tailor the indicator to your unique strategies. Upon request, we also offer the possibility to customize or create bespoke indicators to best meet your trading needs.
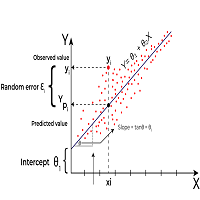
Linear Regression is a statistical method used to model the relationship between two or more variables. The primary goal of Linear Regression is to predict the value of one variable (called the dependent variable or outcome variable) based on the value of one or more other variables (called independent variables or explanatory variables) Linear Regression can be applied to technical analysis, and it is indeed one of the tools used by traders and analysts to make predictions and identify trends i
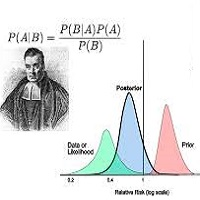
Bayesian methods can be effectively applied to predict price trends in financial markets, including Forex, stocks, and commodities. Here’s how Bayesian techniques can be used for trend prediction: 1. Bayesian Linear Regression Bayesian linear regression can be used to model the relationship between time and price. This method allows for the incorporation of prior beliefs about the trend and updates the trend as new data comes in. Example: Suppose you want to predict the price trend of a currency
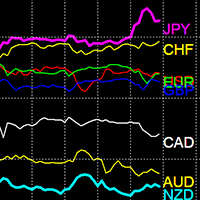
통화 강도 지표
통화 강도 지표는 추세를 식별하는 강력한 도구입니다. 다양한 통화의 강점과 약점을 비교하고 추세적인 통화 쌍을 쉽게 찾을 수 있습니다.
판매 가격: $49
특징
강한 통화와 약한 통화를 효과적으로 구별합니다. 추세 통화를 자동으로 식별합니다. 다중 시간대 28개의 통화쌍을 로드합니다. 성능 최적화
지표 사용법 강한 통화: 80을 넘는 통화는 강한 것으로 간주됩니다. 약한 통화: 20 미만의 통화는 약한 것으로 간주됩니다.
예
EUR가 80을 초과하고 상승 추세에 있고 USD가 20 미만에서 하락 추세라면 EURUSD는 상승 추세에 있습니다.
JPY가 80을 초과하고 상승 추세에 있고 GBP가 20 미만에서 하락 추세라면 GBPJPY는 하락 추세에 있습니다.
지표에 표시된 통화가 높을수록 강세를 나타냅니다. 표시되는 통화가 낮을수록 약세입니다.
지표의 반대편에 있는 통화로 구성된 통화쌍은 일반적으로 강한 추세이며 한동안 지속됩니다.

Dominant Candle Finder is a significant candlestick on a price chart that stands out due to its size, volume, or price movement compared to surrounding candles. It often indicates strong buying or selling pressure and can be used to identify potential reversal points, breakouts, or continuations in the market. Dominant candles can serve as key indicators for traders to make informed decisions, providing insights into market sentiment and potential future price movements. MT4 Version - https://w
This indicator will draw lines for previous day Highs and Lows, current day open price and current day price plus and minus ATR. This will provide an overview of the support and resistance for the price movement of the current trading day. The ATR is fixed to the 1 day period, so this indicator is suitable for the time frames lower than 1 day, i.e. 4HRTF, 1HRTF or 15MTF.
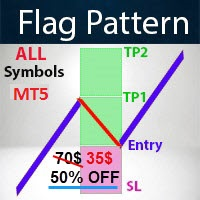
- Real price is 70$ - 50% Discount ( It is 35$ now )
Contact me for instruction, any questions! Introduction A flag can be used as an entry pattern for the continuation of an established trend. The formation usually occurs after a strong trending move. The pattern usually forms at the midpoint of a full swing and shows the start of moving. Bullish flags can form after an uptrend, bearish flags can form after a downtrend.
Flag Pattern Scanner Indicator It is usually difficult for a trade
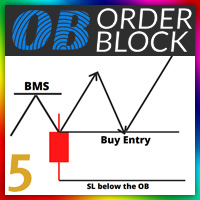
Orde Block Detector: The order block detector can automatically identify the breakthrough of the market structure. After the trend framework breaks through, the order block area can be drawn automatically. In order to draw the OB area more accurately, we also automatically find the candle on the left and right sides of the original candle according to its trading principle, and draw a more accurate ob area through more subtle quantitative rule judgment. Futures : 1. Customize the BMS color, a

RTS5Pattern AVG RTS5Pattern AVG is a revolutionary statistical indicator designed for the MetaTrader 5 platform, bringing an innovative approach to technical analysis and market movement prediction. This indicator combines advanced mathematical methods, including normalization and historical data analysis, with a user-friendly interface and precise trading capabilities. RTS5Pattern AVG is an ideal tool for traders looking to improve their trading strategies and achieve better results. Key Featur

The ICT Propulsion Block indicator is meant to detect and highlight propulsion blocks, which are specific price structures introduced by the Inner Circle Trader (ICT).
Propulsion Blocks are essentially blocks located where prices interact with preceding order blocks. Traders often utilize them when analyzing price movements to identify potential turning points and market behavior or areas of interest in the market.
USAGE (fingure 1) An order block is a significant area on a pric

Here is a version for MetaTrader 5 of the famous Wave Trend indicator. Introducing the Wave Trend Oscillator Indicator for MT5 We are excited to present our Wave Trend Oscillator Indicator, exclusively designed for MetaTrader 5. This advanced tool is a must-have for traders who seek precision and efficiency in their trading journey. Our oscillator is built on the principles of wave trend analysis, capturing the ebb and flow of market trends with unparalleled accuracy. It helps traders identify p
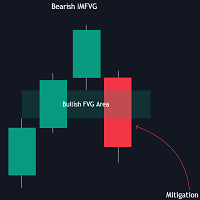
The FVG Instantaneous Mitigation Signals indicator detects and highlights "instantaneously" mitigated fair value gaps (FVG), that is FVGs that get mitigated one bar after their creation, returning signals upon mitigation.
Take profit/stop loss areas, as well as a trailing stop loss are also included to complement the signals.
USAGE Figure 1 Instantaneous Fair Value Gap mitigation is a new concept introduced in this script and refers to the event of price mitigating a fair value gap

Easy Fibonacci는 MT5용 지표로, 피보나치 되돌림을 쉽게 그릴 수 있게 해줍니다. 기능 지표 설정에서 최대 10개의 피보 레벨을 설정할 수 있습니다. 각 레벨은 다른 선 스타일, 선 색상, 선 너비 및 기타 설정을 사용자 정의할 수 있습니다. 추가 버튼이 있는 마우스를 사용하여 V 및 B 키를 매핑하고 피보나치를 편리하게 그릴 수 있습니다. 버튼 동작: B 및 V: 차트의 보이는 영역에 상단/하단 피보나치 그리기 N 및 M: 다음 및 이전 캔들 스윙 확장 R: 재설정 자세한 내용은 비디오 튜토리얼을 참조하세요. Easy Fibonacci는 MT5용 지표로, 피보나치 되돌림을 쉽게 그릴 수 있게 해줍니다. 기능 지표 설정에서 최대 10개의 피보 레벨을 설정할 수 있습니다. 각 레벨은 다른 선 스타일, 선 색상, 선 너비 및 기타 설정을 사용자 정의할 수 있습니다. 추가 버튼이 있는 마우스를 사용하여 V 및 B 키를 매핑하고 피보나치를 편리하게 그릴 수 있습니다. 버튼 동작

금융 지표 SolarTrade Suite: 지구 시장 지표 - 금융 시장 세계에서 신뢰할 수 있는 가이드!
이것은 표준 회색 일본식 촛대를 대체하는 제품으로, 특별하고 혁신적이고 진보된 알고리즘을 사용하여 가치를 계산하고 눈을 즐겁게 하는 디자인도 갖추고 있습니다.
파란색 - 매수, 빨간색 - 매도 등 이 지표의 수치를 이해하는 것은 매우 간단합니다. 색상이 밝을수록 신호가 강해집니다.
설명 하단에서 다른 SolarTrade Suite 제품을 확인하세요.
투자 및 금융 시장의 세계를 자신있게 탐색하고 싶습니까? SolarTrade Suite Financial Indicator: Earth Market Indicator는 정보에 입각한 투자 결정을 내리고 수익을 높이는 데 도움을 주기 위해 설계된 혁신적인 소프트웨어입니다.
SolarTrade 제품군의 장점: 지구 시장 지표:
- 정확한 예측: 우리 지표는 고급 알고리즘과 분석 방법을 사용하여 시장 움직임을 정확
MetaTrader 마켓 - 거래자를 위한 로봇 및 기술 지표는 거래 터미널에서 바로 사용할 수 있습니다.
The MQL5.community 결제 시스템은 MQL5.com 사이트의 모든 등록된 사용자가 MetaTrader 서비스에서 트랜잭션을 수행할 수 있습니다. 여러분께서는 WebMoney, 페이팔, 또는 은행 카드를 통해 자금을 예치하거나 인출하실 수 있습니다.
트레이딩 기회를 놓치고 있어요:
- 무료 트레이딩 앱
- 복사용 8,000 이상의 시그널
- 금융 시장 개척을 위한 경제 뉴스
등록
로그인
계정이 없으시면, 가입하십시오
MQL5.com 웹사이트에 로그인을 하기 위해 쿠키를 허용하십시오.
브라우저에서 필요한 설정을 활성화하시지 않으면, 로그인할 수 없습니다.