适用于MetaTrader 4的付费EA交易和指标 - 236

Expert Advisor 基於經典指標 - 相對強弱指數 (RSI)
已經實施了關於該指標的 3 項工作戰略: 在達到超買/超賣水平時直接打開交易。 當指標圖表在超買/超賣區域形成反轉形態時開倉交易。 當指標值從超買/超賣區域返回時打開交易。 同時開立的買單和賣單的數量是分開設置的。因此,您只能在趨勢方向上使用 EA。還實現了資金管理、追踪止損、移動平均線過濾、撤單以達到盈虧平衡、通知等功能。 Expert Advisor 自動識別 4 位和 5 位報價。
參數說明
Money management - 資金管理參數 UseMoneyManagement - 使用餘額的固定手數或百分比。 Lot - 選擇 FixedLot 時的手數 Percent - 計算手數的百分比 MaxBuyOrders - 同時打開的買單的最大數量 MaxSellOrders - 同時打開的賣單的最大數量 Takeprofit settings - 止盈設置 TakeProfit - 以點為單位的獲利值 StopLoss - 以點為單位的止損值 Trailing settings - 追踪

[EA] EMAGIC is a MetaTrader (MT4) Expert Advisor designed for use with two basic currency pairs EUR/USD and GBP/USD. With individual settings, it can work very well on other currency pairs as well. The EA implements complete, fully functional and exact mechanical trading strategy, with no place for emotions. It is based on standard MT4 indicators "EMA" and "Stochastic Oscillator". The strategy is working on Timeframe M5 only. It is very easy to set up and supervise. [EA] EMAGIC has a set of uniq
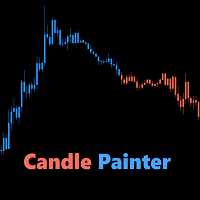
Candle Painter is a 13 in 1 indicator that paints indicators such as all the oscillators, right on top of your chart candles. You can choose from a long list of indicators and follow the trend of the colored candles, or get warned by the overbought/oversold color on the candles. Uptrend and downtrend levels can be set for the oscillators. Oscillators with main and signal lines, such as MACD, Stochastic and RVI, also have the option to follow trend by crossings. Overbought and oversold levels can

Ultimate Pivot Point Scanner (Multi Pair And Multi Time Frame) : ---LIMITED TIME OFFER: NEXT 25 CLIENTS ONLY ---46% OFF REGULAR PRICE AND 2 FREE BONUSES ---SEE BELOW FOR FULL DETAILS For over 100 years (since the late 19th century), floor traders and market makers have used pivot points
to determine critical levels of support and resistance. Making this one of the oldest and most widely used
trading approaches used by traders around the world.
Due to their widespread adoption, pivot point

Round Numbers And Psychological Levels (Multi Pair And Multi Time Frame) : ---LIMITED TIME OFFER: NEXT 25 CLIENTS ONLY ---46% OFF REGULAR PRICE AND 2 FREE BONUSES ---SEE BELOW FOR FULL DETAILS Studies show that more orders end in '0' than any other number. Also know as 'round numbers', or 'psychological levels',
these levels act as price barriers where large amounts of orders will generally accumulate. And the larger the number,
the larger the psychological significance. Meaning that even

EG104 EA, originally ExpandGrid, is a collection of grid styles that have been optimized by intense tests, results from demos and real accounts and results from studies and parameter variations. It is delivered with the default parameters, so the trader does not need to change them to use the EA, just drop it to the chart, enable the style setting magic number and let it play. This EA works with its default values out of the box, but flexibility has always been a priority during developing it. I

Ultimate Consecutive Bar Scanner (Multi Pair And Multi Time Frame) : ---LIMITED TIME OFFER: NEXT 25 CLIENTS ONLY ---46% OFF REGULAR PRICE AND 2 FREE BONUSES ---SEE BELOW FOR FULL DETAILS Unlike the equity markets which tend to trend for years at a time, the forex market is a stationary time series.
Therefore, when prices become severely over extended, it is only a matter of time before they make a retracement.
And eventually a reversal. This is a critical market dynamic that the institution

The Expert Advisor contains multiple trading strategies, including news trading, use of indicators, price velocity and various built-in filters. The EA places pending orders. It has successfully completed stress testing. No Martingale No Arbitrage No any other risky strategy inside No scalping Working currency pair/timeframe: EURUSD H1. Optimized. You can adjust the Expert Advisor to any currency pair!
Key Features: It can work with a small deposit. Only pending orders. Every trade has a tight

Ultimate Range Trade Scanner (Multi Pair And Multi Time Frame) : ---LIMITED TIME OFFER: NEXT 25 CLIENTS ONLY ---46% OFF REGULAR PRICE AND 2 FREE BONUSES ---SEE BELOW FOR FULL DETAILS The FX market is range bound at least 70% of the time. And many of the largest institutions
in the world focus on range trading. Such as BlackRock and Vanguard , who have a combined
$15 TRILLION under management.
Range trading has several distinct advantages that make it safer and more predictable
than

The indicator displays the data of the Stochastic oscillator from a higher timeframe on the chart. The main and signal lines are displayed in a separate window. The stepped response is not smoothed. The indicator is useful for practicing "manual" forex trading strategies, which use the data from several screens with different timeframes of a single symbol. The indicator uses the settings that are identical to the standard ones, and a drop-down list for selecting the timeframe.
Indicator Parame
Object Synchronizer : Better focus/analysis of the price chart in many time frames. Are you bored to save and load template many times for the same symbol for many chart time frames? Here is the alternative. With this indicator, you enjoy creating objects across many charts, you can modify the same object in any chart, you can delete the same object in any chart. All objects that you created/modified always are synchronized across all chart windows (with same symbol). Save your time, you can foc

The Flying Volume indicator is a specialized volume indicator. It deciphers the volume data after heavy proprietary number crunching. When a main signal is found Flying Volume will look for possible continuation points. The main signal is shown by arrows, the continuation points by dots. Volume indicators are most often used on higher timeframes.
Features Main Buy or Sell signals Continuation signals No repainting One signal per bar
Settings Flying Volume default settings are good enough mos

Ultimate Breakout Scanner (Multi Pair And Multi Time Frame) : ---LIMITED TIME OFFER: NEXT 25 CLIENTS ONLY ---46% OFF REGULAR PRICE AND 2 FREE BONUSES ---SEE BELOW FOR FULL DETAILS Breakout trading is one of the most popular trading approaches used in the institutional trading world.
As it takes advantage of the never ending phenomena of price expansion and contraction (through volatility) .
And this is how institutional traders are able to take advantage of explosive moves in the market .
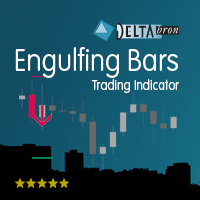
The Engulfing Bars indicator shows Engulfing Bars, the signal and the suggested stoploss and take profit. Engulfing Bars are an important price action pattern. The price action of an Engulfing Bar completely covers the price action of the previous bar. Engulfing Bars are most often used on higher timeframes.
Settings Engulfing Bars default settings are good enough most of the time. Feel free to fine tune them to your needs. Show Engulfing Bars - Set to true to show Engulfing Bars. Body size pe
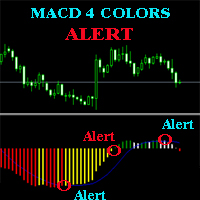
The MACD ALERT 4 COLORS is an indicator, that helps you to check MACD's value changes easily with 4 clear colors: when MACD grows up and above 0, it will have green color when MACD goes down and still above 0, it will have white color when MACD goes down and below 0 value, it will have red color when MACD grows up and below 0 value, it will have yellow color The indicator also generates alerts for you, with two alert types (see screen shot): Alert1 : (true/false) the alert will trigger when MACD
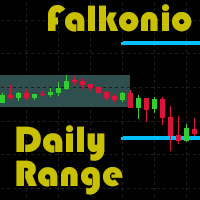
The indicator highlights the affected period taking the highest and the lowest prices into account. It is possible to choose any time period from 1 hour to 24 hours. It also optionally shows the target levels when trading at the breakout of the range in any direction. The target level value is given in percentages of the width of the previous range. The indicator is the improvement and extension of the free version . It works on timeframes from M1 to H1. It warns at the higher timeframes.
Sett

The script greatly simplifies trader's work with pending stop orders (BuyStop, SellStop). The script places any number of pending orders at a user-defined distance (in points). Order expiration time in seconds can also be specified. It is also possible to place only Buy Stop or only Sell Stop orders. All stop orders are accompanied by user-defined take profit and stop loss levels. Volume is customizable as well.
Parameters Open BuyStop - place a pending Buy order Open SellStop - place a pendin

Searches on every symbol on MT4 MarketWatch. System Stoller% uses Williams% and StarcBands to calculate trend, entries and exits. Works only for H1 timeframe.
Input parameters: Period: Number of bars to search. Refresh_min: Number of minutes to wait between searches. ShowTrendChanges: Signals on trend changes. ExtendPeriod: Extend period to calculate signals order. UseADXFilter: Confirm entry using ADX on M15. BullColor: Font color on buy entries BearColor: Font color on sell entries.
Result
The SCRIPT opens , modifies , and deletes all types of orders: BUY, SELL, BUYLIMIT, SELLLIMIT, BUYSTOP, and SELLSTOP.
Features Orders can be opened both by comments and magic. Order grids. Take profit and stop loss modification. Orders can be removed by type, magic, and comments. Market orders are deleted if magic = 0. Notification window appears after orders are opened, modified or removed. Multi-task script. Modification is performed after opening orders.
Parameters Orders_Tip - consists o

ADX Pointer is an indicator which is based on "Average Directional Index" and draws three numbers in chart window depending on the value of ADX. In ADX Pointer you can set "ADX_Period" which is of course period of Average Directional Index and you can also set 3 levels. When ADX value exceed first level ("ADX_Level1") in chart window appears number "1", when ADX exceed second level ("ADX_Level2") appears "2" and when ADX exceed third level ("ADX_Level3") appears "3". Simple. ADX Pointer works on

This is an adaptive grid Expert Advisor that applies Fractals and Fibo levels and is based on the price behavior. An Average weighted stop loss can be used to limit losses. Average volatility, speed and direction are also applied by the strategy. The Expert Advisor is designed for maximum effective real trading in today's market conditions. It does not require special conditions, does not depend on the trading account type, the broker, or the financial instrument. It works well with small and la
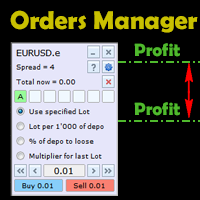
This is an irreplaceable assistant for manual trading providing maximum automation of daily routine calculations, convenient system of opening and maintaining trades and also their closure on reaching a specified adjustable level. The untility provides maximally clear and complete information on the current situation of each instrument separately and features the convenient trading panel as well as many additional functions in one program. The product works correctly with all instruments (Forex,

The EA opens orders using the Wolfe waves indicator, also uses the Martingale and smart Trailing Stop, Stop Loss and Take Profit. Trades are always protected with STOPLOSS, Smart Trailing and Breakeven. This EA is easy to use. The EA has proven results on EURUSD M5, however you can change the settings for better results on other currencies.
Settings Setting EA - Settings of the Advisor. Invest More - at the value 'true' the lot size increases as the account balance grows.( Risk Management ). I

The indicator automatically sets trendlines on the really important points directly on the chart. Timeframe, color and style of the lines can be adjusted. Notification of a breakout above or below the line via a smartphone is possible.
Input Parameters TimeFrame : Choose timeframe AppliedPrice : Choose close , open, high, low, median, typical or weighted price Formation : Choose swing, Shoulder head shoulder or long term formation Alerts : true = alert is on SendEmail : Send message to email a

CCI Pointer is an indicator which simply draws arrows on chart window when value of CCI (from parameter CCI_Period) is above CCI_Level (red downward pointing arrow) or below negative CCI_Level (green upward pointing arrow). CCI Pointer works on all timeframes and all currency pairs, commodities, indices, stocks etc. CCI Pointer has only two parameters, CCI_Period and CCI_Level . For example, if you set CCI_Period=25 and CCI_Level=200 indicator will draw arrows for values below -200 (oversold) an

RSI Pointer is an indicator which simply draws arrows on a chart window when the value of RSI (from parameter RSI_Period) is below RSI_Level (green upward pointing arrow) or above 100-RSI_Level (red downward pointing arrow). RSI Pointer works on all timeframes and all currency pairs, commodities, indices, stocks etc. RSI Pointer has only two parameters, RSI_Period and RSI_Level . For example, if you set RSI_Period=7 and RSI_Level=20, the indicator will draw arrows for values below 20 (oversold)

Semiautomatic EA for trading based on the averaging and locking strategy. The trader sends signals for opening grids by using the buttons on the chart. The EA opens a market order, places a grid of limit orders in the same direction with lot multiplication according to specified parameters and a locking stop order in the opposite direction with the volume equal to the sum of all the previous ones. Once the price passes the specified breakeven level, the EA places a stop loss at the open price+sp

Grid Trading is a semi automated one click EA for manual grid trading.
Normal Trading From chart you just click Sell or Buy trades and it will handle all the trades with adding Stop Loss, Take profit, while its Trailing and Breakeven functions will care if trade cannot reach its take profit level.
Hedging If you select hedge trading it will start grid trading with opening opposite entry and this grid will continue until it will close all trades in profit.
Martin If you select martin tradin

BearTradeEA - is a safe MetaТrader 4 trading robot working autonomously on a VPS server or on your computer. The good results are achieved on EURUSD and other pairs, but it can work with all pair.
Trading strategy The Expert Advisor is designed for normal operation and for the reverse mode operation, does not use martingale, and can increase the deposit. The EA trades only the market orders. Trading according to the strategy is performed on H1 and H4 timeframes (as H1 and H4 timeframes are les
Volume Volatility Dashboard is a great tool for quickest possible analysis of multiple currency pairs in terms of extremely high and extremely low accumulation to distribution ratio in comparison to values from past. The number of displayed symbols is 30 and the name of each symbol can be edited in the parameters, so we are able to analyze not only predetermined currency pairs, but also other ones, commodities, equities, indices, currency pairs with prefixes and suffixes etc... This analyzer is

Ultimate Pinbar Scanner (Multi Pair And Multi Time Frame) : ---LIMITED TIME OFFER: NEXT 25 CLIENTS ONLY ---46% OFF REGULAR PRICE AND 2 FREE BONUSES ---SEE BELOW FOR FULL DETAILS A strong pinbar is clear evidence that the institutions are rejecting a particular price level.
And the more well defined the pinbar, the higher the probability that the institutions will
soon be taking prices in the opposite direction.
Pinbar patterns are widely used by institutional traders around the world.
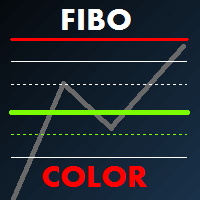
Fibo Color Levels is an amazing tool for Fibonacci lovers. You can customize your preferred values, styles and formats of each level and set the color levels according to their importance. Fibo Color Levels Not add object fibonacci retracement automatically . The purpose of this indicator is not it. So you need to manually add the Fibonacci Retracement in your chart, as usually already do. Use the standard tool Fibonacci Retracement in your MT4, draw the Fibo according to the swing-high and/or s

The Price Action Dashboard is an innovative tool to help the trader to control a large number of financial instruments. This tool is designed to automatically suggest signals and price conditions. The Dashboard analyzes all major Time Frame suggesting price action conditions with graphic elements. The Dashboard can suggest you the strength of the trend identifying directional movement, it is an indispensable tool for those who want to open position themselves using market trends identifiers. The
RSI Alert Pro is a highly configurable RSI indicator with rich alerts and RSI level monitoring features.
Input Parameters Parameter Permitted Values Description
Use Alerts Pro Voice Synthesis module true/false Provides voice synthesized alerts for Traders with the Alerts Pro module (additional purchase required) Enable Push Notifications true/false If set to true the system will send push notifications to any MT4 mobile platform the trader is licensed for RSI Period Integer values from 1

OBV Divergence Formation (hereinafter "Diver") is based on On Balance Volume technical indicator (OBV) that is a momentum indicator that relates volume to price change. Classic (regular) and Reversal (hidden) Divergences - at your choice. Adjustable sizes and all parameters Flexible settings including VOID levels (additional alert function, arrows on price-chart show in which direction to trade) No re-paint / No re-draw (set CalcOnOpenBar =false) "SetIndexBuffer" available for all variable
Limit and reverse MT4 is a flat Expert Advisor with no indicators.
Trading Strategy Limit and reverse MT4 trades any currency pair and any timeframe. The strategy is based on accompanying an open position with a trailing profit and reversing it when the trailing profit is activated. The first position is opened with the triggering of the SellLimit or BuyLimit order above and below the current price. Additional control is placing a SellStop order much below the current price - new orders cannot

This indicator shows the time before the new bar or candle opens. Examples of how much is left before a new bar opens: An example for the M1 timeframe: 05 = 05 seconds. An example for the H1 timeframe: 56:05 = 56 minutes and 05 seconds. An example for the D1 timeframe: 12:56:05 = 12 hours, 56 minutes and 05 seconds. An example for the W1 timeframe: W1(06): 12:56:05 = 6 days, 12 hours, 56 minutes and 05 seconds. МetaТrader 5 version: https://www.mql5.com/en/market/product/13602 Settings color_ti
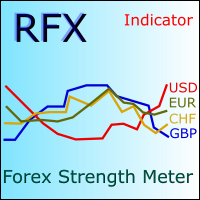
RFX Forex Strength Meter is a powerful tool to trade 8 major currencies in the Forex market, U.S. Dollar ( USD ) European Euro ( EUR ) British Pound ( GBP ) Swiss Franc ( CHF ) Japanese Yen ( JPY ) Australian Dollar ( AUD ) Canadian Dollar ( CAD ) New Zealand Dollar ( NZD )
The indicator calculates the strength of each major currency using a unique and accurate formula starting at the beginning of each trading day of your broker. Any trading strategy in the Forex market can be greatly improved

VR Alert 该实用程序以指标的形式制作,旨在告知交易者价格达到给定水平。信号电平不仅可以水平设置,还可以以一定角度设置。因此,交易者有机会接收来自倾斜趋势水平的通知。由于VR Alert实用程序,您将不再需要坐在显示器附近很长时间。你可以放心地做你的家务,履行工作职责,花时间与你的家人。你的任务是简单地设置水平,并选择通知的四种方法之一。该实用程序能够向智能手机发送警报,电子邮件,显示标准警报窗口和声音,并将图表绘制为红色。该实用程序的所有管理都是用图表上的鼠标完成的。 建议: 配置终端发送推送消息到您的智能手机,说明在博客中。 配置终端向邮件发送邮件,博客中的说明。 只需用鼠标将指标从导航器拖动到图表。您将看到指标的名称和用于设置级别的面板,启用警报。 选择要显示的行所需的向上或向下级别,然后选择通知方法。 当价格达到指定水平时,VR Alert将以选定的方式通知您。 您可以根据自己的喜好自定义该实用程序的配色方案。 该指标不能在策略测试器中工作,只需租用程序一小段时间来检查它的运行。 如果您不仅需要从当前价格接收警报,还需要从其他指标接收警报,请使用MetaTrader5和m

Stufic is a result of the long way of development. It was created for use in the management of capital of trading groups. The main idea is to preserve capital through unexpected fluctuations of the markets. It is one of the system that can perform on 90% of currency pairs. It's a participant on World Cup Trading Championship 2016 with real 10K USD. Stufic was also between top five traders in real money contest organized by Fidelis Capital (November 2015, Gain +48%).
Why should you have to choo

The MACD Turbo indicator provides a highly configurable enhanced MACD indicator with histogram, push notifications, pop-up and email alerts. Traders can customize the MACD calculation parameters to meet their needs and also control the alert system based on their requirements. The alert module produces alerts when the MACD line crosses the 'Watermark' or zero level and also when the MACD and Signal lines crossover. Traders can choose the nature of the crossover modes which can be 'Printed' - whe

Introduction The Weekly pivots indicator calculates and displays weekly pivot levels on MT4 charts. The indicator allows the trader to adjust the calculation window so that the pivots can be synchronised with the market the trader is active within. So traders looking to trade the London open or the US open can adjust the calculation basis of the pivot system so that the pivots on their chart are the same as the majority of the market participants. All the FX AlgoTrader pivot systems use HOURLY d

Overview This is the WOODIE version in the Verdure Pivot Trail Series. Verdure Woodie Pivot Trail plots WOODIE pivot levels for every bar on the chart. Pivot levels are great at determining turning points in the market and when period pivot levels are compared to daily pivot level, these turns can be accurately predicted and timed.
Features Dynamically calculates and draws Pivot levels for every bar on the chart (Central Pivot Point, R1, R2, R3, S1, S2 and S3) Pivot level can be used to trail

Introduction The Monthly pivots indicator calculates and displays monthly pivot levels on MT4 charts. The indicator allows the trader to adjust the calculation window so that the pivots can be synchronised with the market the trader is active within. So traders looking to trade the London open or the US open can adjust the calculation basis of the pivot system so that the pivots on their chart are the same as the majority of the market participants. All the FX AlgoTrader pivot systems use HOURLY

The RBCI hist indicator is an adaptive trend histogram, that eliminates noise using a Low-pass filter, which passes the lower frequencies and cuts off hight frequencies of the price fluctuations. The signal (depending on the strategy chosen by trader) is the intersection of the zero line by the indicator, as well as the change in the histogram color. The change in the histogram color serves as an early signal for opening positions towards the trend. The position of the indicator relative to the

Better Support & Resistance shows the best support and resistance lines and zones. It is based on Fractals with the factor of your choice. All fractals are assembled, weighted, extended and merged into a clear set of support and resistance lines. The immediate nearby lines are shown as zones when price is in that zone. Better Support & Resistance gives you the best overview of the important price levels.
Settings Better Support & Resistance's default settings are good enough most of the time.

Hello, I am Ayman from Egypt, I want to present an interesting indicator to you. It depends on Ichimoku Kinko Hyo, but there is a secret that i use in it. By using my indicator, you will be able to know a lot of important information in the market such as: Live Signal : https://www.mql5.com/en/signals/821024
Features You can avoid entry during market turbulence You can enter orders on the general trend only You will know if the trend is strong or weak If you entered an any orders by the help o

Full Market Dashboard (Multi Pair And Multi Time Frame) : ---LIMITED TIME OFFER: NEXT 25 CLIENTS ONLY ---46% OFF REGULAR PRICE AND 2 FREE BONUSES ---SEE BELOW FOR FULL DETAILS One of the biggest advantages the institutions have, is their access to enormous amounts of data.
And this access to so much data, is one of the reasons they find so many potential trades.
As a retail trader, you will never have access to the same type (or amount) of data as a large institution.
But we created this
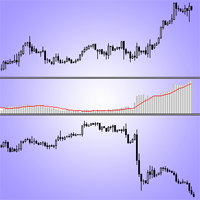
This is an indicator of trading instruments' correlation. It shows the difference of price values of two symbols. The increase in price divergence and the reduction of price divergence can be seen as signals to transactions. The indicator can be used for hedge strategies. The indicator sends Alerts and Push-notifications to the mobile app about the crossing of the moving averages of Envelopes. The indicator has a simple setup. You need to put him in the window of the traded instrument and choose
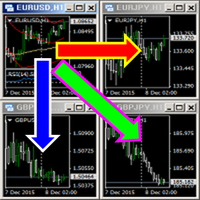
This indicator changes the timeframe and chart profile for multiple charts. If you dispatched many charts (10~20 or more) in single MetaTrader terminal, it is very boring and difficult work to manage the timeframe and chart profile individually. If the indicators you use in a chart are numerous and the setting values are different from the default one, you might give up adding all the indicators to all charts. The changing of timeframes on multiple charts has the same problem, too. Whenever you
Concept Mean reversion is a concept in trading based on prices eventually returning to their mean or average level after a period of divergence or departure from the historical mean. Traders deploying mean reversion techniques typically wait for assets to diverge significantly from their mean values and then place trades on the assumption the price will return to the mean at some point in the future- this is also known as re-coupling or convergence. There are several mean reversion based trading

The indicator displays trend strength, including showing the transition from buy to sell and visa versa. It is ideal for trend following strategies and also highlights possible reversals/flattening trend with a yellow X on the indicator window. By default, the indicator does not repaint/flicker, however, there is an option to calculate on the live candle but even then the indicator will not repaint unduly. The indicator can also be used for exit.
Usage Enter long/buy trade when the indicator t
The FX AlgoTrader Advanced Moving Average Crossover Alert System is a highly configurable MT4 indicator which incorporates a fully automated alert system for monitoring two trader defined moving averages. Automatic display of fast and slow moving averages Integration with Alerts Pro package - Voice synthesized alerts system - allows complete freedom from the screen (requires Alerts Pro package) Simple, Exponential, Smoothed and Weighted Moving Average options. Configurable calculation price i.e

The Daily pivots indicator calculates and displays daily pivot levels on MT4 charts. The indicator allows the trader to adjust the calculation window so that the pivots can be synchronised with the market the trader is active within. So traders looking to trade the London open or the US open can adjust the calculation basis of the pivot system so that the pivots on their chart are the same as the majority of the market participants. All the FX AlgoTrader pivot systems use HOURLY data for their p

The strategy of this Expert Advisor is based on the assumption that the price sooner or later will come out of range. You will make a profit regardless of the price direction. It is recommended to activate the EA in turbulent days or before the release of important news. Features
You will need a broker with low spreads and fast execution of orders. Testing was conducted on the pair EURUSD. Recommended maximum order size is 0.01 lots for each $150. The EA can be placed on any chart and use it

Divergence Formation BBands (hereinafter "Diver") is based on Bollinger Bands Technical Indicator (BB). Classic (regular) and Reversal (hidden) Divergences - at your choice. Adjustable sizes and all parameters Flexible settings including VOID levels (alert function in place, arrows to show in which direction to trade) No re-paint / No re-draw (must set CalcOnOpenBar =false) "SetIndexBuffer" available for all variables (can be used in EA) Auto-detect 4- and 5-digit price function Lite (does not
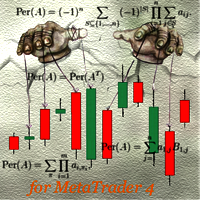
This is a medium-term conservative system. It tracks quote movements and defines entry points. The Expert Advisor is completely automated and features the unique algorithm. It has been designed for trading CHFJPY, EURCHF, and USDJPY.
Features It does not use Martingale; No grid; No scalping; No excessive parameters; Fixed lot; No complicated settings. Trades are usually opened infrequently. Orders may remain open for a few days for obtaining greater profit. Amount of trades per month – from 5

Divergence Formation Hurst (hereinafter "Diver") is based on Hurst exponent used as a measurement of long term memory of time series. Classic (regular) and Reversal (hidden) Divergences - at your choice. Adjustable sizes and all parameters Flexible settings including VOID levels (alert function in place, arrows to show in which direction to trade) No re-paint / No re-draw (must set CalcOnOpenBar =false) "SetIndexBuffer" available for all variables (can be used in EA) Auto-detect 4- and 5-digit p

System Introduction Fx TrendRider is an amazing EA that takes pips as easy as the market itself because it rides with the trends and masters the trend direction and market conditions as it is at any point in time.
Money Management The default lot size setting is 0.10, you can start with that first and see how it goes, then you can increase your lot according to your account balance but do not trade with the money you cannot afford to lose even though with time, you will discover that you can u

PipsMinerFast is mainly a trend follower with a bit of price action. At first sight, you will think: "Oh well, one more indi showing everything I've missed today but not giving a clue about what will happen..." Okay, you can believe this when just looking at it but start a test it and you will see that PipsMinerFast: Shows you the trend immediately Is not repainting Has minimum lagging Counts pips immediately Adapts to your spread level Works from M1 to H1 Is heading in the right direction 90% o

The Correct Entry indicator displays specific points of potential market entries on the chart. It is based on the hypothesis of the non-linearity of price movements, according to which the price moves in waves. The indicator displays the specified points based on the price movement of certain models, and technical data.
Indicator Input Parameters: Сorrectness – The parameter characterizes the degree of accuracy of the entry signals. Can vary from 0 to 100. The default is 100. Accuracy of si

Interceptor - professional volume and price extremes indicator. Interceptor is a powerful indicator, which thanks to a combination of four different types of normalized indicators in one algorithm can correctly identify extremes of the price leading to retracements and reversals in the trend. Algorithm is based mainly on combination of Accumulation/Distribution , On Balance Volume , Money Flow Index and Relative Strength Index . The first parameter of Interceptor is Interceptor_Depth which defin
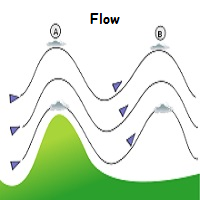
WindFlow is a powerful solution for manual traders that will drive your trading decisions in no time. I designed this indicator taking into account three main concepts: momentum, break of recent trend and volatility. Just like the wind's flow any trend can have small correction or major change in its direction based on the main trend's strength, so at glance you can have a very good idea on the next "wind's direction" when you look at your charts.
How to properly use WindFlow? WindFlow is the
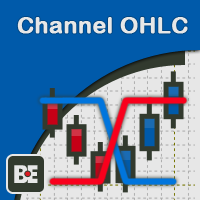
The creation of this indicator was inspired by the phrase of the famous trader Michael Covel "Price is the best indicator in the world". Not everyone is able to see the market through the eyes of a professional. Probably an indicator that does not distort the price and visualizes what is happening on the market can help you. Indicator "BE Channel OHLC" has been created for this purpose. The indicator name has not been chosen by chance. The indicator draws a channel using OHLC prices (OPEN, HIGH,
The aim of this indicator is to provide statistical information about the user trading activity as recorded in the MetaTrader Account History . It can be loaded on any chart and timeframe and the information is shown on the main window and refreshed every time a new bar is formed. The orders can be selected according to various meaningful criteria: their type (long and/or short), those having a given magic number, those executed in a given time interval, on a particular weekday, on a given symbo

This indicator is a logical extension of the product at https://www.mql5.com/en/market/product/12526 . The only difference is that price movement is displayed using a histogram with levels, allowing to assess the direction and strength of the movement. How to interpret the signal: 0 - the middle of the channel; above 0.5 - the breakdown of the channel up; below -0.5 - the breakdown of the channel down. Both indicators are displayed in the attached screenshots. Install the indicator and you will

产品描述: 这是一个实现在图表上展示历史交易的指标,通过这个指标可以很直观的显示您最近所有的交易,回顾和总结您交易出现的问题,在后续的交易中可以优化和改进交易思路,避免出现类似的错误,对不断提高您的交易水平有很大的帮助,通过指标可以让您的交易变得更加清晰。这个指标可以非常灵活的进行参数定制,让您可根据自己的喜好,定制开仓和平仓点的颜色,以及盈利和亏损线的颜色,圆点的大小和线的粗细都可以根据您的喜好随意定制,在添加指标的时候可以更改,也可以编辑中更改。默认开仓的颜色是绿色,平仓的颜色是红色,盈利的订单显示蓝色的线,亏损的订单显示红色的线。默认显示的是本月的交易历史,如果想显示更多,可以自定义显示更多历史交易,此指标适合所有时间周期图表,如果您不希望一直显示交易历史,可以在图表上的指标列表里删除指标。 输入参数: CircleSize 买卖点圆圈大小,默认是7 LineWidth 交易线宽度,默认是1 BuyColor 开多单圆点的颜色,默认是绿色 SellColor 开空单圆点的颜色,默认是绿色 CloseColor 平仓圆点的颜色,默认是红色 ProfitColor 盈利订单的颜色,

3-Hull-Spread - 通过构建可视化 iChannel(参见下面的公式)来显示 3(三)种不同工具的专业跨工具指标,该通道根据每个工具的输入按比例改变其宽度(“统计套利”基于 船体MA=HMA)。
核心原则:价格线在每次出现差异后跟随“它们”符号的价格,不断趋向于回到“合成”中心的总和。 换句话说,由 3 个“相关”工具//对组成的系统不断努力恢复其平均值(所谓的“均值回归”效应)。
适用于任何仪器/TF(必须打开所有使用的仪器的图表/TF) 同步到位。 当前栏关闭后 -- 不重新绘制/不重新绘制 “SetIndexBuffer”适用于所有变量(可在 EA 中使用) 自动检测 4 位数和 5 位数价格 以下公式用于构建 iChannel:
iChannel = (S1-M) + (S2-M) + (S3-M)(红点和绿点) 中线 М =“合成”中央 (S1 + S2 + S3)/3(黄色虚线) 在哪里 价格线符号-1:指标打开的图表) 价格线符号-2(反转=真/假 - 对于具有负相关性的工具) 价格线符号-3(反转=真/假 - 对于具有负相关性的工具) 该公式允

3-SMA-Spread - 通过构建可视化 iChannel(参见下面的公式)来显示 3(三)种不同工具的市场价差的跨工具指标,该 iChannel 根据每个工具的输入按比例更改其宽度(基于 SMA 的“统计套利”) 。
核心原则:每次出现差异后,跟随“它们的”符号价格的价格线不断趋向于回到“合成”中心的总和。 换句话说,由 3 个“相关”工具//对组成的系统不断努力恢复其平均值(所谓的“均值回归”效应)。
适用于任何仪器/TF(必须打开所有使用的仪器的图表/TF) 同步到位。 当前栏关闭后 -- 不重新绘制/不重新绘制 “SetIndexBuffer”适用于所有变量(可在 EA 中使用) 自动检测 4 位数和 5 位数价格 以下公式用于构建 iChannel:
价格线符号 1 - 指标打开的图表 价格线符号 2 - 加上负相关工具的“reversal=true”模式 价格线符号 3 - рplus "reversal=true" 负相关工具的模式 中线 М =“合成”中央 (S1 + S2 + S3)/3(黄色虚线) iChannel = (S1-M) + (S2
The indicator presents reversal points by Fibo levels based on the previous day prices. The points are used as strong support/resistance levels in intraday trading, as well as target take profit levels. The applied levels are 100%, 61.8%, 50%, 38.2%, 23.6%. The settings allow you to specify the amount of past days for display, as well as line colors and types. Good luck!
MetaTrader市场是您可以下载免费模拟自动交易,用历史数据进行测试和优化的唯一商店。
阅读应用程序的概述和其他客户的评论,直接下载程序到您的程序端并且在购买之前测试一个自动交易。只有在MetaTrader市场可以完全免费测试应用程序。
您错过了交易机会:
- 免费交易应用程序
- 8,000+信号可供复制
- 探索金融市场的经济新闻
注册
登录