YouTubeにあるマーケットチュートリアルビデオをご覧ください
ロボットや指標を購入する
仮想ホスティングで
EAを実行
EAを実行
ロボットや指標を購入前にテストする
マーケットで収入を得る
販売のためにプロダクトをプレゼンテーションする方法
MetaTrader 4のための有料のエキスパートアドバイザーとインディケータ - 236

EquityProtect provides hidden StopLoss, TakeProfit or TrailingStop based on the account equity. All orders of all symbols can be closed or just the chosen currency and/or just buys or sells or pending orders deleted. EquityProtect closes all or just defined orders when the account equity falls under or rises over a certain level. Besides EquityProtect can use the account equity as trailing stop. A comment in the chart shows the equity where the robot will react. mt5 version >> EquityProtect is v

High Low Open Close Levels The indicator HLOC is a good ally to correctly identify the appropriate trend of price. The indicator is designed to be minimally invasive and it shows a visual and sound aid in order to take decision on the market. The indicator is equipped with sound alert and window alert in order to have a reminder of the price movements. We suggest you watch the video below to evaluate its operational benefits.
Input values: Show Level (true/false) TimeFramePeriod (refer to line
Control Trading Intraday Zones shows the best candles-zones to trade intraday. Shows maximum of the day and minimum of the day zones, adaptable to each symbol, gives you a guide to know the best zones to make the best intraday trades. Indicator goes from -100 (lowest of the day) to 100 (highest of the day), when 0 is middle price of the day. For example, when price reaches high of the day the indicador will continue showing max levels even the price continue rising, because indicator limits to 1
Visualize your charts differently in MetaTrader 5. The product is good for comparing the prices, since the indicator draws High, Close, HLC, etc. It is useful when applied with other indicators (like MACD). This simple indicator colors the entire space below the chart allowing you to see the market with greater clarity. You will see the actual price, trends, and the market behavior.
Indicator parameters: Applied_Price : From this option you can select the type of price you want to draw with t
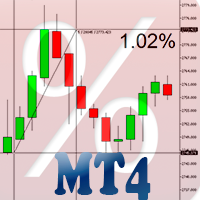
Percent Crosshair is a powerful and easy percentage measure tool. Measure the chart percentage quickly! Don't waste your time anymore! Just attach the Percent Crosshair indicator to the chart, select crosshair mode at toolbars or press Ctrl+F and start using the crosshair as you always do! The percent measure will be next to the indicative price. Customize your indicator the way you want! There are four entry parameters: Positive % color: set the desired color when % is positive. Negative % colo

This is a prototype of the famous Control and management of transactions panel. There are two main differences: Allows to work with all the variety of financial instruments opened by a user and not only with instruments it was attached to; To activate levels of order closure hidden from a broker, it uses not lines but modifiable virtual levels. The EA will independently determine a total number of involved financial instruments, display them in the upper left window and locate the pointer on the

This is a prototype of the famous Control and management of transactions panel. There are two main differences: Allows to work with all the variety of financial instruments opened by a user and not only with instruments it was attached to; To activate levels of order closure hidden from a broker, it uses not lines but modifiable virtual levels. To enjoy the full functionality of the panel you are advised to have: Desk analytical table . Their combined operation allows to keep the situation under

Breakeven Level indicator shows the breakeven level of your buy and sell orders. Useful if you have several open positions. Apart from demonstrating breakeven level, the indicator displays additional information concerning your trading instrument in the upper right corner (balance, equity, number of buy orders, sum of buy orders, number of sell positions and sum of sell orders). Breakeven level for sell orders has red color, buy - blue color.
Indicator Parameters Color of the text on the chart

The Pairs Cross indicator is a unique tool for negatively correlated trading instruments, such as EURUSD and USDCHF currency pairs. It is based on a concept called pairs trading (or spread trading). Our indicator compares the strength of two currency pairs that are inversely correlated and quickly tells you when it’s time to buy the first pair and short a second pair, and vice versa. This is a straightforward approach to trading currency pairs that works very well.
How to you use the Pairs Cr

The FastBoom EA finds the most probable points of price pullback/reverse and places an order. It places averaging orders if the price moves further against take profit.
Settings of the EA: Lots - initial lot; LotExponent - multiplier for following orders (Martingale). 1 - no multiplier. TakeProfit - take profit in points; Stochastic Settings
InpKPeriod - K Period of Stochastic InpDPeriod - D Period of Stochastic InpSlowing - Stochastic Slowing LevHigh - level for sell positions of Stochastic
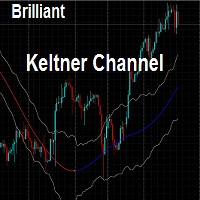
This indicator draws the Keltner Channel for any time frame Displayed on the current Time frame allowing user to choose which moving average type for the calculations. The available Moving Averages are: Simple Moving Average (MA_Mode=Mode_SMA)
Exponential Moving Average (MA_Mode=Mode_EMA) Smoothed Moving Average (MA_Mode=Mode_SmoothedAverage) Linear Weighted Moving Average (MA_Mode=Mode_LinearWeighted) Tillson's Moving Average (MA_Mode=Mode_Telsons) Moving Average line is coded into RED or BLUE

The National Prise Reversal indicator represents an oscillator of a national currency (options: USD, CAD, CHF, JPY, GBP, EUR, AUD . It is based on already known Prise Reversal oscillator. But it analyzes particularly movement of a selected national currency on pairs with other specified currencies. Basing on these data the National Prise Reversal indicator determines overbought or oversold of the selected currency. When the indicator is in the overbought zone, it indicates possible weakening of

This strategy searches for trade opportunities based on what area the close price is, in comparison with Moving Average. In order to be triggered, a pattern between candles also must occur. The EA works well on trending markets. It has been initially developed for stock markets indices (SP500, NASDAQ, etc) on Daily chart entering long positions only. However, I refined the strategy in order to enter short positions as well. It does not use stop loss or take profit, so the losing trades outweigh
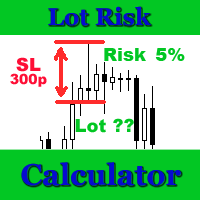
Lot Risk Calculator is a panel for order size calculation according to stop loss and allowed risk per trade. The calculation is performed for the symbol the indicator is launched at. You can set risk and stop loss manually in the panel. The stop loss is set considering 4 or 5 digits, for example, 20 - 4-digit, 200 - 5-digit. After editing each parameter, press Enter to confirm. To calculate a lot, click Calculate. The result appears below the button. Note! Set the panel for all necessary symbols

This indicator is designed for analyzing your positions on 30 financial instruments with the font size of the output information between 8 and 10. If the font size is 11 you will see only 26 instruments and so on: 12-25, 13-24, 14-20. The font size can range from 8 to 14. The main window contains buttons with names of financial instruments and lines where brief information about all open positions is displayed. Two columns show the total volumes in lots of positions in each trading direction: BU
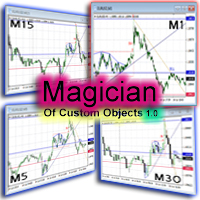
The ‘Magician of custom objects’ is a utility script tools for MetaTrader 4. After attaching the script to a chart, the custom objects in this chart are cloned to any other opened charts of the same symbol. Now, 11 custom object types are supported, including: Vertical line; Horizontal line; Trend line; Angle line; Gann line; Fibonacci line; Rectangle; Triangle; Arrow; Ellipse; Text. If you need other object types or have any question, write in the Comments section.
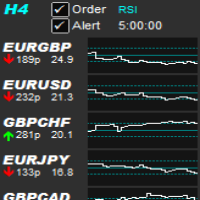
Allows symbols/currency pairs to be ordered based on a configured indicator, with the best performing symbols shown at the top. This helps you to select the symbol with better prospects from a given list of symbols. Can optionally alert when a symbol moves into the top two (configurable). Also shown is the number of pips that the symbol has moved in its current direction, allowing you to tell if you've 'missed the boat'. Further, a graph is shown, per symbol, of the indicator value over time all

This indicator allows you to see the strength of the trend on all timeframes. It can be used for all currency pairs. The indicator can be displayed in the form of a column (from left to right): status buy / sell / strong buy / strong sell, strength of the trend in percentage, pips last candle, body candle now, remaining time, and the timeframe of M1 to MN. Information contained below (from left to right): total trend percent, sell percent, buy percent.

This indicator displays a complete tick chart with two optional moving averages, and makes paying attention to sub-m1 price data really easy. [ Installation Guide | Update Guide | Troubleshooting | FAQ | All Products ] Identify price spikes easily The blue line is the ask price The red line is the bid price The indicator doesn't lose tick data when reloaded It implements two optional moving averages The indicator is non-repainting
Input Parameters
Display Moving Averages: Display or hide the

The Correlation Matrix indicator shows the actual correlation between the selected instruments. The default setting is set to 28 currency pairs, gold, and silver, but the indicator can compare any other symbols.
Interpretation of the indicator Positive correlation (correlation is above 80 %). Negative correlation (correlation is below -80 %). Weak or no correlation (correlation is between -80 and 80 %).
Main features The indicator shows the actual correlation between the selected instrum

This indicator is meant for Harmonic Traders, it helps them in identifying the formed patterns by analyzing the market past data, looking for Harmonic Patterns. The Patterns that this indicator can detect are: AB=CD Butterfly Gartely Crab Bat The indicator shows the following: The completed pattern, with the critical zone highlighted in Gray box The suggested 3 take profit levels (in green) The Suggested Stop Loss level (in Red) The formed pattern ratios can be checked by hovering the mouse on t

The indicator is based on the elements of Bill Williams' trading system. Sell signals are formed when MACD and OsMA values are falling simultaneously (Bill Williams calls these indicators АО and АС in his book), while buy signals appear when both indicators are rising. Thick and thin colored histograms match MACD and OsMA values. If the histogram is greater than 0, the indicator value is rising. Otherwise, it is falling. Positions should be opened when the price exceeds the bar's high or low, at

This is a fully automated multi-currency Expert Advisor. Does not use Martingale and grid trading. Uses stop loss to protect funds. It trades pending orders at acceptable time. Unengaged pending orders are deleted after the EA stops trading. Сделки совершаются по рынку (Market Execution) — Market Execution is applied — take profit and stop loss are placed after the order is executed and modified by the EA's settings. The EA is meant for trading EURUSD, GBPUSD, AUDUSD, USDJPY, USDCHF, USDCAD, NZD

The market opening time greatly influences the currency pair, which leads to a rapid movement of the pair. The EA places 2 pending buy and sell orders at a specified time with certain parameters. When the KolBarExtr parameter is set, the orders are placed at the High and Low for the specified amount of bars. Otherwise the orders are placed at the distance specified in the MinDistanceSet parameter. It is possible to configure trailing.
Parameters You can adjust following parameters: Type of exp

This indicator builds so called "random walk" bands: on every bar it finds maximal or average distance between current price and multiple expanding parabolic curves starting at predefined number of bars in the past. If you like Bollinger bands or Envelopes you may find this indicator useful as well. As you may know, price movements are very similar to random walk time series (specifically, Gaussian random walk), yet they do effectively break the hypothesis of randomness. One of the features of t

The most important thing in my system of forces, is the variation and changing of these forces. It is the key to the whole system, and from this point, my second indicator called FORCES-VARIATION appeares important. The indicator is represented in a separate window in the form of the green histogram and the red curve . The parameter NPIuPeriod represents the number of bars on which we calculate the variation of buyers forces. The parameter NPIdPeriod represents the number of bars on which we cal
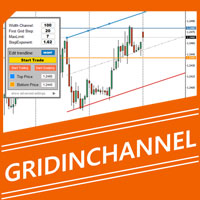
GridInChannel is a professional system of trading inside a channel using active visual control panel. The EA places a grid according to the specified parameters. It trades inside the channel which is manually plotted using a trend line. The main concept : while th price is inside the channel and the " start/stop trade " button is pressed, the EA opens an order grid in the direction of the specified channel.
Expert Advisor Features : Opening orders within the specified range . The range is set

The EA catches the price when it moves against the trend in an effort to open an order in an opposite direction (direction of the main trend). Screenshots illustrate examples of entries and the strategy gist. The EA uses stop losses depending on values of ATR.
Settings: Lot_ - if Risk_ = 0, the EA will trade this lot; Risk_ - risk per one trade. Stop loss is taken into account; koeff_ATR - coefficient multiplied by the ATR value to calculate stop loss (the bigger the value, the bigger stop los

PROscalper is a perfect tool for traders who use the scalping strategy! It gives you the visual view of the main Stoploss, Takeprofits and current/last pips on the chart and also in the integrated menu. So with this overview you have the high quality indicator for scalping! You can use PROscalper on any timeframes and on any pairs, but lower timeframes are recommended. To improve results, you can combine PROscalper with a Trendindicator (TrendfollowerSR) to get a dual confirmation for the entrie

This technical indicator is a Momentum indicators built using a fast adaptive digital filter - FATL. In a simplified sense, an adaptive digital filter is a moving average with effective smoothing. Using a digital filter allows you to smooth out sharp fluctuations with minimal signal delay. Using the indicator: It should be taken into account that the values of the indicator on the zero bar (which has not finished forming yet) may change, so decisions should be made after the end of the bar for

インジケーターには 2 つの部分が含まれています。
パート I: カラーキャンドルが主要なトレンドを示す
カラーローソク足とは、ローソク足の色で相場の状態を識別することです。
スクリーンショットに示されているように、色がアクアの場合、市場はロング注文を発注するか、ショート注文を終了する必要がある状態です。色がトマトの場合は、ショート注文を行うか、ロング注文を終了する時期です。
色が変化している場合は、その完了を (現在のバーが閉じるまで) 待つことをお勧めします。
パート II: バンドを描く
内側のバンドは安全領域として定義され、外側のバンドはクローズオーダー用です。
以下のような取引戦略:
色がアクアで、価格が内側のバンド内にある場合は、ロング注文を出します。価格が外側のバンドを超えたら、注文を閉じる時期です。 色がトマトで、価格が内側のバンドにある場合は、ショート注文を出します。価格が外側のバンドを越えたら、注文を閉じる時期です。 注:価格が内側のバンドの場合のみエントリーマーケットです。これは非常に重要です。
入力パラメータ ShowC

The Trend Trade indicator displays assumed turning points of the price on the chart in the direction of the trend after correction. It is based on data of the Prise Reversal oscillator with the period 6 and indicators which characterize strength and availability of the trend. When the value of Prise Reversal is in overbought or oversold area (area size is set by a user), and the current trend is confirmed, the Trend Trade indicator draws an arrow pointed to the further assumed price movement.
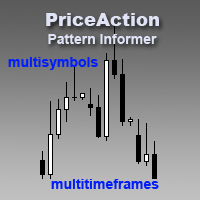
Pattern Informer is a convenient indicator for recognizing Price Action patterns on selected instruments. It presents a convenient overview form of all instruments on three timeframes (Н1, Н4, D1) in a single chart. It's an indispensable tool for manual trading based on the Price Action method. Pattern Informer recognizes the following patterns: PinBar Inside Bar Outside Bar DBLHC DBHLC TBL TBH
Indicator Parameters symbols_list - the list of currency pairs separated by commas for which pattern

The Volume Spike indicator is a useful tool to identify the directional market's intention.
How Does It Work: The Volume Spike indicator identifies the volume peaks and creates a sensitive rectangle equipped with Alert and Warning Pop Up that it suggests the market's direction. This tool has the ability to select the time frame on which to do the analysis of volume and it gives a great visual signal colored into rectangle. The indicator can identify valid market signals but it can also suggest

The indicator compares quotes of the current symbol and a synthetic quote calculated from two specified referential symbols. The indicator is useful for checking Forex symbol behavior via corresponding stock indices and detecting their convergence/divergence which can forecast future price movements. The main idea is that all stock indices are quoted in particular currencies and therefore demonstrate correlation with Forex pairs where these currencies are used. When market makers decide to "buy"

This is a professional multi currency tool. Its main purpose is semi-automatic Forex trading following Elder's Triple Screen strategy. Its wide functionality and ability to quickly change some essential parameters makes it an ideal market interpretation tool, which is indispensable in the common trade analysis. Its main advantage is almost unlimited number of simultaneously analyzed instruments. If the potential technical limits of your monitor resolution allow, multiple indicators can be used.

The presented indicator draws the pivot points for different timeframes – 4 hours, day, week and month. Before you leave, download the demo version of this indicator, evaluate its performance. After all, this does not oblige you to anything. And then you will see that it has the best price to quality ratio, buy it now and receive updates for free. In the new version, an information panel with control buttons is displayed on the screen. The "Symbol properties" information panel shows: Symbol - na

Orders Info インジケーターは、1つのチャートウィンドウに要約、一般情報を表示します。複数の通貨ペアでの同時取引に便利です。 インジケーターは、マーケットポジションと保留中の注文の総数を示します。 オープンポジションを個別に示します。 通貨ペアの場合、 この通貨ペアでの未決済の購入数と預金通貨でのそれらの総利益については、 オープンセールスの数とその総利益について、 オープンバイおよびセルポジションの総利益について。 保留中の注文の場合、次のことを示します。 通貨ペアの場合、保留中の注文の名前とその番号。 インジケーターは、1つのチャートウィンドウに要約、一般情報を表示します。複数の通貨ペアでの同時取引に便利です。 インジケーターは、マーケットポジションと保留中の注文の総数を示します。 オープンポジションを個別に示します。 通貨ペアの場合、 この通貨ペアでの未決済の購入数と預金通貨でのそれらの総利益については、 オープンセールスの数とその総利益について、 オープンバイおよびセルポジションの総利益について。 保留中の注文の場合、次のことを示します。 通貨ペアの場合、保留

This is a portfolio night scalper working on EURUSD, GBPUSD, USDCAD, USDCHF, USDJPY, USDMXN and USDSGD. Timeframe - M15.
Parameters Orders_Comment - comment to orders opened by the EA. Lot_Size - fixed lot size if Auto_MM = 0. Auto_MM - percent of equity to be used in trading. If Auto_MM = 0, it will use a fixed lot. Magic_Number - unique number of orders (set different values for each trading symbol). Start_Time - the EA's operation start hour (default is 00.00; we do not recommend changing
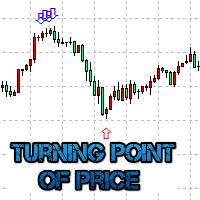
The Turning point of price indicator displays assumed turning points of the price on the chart. It is based on data of the Prise Reversal oscillator and standard ADX. When the value of Prise Reversal is in overbought or oversold area (area size is set by a user), and the value of the ADX main line exceeds the preset value, the Turning point of price indicator draws an arrow pointed to the further assumed price movement. This idea is described in the article Indicator of Price Reversal .
Indica

A portfolio night scalper for instruments: EURAUD, GBPAUD, EURNZD, GBPNZD. Timeframe - M15. Parameters Orders_Comment - comment to orders opened by the EA. Lot_Size - fixed lot size if Auto_MM = 0. Auto_MM - percent of equity to be used in trading. If Auto_MM = 0, it will use a fixed lot. Magic_Number - unique number of orders (set different values for each trading symbol). Start_Time - the EA's operation start hour (default is 00.00; we do not recommend changing this value). End_Time - the EA's

This indicator shows data from 9 currency pairs by your choice from all 9 timeframes. If a digital value of the RSI is less or equal to DnLevel = 30 (or whatever number you decided to put), then a Green square will appear. This is (potentially) an Oversold condition and maybe a good time to go Long . If a digital value of the RSI is greater or equal to UpLevel = 70 (or whatever number you decided to put), then a Red square will appear. This is (potentially) an Overbought condition and maybe a go
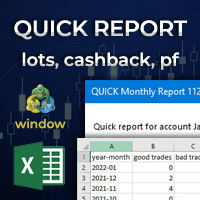
Quick Monthly Report – One Click Report Displays the results of trading according to monthly periods in a pop-up window Advantages With just one click you can view a list of the entire history according to months Exports data to CSV files with custom separator Filter by Magic Numbers Filter by Symbols Filter by words, letter or phrase in the comment Calculates the profits gained and the percentage of a Performance fee Enables to calculate the traded Volume or Lots with cachback in USD Par

Written for currency pairs: GBPUSD, USDJPY, XAUUSD There is a built-in function to return the stop to its place after slipping, an example of slipping in the last screenshot., in a similar situation, the function tries to return the stop to the place indicated when placing the order. The number of transactions in the strategy tester, demo account, real account is almost the same, the result depends on: the size of the spread, slippage, Stop Level and the speed of execution of the broker. Availab
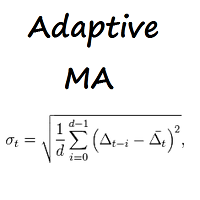
Adaptive MA 移動平均。計算方法は、バーの定義で使用されるすべての価格の平均です。
インジケーターの外部設定の説明: MA_period- インジケーターを計算するための平均期間。推奨値:5、13、21、34。 ma_method- 平均化メソッド。移動平均メソッドの任意の値にすることができます。 0-(SMA)単純移動平均。 1-(EMA)指数移動平均。 SMMA 2-(SMMA)平滑化移動平均。 LWMA 3-(LWMA)線形加重移動平均。 移動平均。計算方法は、バーの定義で使用されるすべての価格の平均です。
インジケーターの外部設定の説明: MA_period- インジケーターを計算するための平均期間。推奨値:5、13、21、34。 ma_method- 平均化メソッド。移動平均メソッドの任意の値にすることができます。 0-(SMA)単純移動平均。 1-(EMA)指数移動平均。 SMMA 2-(SMMA)平滑化移動平均。 LWMA 3-(LWMA)線形加重移動平均。

Binary Options Copier Remote is an EA that allows to copy binary options trades between MT4 accounts at different computers. This is an ideal solution for signal provider, who want to share his trade with the others globally on his own rules. Provider can give free bonus license to 10 receivers. That means those 10 receivers can copy from provider by using Binary Options Receiver Free (no cost). From 11th one, receiver have to buy Binary Options Receiver Pro (paid version) in order to copy from

Binary Options Copier Local is an EA that allows to copy binary options trades between MT4 accounts on the same computer. With this copier, you can act as either a provider (source) or a receiver (destination). All binary options trades will be copied from the provider to the receiver with no delay. Demo : Demo version for testing can be downloaded at: https://www.mql5.com/en/market/product/10047 Reference : If you need to copy between different computers over Internet, please check Binary Optio

DoubleExit is an Expert Adviser designed for scalpers that will place automatically the stop loss and take profit for every new trade that you open and is without specified exit levels. Also DoubleExit adds a partial exit level at a fixed (by the user) amount of pips. The user can define also the amount of the original trade (in a percentage) to be closed at the time of the partial exit level is reached. The exit level (represented on the chart with an orange dash-dot-dot line) can be changed ea

Cardiogram Market 設定の説明: MA_period_fast- 高速移動平均を計算するための平均期間。 MA_period_slow- 低速移動平均を計算するための平均期間。 価格 -使用する価格。価格定数のいずれかにすることができます。 0-(閉じる)終値。 1-(OPEN)始値。 2-(高)高価格。 3-(低)最低価格。 4-(中央値)平均価格、(高+低)/ 2。 5-(代表値)通常価格、(高値+安値+終値)/ 3。 6-(加重)加重終値、(高値+安値+終値+終値)/ 4。 方法 -方法を平均化。移動平均メソッドの任意の値にすることができます。 0-(SMA)単純移動平均。 1-(EMA)指数移動平均。 SMMA 2-(SMMA)平滑化移動平均。 LWMA 3-(LWMA)線形加重移動平均。
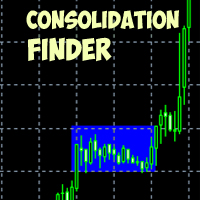
The indicator allows to find consolidations. It is meant for channel breakthrough. Easy to use, it has only three parameters: Minimum number of bars to analyze Consolidation tunnel Indicator color It works on all timeframes . Approximate settings are adjusted for H1 by default. Works on all currency pairs. This indicator does not repaint and is not recalculated. All screenshots are real!
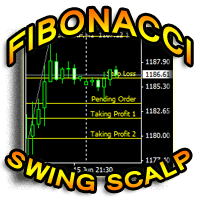
Fibonacci Swing Scalp (Fibonacci-SS) This indicator automatically places Fibonacci retracement lines from the last highest and lowest visible bars on the chart with an auto Pending Order (Buy/Sell), Stop Loss, Taking Profit 1, Taking Profit 2 and the best risk and reward ratio. This is a very simple and powerful indicator. This indicator's ratios are math proportions established in many destinations and structures in nature, along with many human produced creations. Finding out this particular a
These indicators are suitable for scalper tradition. At least 5-10 pips of income should be targeted. The stop should be at least 11 pips. It is suitable to be used in brokers with not much spread. This indicator is used to determine the trend percentage. Trend direction is made in color. It has the indicator warning system: beep, e-mail and has three types of alerts, including messages to mobile phone. The position can be in 4 different corners of the screen. When trend value reaches the value

Advanced Bollinger Bands (BB) indicator. The standard Bands.mq4 indicator was complemented with a range of upper/lower band and signal of possible reverses.
Parameters: BandsPeriod - indicator period. BandsRange - period of determining a range. BandsDeviations - number of standard deviations. Averaging Fast Period - fast period of averaging. Averaging Slow Period - slow period of averaging.
Buffer indexes: 0 - Middle line, 1 - Upper line, 2 - Lower line, 3 - Upper range, 4 - Lower range, 5
This indicator creates more stable Aqua histogram, which crosses the zero line up and down indicating UP and DOWN trend for long and short positions. The indicator generates a pulse red signal, which crosses the zero line up and down more frequently than the histogram. You may use only the histogram for entering the market in the point where the histogram crosses the zero line. You may use only the red line for entering the market in the point where the red line crosses the zero line. You may us

This indicator signals about Stochastic crossing in the trend direction which is determined by the position of the price relative to the Ichimoku cloud.
Features: Flexible settings: filtering signals by bullish/bearish bars ( parameter "BUY - the bullish bar only; SELL - the bear bar only" ); setting levels of Stochastic crossing ( parameters "BUY-signal if Stochastic below this level" and "BUY-signal if Stochastic below this level" ) ability to use the Ichimoku cloud of higher timeframes ( pa
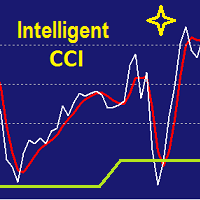
It is CCI indicator with very smooth and noiseless movement that calculates four levels of buy, sell, overbought and oversold dynamically. Professional traders know well that level of 100, 200 or -100 and -200 are not always right and need fine adjustments. This indicator calculates those levels dynamically by using mathematics and statistic methods in addition to shows divergence between indicator and price. Like original CCI, for best result you have better to set proper value for CCI period b

Binary Options Trading Pad is a very useful tool for trading binary options on the MT4 platform. No need to setup plugins outside MT4 anymore. This is a simple and convenient panel right on MT4 chart. Demo: For testing purpose, please download the free demo version here: https://www.mql5.com/en/market/product/9981 Features
One-click trading buttons on the panel. Trade multi-binary option symbols in one panel. Auto recognize all binary options symbols. Show order flow with expiration progress. M

This is a simple technical indicator that plots a line in a zigzag fashion using the Bill Williams Fractals indicator as reference. The mechanics in this indicator is as simple as this: from the latest available fractal in the chart it will trace a line to the next fractal in the opposite side of the price candles and so on until the older possible fractal in the chart is covered. This technical indicator does not have any input to configure.

The indicator MilkyWay is calculating and draws a blue or red ribbon as a trend and as a filter. In case the price is moving inside the ribbon you should not enter the market. In case you see a blue trend and the current price is above the blue ribbon than this is a good time to go Long. In case you see a red trend and the current price is below the red ribbon than this is a good time to go Short. Only 1 input parameter: nBars = 500; - number of Bars where the ribbon will appears.

Introduction to Smart Renko The main characteristics of Renko Charting concern price movement. To give you some idea on its working principle, Renko chart is constructed by placing a brick over or below when the price make the movement beyond a predefined range, called brick height. Therefore, naturally one can see clear price movement with less noise than other charting type. Renko charting can provide much clearer trend direction and it helps to identify important support and resistance level
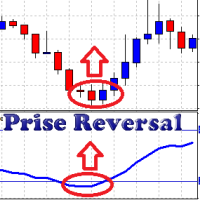
This oscillator takes into account the data from a number of standard indicators. Using this data, it forms its own (more accurate) signals. Prise Reversal helps to identify reversal points during the flat and the price extremums during the trend. At these points, you can enter a counter-trend with a short take profit. Besides, they indicate the time intervals when you cannot open a trend-following deal. After a few days of using the indicator, it will become an integral part of your trading sys

The indicator automatically sets trendlines on the really important points directly on the chart. Timeframe, color and style of the lines can be adjusted. Notification of a breakout above or below the line via a smartphone is possible.
Inputs Timeframe - Choose timeframe TrendlineColor - Choose line color TrendlineStyle - Line styles (solid, dash, dot, dash dot, dash dot dot) Alerts - True = alert SendNotifications - True = Notification via a smartphone

The idea for indicator is using multi-SuperTrend line to define market trend and Multi Moving Average line to find good entry point. The signal doesn't repaint, wait until the bar closed to make sure the signal is confirmed. Lowest RoyalBlue line is used for Buy stoploss. Highest Magenta line is used for Sell stoploss. Indicator supports alert when signal is coming (sends email, push notifications, sound alert). High Timeframe is better for using.
Indicator parameters:
CountBars = 500 — How m

All Pending Orders with StopLoss opens any combination of Buy Stop, Sell Stop, Buy Limit and Sell Limit pending orders and closes all existing pending orders. If boolSL = true then this Script will calculate one common StopLoss value as the StopLoss for a first/last orders and put this value in all pending orders.
Input Parameters Before placing all pending orders, the input window is opened allowing you to modify all input parameters: DeleteAllPendings : if true , then all pending orders (for

This is a great indicator to find an exit point. We never know when the market is going to change its trend. Many indicators give you a good entry point, but not good to use opposite signal as an exit point, because the signal always comes too late. This indicator will protect your profit as soon as possible when a signal to exit is found! Don't use this signal to enter, it may not be good for making an entry. The signal doesn't repaint, wait until a bar closes to make sure it is confirmed. Indi

Eureka Lock ユーレカロック -エキスパートアドバイザーは、指定された設定に関連する価格変動のフラットエリアを決定します。取引は、指定されたフラットの境界からの買いストップと売りストップの保留中の注文によって実行されます。損失を制限する代わりに、ボリュームを増やして損失位置をロックすることが使用されます。仮想利益レベルも使用されます。
設定の説明: TF_flet = 15-フラットが決定されるチャート期間 Bars_flet = 25-フラットを決定するためのバーの数 extern int Size_flet = 30-フラットの上下の境界線(高さ)間の距離をポイント単位で制限します otstyp = 5-保留中の注文を行うためのフラットボーダーからのオフセット ロット= 0.1-注文量 koef_lot = 2-オーダーをロックするための乗算係数 TakeProfit = 100-設定されたロット設定に対して、ポイント単位の仮想利益レベルが計算されます MagicNumber = 1975-マジックオーダー数 NumberOfTry = 5-ブローカーの再見積もり
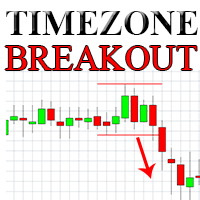
Simply breakout EA on highest and lowest point of choosen period of time. EA works on H1. This is not full EA. You need to set your strategy and know profitability. I am using it for London breakout 08:00 to 09:00 (set for UTG+1, if you want to used it too, change time to fit your timezone), picture of setting are below.
Parameters Start of timezone - When your zone start (xx:xx) - minutes must be 00 End of timezone - When your zone end (xx:xx) - minutes must be 00 Max width of zone - Max allo
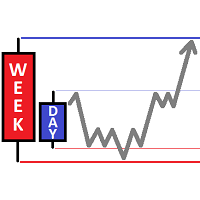
The indicator places levels on the chart: day and week high, day and week low. When the price crosses the high's level upwards or the low's level downwards, the indicator beeps and send a notification (Alert and Push-notification on mobile phone ) indicating a direction and an instrument by which crossing has occurred, and also draws arrows. Visual parameters: Day_Width - daily level width. Days_Alerts - enabling Alerts. Days_Arrows - enabling drawing arrows. Day_High - color of daily high

Bands Jazz Bands Jazz -Expert Advisorは、ボリンジャーバンド インジケーターからのシグナルの分析に基づいています。 Expert Advisorのアルゴリズムは単純で、SL、TP、およびオープンポジションのトロールを使用します。
設定の説明 TimeBeginHour- 数値。取引開始時刻の時間を設定します。 0〜24の値。 TimeBeginMinute- 数値。取引開始時間の分を設定します。 0〜60の値。 TimeEndHour- 数値。取引終了の時間を設定します。 0〜24の値。 TimeEndMinute- 数値。取引終了時間の分を設定します。 0〜60の値。 期間 -ボリンジャーバンド指標を計算するための平均期間。 偏差 -ボリンジャーバンドインジケーターのメインラインからの標準偏差の数。 band_shift- ボリンジャーバンドインジケーターの価格チャートに対するインジケーターのシフト。 apply_price- ボリンジャーバンドインジケーターの適用価格。 shift- ボリンジャーバンドインジケーターのインジケーター

The indicator has been developed as a trading system component. It has proven to be an efficient technical tool when following a trend. The indicator shows the most suitable market entry points. It can be especially useful to those who add to positions after corrections in the trend direction. When a signal appears, the indicator generates an alert.
The settings contain the depth of the indicator display history and ability to disable alerts. The signal is generated upon closing of the current
MetaTraderマーケットは自動売買ロボットとテクニカル指標を販売するための最もいい場所です。
魅力的なデザインと説明を備えたMetaTraderプラットフォーム用アプリを開発するだけでいいのです。マーケットでプロダクトをパブリッシュして何百万ものMetaTraderユーザーに提供する方法をご覧ください。
取引の機会を逃しています。
- 無料取引アプリ
- 8千を超えるシグナルをコピー
- 金融ニュースで金融マーケットを探索
新規登録
ログイン