适用于MetaTrader 4的EA交易和指标 - 258
Signal Power System is an indicator that generates trade arrows. It generates trade arrows with its own algorithm. These arrows give buying and selling signals. The indicator certainly does not repaint. Can be used in all pairs. Sends a signal to the user with the alert feature.
Trade rules Enter the signal when the buy and sell signal arrives. Processing should only be initiated when signal warnings are received. It is absolutely necessary to close the operation when an opposite signal is rec

This indicator shows not just a line of the price balance, but also forecasts it for the specified number of bars ahead. That is, the level of the probable balance of the price reflects on the chart in the future. The level of balancing is set by the Balance parameter, that is, it can be drawn at any level. Forecasting the future with the Shift parameter. The indicator reflects information in a visual form. Do not forget that the approach to trading should be comprehensive, to enter the market r
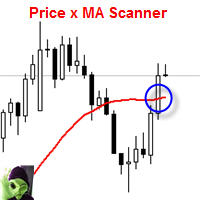
This indicator scans and displays currency pairs that have crossed a moving average depending on a given timeframe. You can configure which pairs the indicator will scan. It also includes all types of alert options.
Features Attach to one chart and scans all the currency pairs configured and visible in the Market Watch Window It can monitor all the available timeframes from M1 to MN1 and sends alerts on every timeframe's candle close when it crosses over a Moving Average Display all currency p
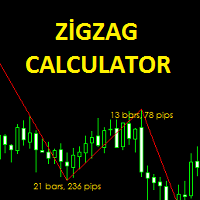
The Zigzag Calculator indicator is designed to calculate bar and pips of zigzag lines. this indicator pips the distance between the end points. You can also see how many zigzag lines are completed in the bar. It is simple and practical to use. Parameters Fontsize - Font size setting. TextColor - Text color adjustment. Depth - the depth setting. Deviation - Deviation setting. Backstep - back calculation setting.

Super signal series mystery arrows is an indicator designed to generate trading signals. This indicator uses a number of different indicators and generates a signal using a number of historical data. Currency pairs: Any Time interval: M5, M15, M30. Suggested M5 Work with at least 20 pairs
Parameters AlertsOn - send alerts. If this feature is activated, it will be activated in other warning properties. AlertsMessage - send a message AlertsSound - sound alert setting AlertsEmail - email al

Andrews Pitchfork channels is a triple trend channel tool consisting of three lines. In the middle, there is a median trend line on both sides that has two parallel equidistant trend lines.
These lines are usually drawn by selecting three points based on the heights moving from left to right on the response heights or graphs. As with the normal trend lines and channels, the outward trend lines mark potential support and resistance areas.
Parameters Trend_period - the period setting to be cal

Buy Bot - это полностью автоматизированный советник для торговли в восходящем тренде. Используются элементы стратегий сетки, скальпинга, без убытка, установка Stop Loss и Take Profit . Торговля по новостям. Советник выводит на график и сохраняет новости на локальном компьютере за 1 год. Новости обновляются каждые 60 минут или при нажатии кнопки "Обновить новости". Новости загружаются с сайта http://www.investing.com/economic-calendar/ . Для работы советника нужно добавить сайт в список разреше

This is the complete REX package. It consists of the lite, pro and ULTRA version.
Perfect for beginners and intermediates. REX complete is 100% non repaint. The strategy is based on a mix of different strategies, statistics, including pivot points, oscillators and patterns. As the trading idea consists of a variety of some classic indicators like Momentum, Williams Percent Range, CCI, Force Index, WPR, DeMarker, CCI, RSI and Stochastic, it is clear that the fundamental indicators have being

Fibonacci retracement is one of the most reliable and used technical analysis tools for trading. It uses the so called “golden ratio” to predict certain levels of support (price movement reverses from downward to upward) and resistance (price movement reverses from upward to downward) which is a mathematical pattern seen through out nature and even the universe. Because so many traders make use of this trading strategy and watch these price levels, more often than not the Fibonacci levels become

Here is an automated Andrews Pitchfork indicator which is DESIGNED SPECIFICALLY to integrate with custom Expert Advisor or MANUAL indicator. It will not allow manual modification as it is strictly use for automatic. However, you still can change the Zig Zag parameters to suits your need. Proposed default parameter is 18-Periods or more with +18. Feature Highlight
Right top corner of the Currency information % Strength / Spread / Remaining Bar Time Bottom Right Current & Previous SEQUEN
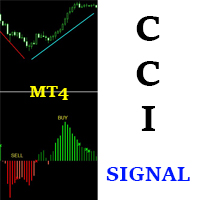
CCI SIGNAL This indicator is based on a custom CCI that is colored to reflect the trend. It was created with the idea in mind: "THE TREND IS YOUR FRIEND". It is simple and easy to use. Even a newbie can understand and use it to achieve great trade results. Simply follow the colors. RED means SELL. GREEN means BUY. It DOES NOT repaint and can be used for Scalping, Day Trading and Swing Trading. It can be used for any time-frame and any currency pair. CCI Signal is highly reliable and provides pow

MT5 version here
The Flexible Grid EA uses the RSI indicator to enter the trade. To enter BUY, the RSI must cross the bottom up the value specified in the EA parameters (for the sales, on the contrary, cross from top to bottom).
In case of a successful entry, the transaction closes either according to Take Profit, or Trailing Stop is used.
If the market goes in opposite direction, the order grid opens at a specified distance from the average price of the grid. Also, newly opened orders ca
FRIENDLY TREND This indicator is based on the common saying in forex and stock trading that:"THE TREND IS YOUR FRIEND" It is easy to understand and follow; even newbies can achieve great trades out of it. It paints Green candles in an uptrend and signals BUY. It also paints Red candles in a downtrend and signals SELL. The indicator DOES NOT repaint. It is good for any time frame and currency pair. It can be used for Scalping, Day Trading and Swing Trading. Friendly Trend gives push notifications

ATR Channel is an indicator. It shows us ATR ( depends on selected period ) Line on main chart. It also draw 3 up ATR channels (ATRu) and 3 down ATR channels (ATRd) on the same window. All they helps you to trade with a ATR indicator. There are 6 extern inputs; PeriodsATR : You can change ATR Period default is 13. MA_Periods : Use for draw ATR channels MA periods. Default is 34. MA_Type : You can change MA_method here. Default is Linear weighted. Mult_Factor1 : It is for first up and d
Dragon flight EA Dragon flight is a Martin-like EA, from Martin's theory, but the risk is much lower than Martin's, built-in risk control, so that you do not like pure Martin EA, after ten years of historical data review, repeated revision strategy, I have just released, in line with investors and users responsible for Caution is prudent. On the parameters
control : You can control this EA as you like. Reap profit1 and Reap profit1 :Profit point。 proposal
As the world's most knowledgeable pers

A Trading is a fully automated Expert Advisor that uses Price Action strategy to detect the new trend and enter trade with fix take profit and stop loss every orders. It uses smart algorithms to adapt to all markets. This EA can work successfully with any brokers and spreads. This EA always uses fix take profit and stop loss. No scalping, no martingale, no grid trading, no arbitrage. You can use EA with any brokers and spreads. Minimum balance is $100. However, bigger amount will help the EA pe

PipMaster is built using a powerful trend + momentum following algorithm. Made after years of testing and with market noise filtering built-in. Aggressive traders can enter a trade as soon as an arrow appear. Conservative traders should wait for a visual alert after a closed candle bar. This indicator is a great tool to be used with your most trusted trend/momentum trading strategy and with solid money management rules.
Key Benefits: -Super easy to use by following color coded arrow pointing
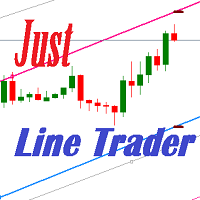
JustLineTrader is an EA for trading manually using Graphic Objects that are easy to use. There are 6 lines, namely Buy Line, TP Buy Line, SL Buy Line, Sell Line, TP Sell Line, and SL Sell Line. 6 The line is a trend line chart that we manually installed on the Chart. When the price reaches its Line, it will execute the order on the Panel Line Day Trade. JustLineTrader consists of a panel section for manual trading and part 6 lines for installing trend lines as triggers for order-send and order-c
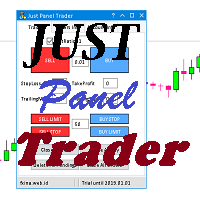
JustPanelTrader is an EA for trading manually using Graphic Objects that is easy to use. Trading is done by clicking the button on the panel Button consists of Sell: To place a Sell order Buy: To place a Sell order SellLimit: To install a Sell order SellStop: To install a Sell Pending Order CloseAll: To close all orders and pending orders ClosePendingOrder: To delete all pending orders CloseSell: To close all Sell orders Close Buy: To close all Buy orders
TextBox consists of LotRatio: to dete

The indicator Universal Separate Window works according to your rules. It is sufficient to introduce a formula, along which the line of the indicator will be drawn.
This indicator is intended for use in the separate chart window.
All indicators of the series Universal :
Main window Separate window Free MT4 Universal Main Window Free MT5 Universal Main Window Free MT5 MT4 Universal Separate Window Free MT5 Universal Separate Window Free MT5 Full MT4 Universal Main Window MT5 Universal Main W

The indicator Universal Main Window works according to your rules. It is sufficient to introduce a formula, along which the line of the indicator will be drawn.
This indicator is intended for use in the main chart window.
All indicators of the series Universal :
Main window Separate window Free MT4 Universal Main Window Free MT5 Universal Main Window Free MT5 MT4 Universal Separate Window Free MT5 Universal Separate Window Free MT5 Full MT4 Universal Main Window MT5 Universal Main Window MT

Needle is an adviser who trades on the breakout of support and resistance levels. Trading is pending orders. To support the position, a trailing stop is used.
Recommendations Currency pair: EURUSD; Accuracy : 5 signs; Timeframe: M5, M15, M30, H1; Recommended leverage: from 1:100 and above; Minimum deposit: $ 100; Before installing on a live account, test with minimal risk; Brokers with low spreads and low commission.
Settings and Input Parameters Risk - Risk per trade (as a percentage
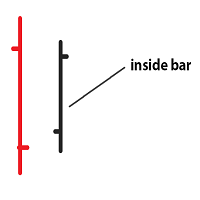
Inside bar price action. Inside bar must be completely engulfed within mother bar (mother bar is indicated as bar 2 in inputs). Stop orders will be placed after the formation of the inside bar at the top and bottom of the mother bar. Inputs: Interval from bar 2 - the distance of placing stop orders from the top and bottom of the mother bar. Lot Size - volume of the trade. Take Profit - multiple of the size of the mother bar. Stop Loss as % of mother bar - adjust the stop loss of the stop orders

Price Action Signals generates buy and sell signals with price close and complex logic. You can use it different timeframes and pairs. Best results are on M30 and H1 charts with default parameter. You can change this parameter ( nFrequency ) for other timeframes. ( except M1 timeframe ) There is only one extern input: nFrequency: It determines signal frequency. Default is 0.004. You can use this arrow for Expert Advisors. Upsignal: iCustom(......"PriceActionSignals", buffer nr:0 ) Downsignal :

Simplicity is a necessary condition of beauty (c)
Leo Tolstoy
This expert was developed for the 2008 championship. In that year he took 25th place.
The recommended tool is GBP, timeframe M30.
Transactions are opened to return to the calculated midline.
Expert Options:
minlot - the minimum lot;
maxlot - the maximum lot;
UseEquityStop - use stop by equity;
TotalEquityRisk - percentage of drawdown;
slip - slippage.

Mr Pound
Mr Pound is an Expert Adviser derived from many trend following indicators to generate signals that are automatically traded please make sure you have an account with a leverage of 1:50 0 Strictly recommended to 1H timeframe ,GBPUSD only The lot size is based on your balance Do not close any trade ,whether in profit or in loss to allow a safe money management If the Last trade is a loss while back testing ,it just mean that the trade was still opened but close at stop ,adjust t
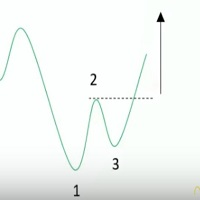
Ross Hook is a price pattern indicator that help traders to forecast market inversions. The activation of the pattern could identify turning points by finding the breakout SR levels or technical analysis figures like triangles, rectangles or head and shoulder. The Indicator runs in all Brokers using Metatrader 4 platform and can be used in an Expert Advisor or as a support of manual trading. This indicator is composed by the OnChart and OnWindow parts: OnChart : Draws the points 1, 2 and 3 t
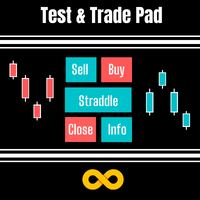
Test & Trade Pad works on strategy tester as well as on live and demo charts. You can really hone your trading skills in strategy tester especially with the control of tester speed feature. It is multi-functional tool with many useful features for testing or trading live. Has trade management features such as stop reversal, break even and trade re-entry to help you deal with stopped out trades.
It sits neatly on the left of the screen out of the way but with extra buttons, features can be e

This highly informative indicator applies overbought/oversold levels for more accurate representation of the market situation. All moving average settings are available, including average type and price it is based on. It is also possible to change the appearance of the indicator - line or histogram. Additional parameters enable more fine-tuning, while trading can be inside the channel and along a trend.
Distinctive features Oversold/overbought levels; Does not redraw. Additional parameters fo

Virtue Multi Lot "Virtue" is a fully automated Long term Expert Advisor. It calculates market condition itself and decides to enter a position. This is the main position. After that position, it adds some small lots for scalping. You can select how many orders will be open extra. It depends on your account margin and risk managment.
"Virtue" needs patience that is the why its name Virtue. Patience is a virtue. You must be patient to make some Money. You have to be wait it find optimal condit

This scanner is a tool used to support trading. Scanner searches on a wide market, in real time setups, created by mutual arrangements of candles (candles pattern). Its basic features are: 8 implemented trading setups (it is possible to add further setups, additional versions of the scanner), the possibility of simultaneous scanning, all financial instruments available on the platform, the possibility of simultaneous scanning, in all timeframes available on the platform, the ability to manua

HLOC Trend Indicator This indicator helps you to determine trend direction on your trade. Default parameters for H1 time frame. You can use this indicator both bigger time frame and smaller time frame to open a trade. The calculation is based on high, low, opening and closing price values of each bar in the selected time period. When the values found in the Indicator custom formula are exceeded, the buy or sell signal falls on the screen. There are two extern inputs; RiskFactor: Early but risky

Market Skanner Baks is a new indicator of market scanner. This indicator is equipped with a new algorithm for determining the trend. Now the trader does not need to analyze dozens of different indicators to determine the direction of the price movement. It is enough to place on the Market Scanner Baks chart and see where the arrow shows on the big and small timeframes. Thus, one can understand the short-term and long-term potential price movement. In addition, the indicator on the completion of

Due to the huge success of the limited free version, the now low priced LOTUS version will continue being updated in the future.
Optimal for Binary Options and Forex. For beginners and intermediates. Lotus is 100% non repaint. The strategy is based on 4 ADX parameters, including pivot points and candle patterns. It is recommendable to combine the arrow with an moving average, Elliot waves indicator or Parabolic SAR. The main goal was to keep it as simple as possible ! No useless oscillators
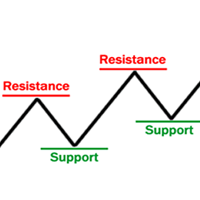
Supports & Resistances is an indicator that draws and reads automatically support and resistance levels like trendlines and fibonacci retracements to identify the most likely areas where the market will bounce. It mainly generates several horizontal and diagonal lines based on past highs and lows. The strenght: Reading on the code the supports and resistances areas permits to use the indicator in the Expert Advisor. The risk: Too many drawn lines on chart could confuse the manual trader but it
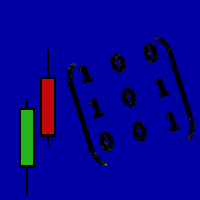
We highly recommend you running this expert at EURUSD H1. Linear Regression Trader employs the mathematical model of linear regression for smoothing price movements and trend recognition. Best results can be achieved when trading at the change of the trend or when the prices form a triangle, rectangle or similar patterns. Uses libraries for executing operations with matrices, already included into EX4 file. The principles of work:
Define the tangent coefficient of the line for the Large period

The advisor determines the candle formations of the two timeframes (current and one timeframe below) and starts working towards the most likely price move. Main analyzable ligaments: Head-shoulders + flag; Head-shoulders + double top; Flag + tapering triangle; Absorption + hammer. Each transaction has a Stop-loss and Take-Profit. Each transaction is independent. Hazardous methods of work are not used. It is recommended to use currency pairs for the default settings: GBPUSD 15m и EURUSD 15m. You
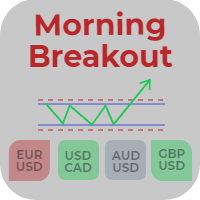
Morning Breakout is an indicator that calculates the morning range where a symbol has been moving in a period of time. It also displays that levels in the current symbol. Through this indicator you can analyze and track all the symbols you want to invest in. It also includes alerts, mails and notifications that enables the possibility to look for new market opportunities. Main Features of Morning Breakout Track all the symbols you want to invest in or the symbols in your market watch. Apply a co

This Expert Advisior is following the main trend and makes profit in bull and in bear markets. It works for all currency pairs. I have attached a Screenshot for GPDUSD D1. It is very effective and has small drawdowns. I will give this EA away for only USD 30,-. This offer is valid until June, 30 2018 Later on it will be much more expensive. It is very powerfull and profitable.

The Forex RSI Wizard Expert Advisor works based on changes in the RSI. It looks for the direction and the strength of the Relative Strength Index (RSI) and then places a buy or a sell order in the corresponding direction. To ensure maximum accuracy the EA also takes the bollinger bands in to account, in order to minimize false signals.
Forex RSI Wizard is intended for trading any currency pair on the M5 timeframe or higher. However, backtests indicate that it is best suited for GBPAUD on H1.
In indicators the positive scale often unreasonably is accepted though in fact they are the symmetric.
Such property has also standard RSI. The presented indicator works in the scale, symmetric concerning zero,
but at the same time completely repeats an original form. In this indicator important levels 20 and -20.
It is very convenient at its use in automatic trade as application of one threshold by optimization excludes overoptimization.
Besides, the algorithm of calculation of the indi

The robot is intended for trading on a real account. Two channels are being constructed: Hilbert Raff and John Bollinger. The external Raff channel allows you to determine the direction of the global trend. Inside it, in the Bollinger channel, trade is conducted on a trend. Provision is made for disabling martingale and money management, transactions are protected by stop-loss. Features of the trading strategy The robot calculates two channels. The external channel is calculated by the method of

Stay updated with Multicurrency Overview!! The algorithm of this EA releases an average of the movement percentage of all the Forex currencies linked to a single currency, isolating it, letting us to comprehend its real and specific trend.
Above on the left, a panel show us efficiently the trend of the currency, in the timeframe actually used. The second panel will keep you updated on macroeconomic news.
P.N.:The news time is based on your pc clock time, this way you won't have any problem r

This is the FXTraderariel-TakeProfit - Stop Loss Indicator . It provides you 3 potential Take Profits and 1 Stop Loss. These potential targets are computed based on several methods . The indicator can be used on every time frame, but we advise to use it on H1, H4 and D1. Especially if you are a novice trader. Pro Traders can also you use it for scalping in smaller time frames (M1, M5 and M15). This indicator is not a complete trading system. It doesn't provide you a Signal nor can predict the m

This EA exploits the inevitable behaviour of price fluctuations and breakouts. Because market prices will always fluctuate to higher highs before ebbing down to lower lows, breakouts of these levels will occur. This EA will open a trade in anticipation of catching some of the profits from these breakout moves. We use the fixed exit methods of Stop Loss, Take Profit and Trailing Stop in such a way so that we will scalp small but consistent profits.
No martingales needed, just a simple but e
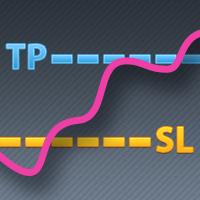
有些交易者不喜欢让他们头寸中的止盈/止损价格暴露出来,这个EA可以帮助他们。
把EA拖放在图表上,并设定止盈/止损点(0意味着忽略),如果图表上的商品有头寸,它会在图表上监察商品的价格,如果价格达到用户设定的止盈/止损水平,就关闭这个头寸。
这个工具可以有效隐藏用户的止盈/止损价格。止盈/止损价格由开仓价格与用户设定的止盈/止损点子所决定。
欢迎提出宝贵建议和意见。 。。。。。。。。。。。。。。。。。。。。。。。。。。。。。。。。。。。。。。。。。。。。。。。。。。。。。。。。。。。。。。。。。。。。。。。。。。 。。。。。。。。。。。。。。。。。。。。。。。。。。。。。。。。。。。。。。。。。。。。。。。。。

Kappa Trender is a unique indicator that will recognize trend direction and give you dynamically changing values for stop loss accordingly to further market movements and unique target calculations (take profit or trailing stop loss) based on last market movements. Even if you miss the signal (or close last trade at TP), this tool will give you range of price where you can re-enter with good risk-to-reward relation or you can enter manually and use current stop loss and take profit values. How

Primus Trading Engine is a trading system that combines price action,ratio based indicators & custom indicators to create this leading indicator with a multi-timeframe approach to give you high probability trade setups for forex,CFD cash/futures,metals & binary option to assist in making predictions on what is MOST likely to happen in the market Main Chart Features Price Action Signal-Arrow displayed on a specific bar;NOT buy/sell arrow;DOES NOT repaint;Bullish arrow on a bullish bar,price is l

Советник работает на тайм-фрейме H4. Валютная пара EURUSD. В качестве входных параметров используются: Lots, TakeProfit, Stoploss.Торговая активность наступает в момент появления локального тренда, наилучшие результаты при этом достигаются на четырехчасовых свечах. Используется фиксированный размер лота, в процессе торговли он автоматически не увеличивается. Усреднение и прочие "хитрости" не используются. Один сигнал - одна сделка.

这个多时间框架和多品种指标识别随机信号线何时与随机主线交叉。作为奖励,它还可以扫描布林带和 RSI 超买/超卖交叉。结合您自己的规则和技术,该指标将允许您创建(或增强)您自己的强大系统。 特征 可以同时监控您的市场报价窗口中可见的所有交易品种。仅将指标应用于一张图表并立即监控整个市场。 可以监控从 M1 到 MN 的每个时间范围,并在识别出交叉时向您发送实时警报。支持所有 Metatrader 原生警报类型。 该指示器包括一个交互式面板。请参阅单独的屏幕截图以进行说明。 指标可以将信号写入一个文件,EA 可以使用该文件进行自动交易。比如 这个产品 。 输入参数
输入参数的描述和解释可以在 这里 找到。 重要的 请注意,由于具有多功能性,既不会在安装指标的图表上绘制买卖建议,也不会绘制线条和箭头。相反,对象将绘制在图表上,当单击图表面板中的信号时会打开图表。 强烈建议将指标放在干净(空)图表上,不要在其上放置任何其他可能干扰扫描仪的指标或智能交易系统。
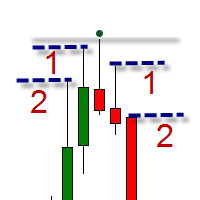
The indicator is intended for swing trading. The indicator is able to determine the trend and important trend peaks (swing), which will be important support / resistance levels. Features Simple visual displaying of 3 types of swings: Minor swings - do not affect the trend, but only on the movement within the trend Normal swings - can change the direction of the trend Strong swings - have a double confirmation of the importance of the level Visual displaying of the trend reversal Minimum of se

The Stepping Trend Indicator
The Steppi ng Trend indicator uses the average true range (ATR indicator) in its calculation. This gives you control to set your own average true range period, I set the Default as 10.
Indicator Details.
Green Arrow Up: This means you are at the starting point of a new bullish trend, it’s time to buy. Red Arrow Down : This means you are at the starting point of a new bearish trend, it’ s time to sell .
What if you miss the Arrow Signal?
No
Probability Indicator displays volatility bands on the price chart and calculates probabilities of price exceeding specified levels for the next bar, taking trend into account. It does that by performing a statistical analysis of the completed bars in the chart's history, which may include years of data. The volatility bands differ from Bollinger bands in the calculation of standard deviation from the simple moving average, resulting in bands that envelop the range of price swings in a channel t

介绍 TPSL Driver Utility ,这是一款功能强大的工具,旨在通过自动化止损和获利管理来增强您的交易体验。该实用程序迎合了每个需要无缝订单管理和高级利润保护技术的交易者。 使用 TPSL Driver Utility,您可以灵活地在两种订单管理模式之间进行选择:隐藏和可视。隐藏模式允许您隐藏获利和止损水平,提供一种谨慎的方法来管理您的交易。另一方面,可视模式提供传统的获利和止损水平显示。 通过多种选项来设置止损和获利,从而控制您的风险和利润目标。无论您喜欢按点数还是按美元金额计算,该实用程序都能确保精确控制您想要的水平。此外,利润保护选项通过在您的交易达到特定点数或特定金额时自动调整止损水平来增加额外的安全层。 使用跟踪选项最大化您的利润,该选项会随着市场向您有利的方向动态调整止损水平。此功能允许您锁定收益并跟踪您的利润以捕捉额外的上涨潜力。 通过弹出通知、声音警报和移动通知提供的实时警报,随时了解情况,不错过任何交易机会。该实用程序的用户友好设置使自定义变得轻而易举,让您可以将其无缝集成到您的交易设置中。 体验 TPSL Driver Utility 的快速响应性能

MathScalperPro
MathScalperPro is an automatic trend trading system based on mathematical calculations. The Advisor calculates the trading levels of price corrections and enters the transaction in the direction of the trend. Inputs on levels are possible in two ways. The first way is to enter the candlestick pattern 1-2-3, and the second way is to enter the change of direction of trade in the younger period. Each trading pair has its own settings, which you will get when buying this Expert Adv

Money Management Parameters (параметры управления капиталом)
UseMoneyManagement - Управление капиталом включить или выключить. Допустимые значения: true / false Lots (по-умолчанию: 0.1 ) - Размер позиции RiskInPercent (по-умолчанию: 2.0 ) - Риск в процентах при включенном управлении расчёта позиции MaximumLots (по-умолчанию: 500 ) - Максимальный объем лота. Значение по-умолчанию: UseFixedMoney (по-умолчанию: false ) - Задействовать весь капитал счета в процентах или нет. Допустимые з

PABT Pattern Indicator - it's classical system one of the signal patterns. Indicator logic - the Hi & Lo of the bar is fully within the range of the preceding bar, look to trade them as pullback in trend. In the way if indicator found PABT pattern it's drawing two lines and arrow what showing trend way. - First line - it's entry point and drawing at: 1. On the high of signal bar or on middle of the signal bar (depending from indicator mode) for buy; 2. On the low of signal bar or on middle of t

This indicator is used to visualize the profit of closed and open orders on the symbol. To control using four buttons which are located on the chart after the indicator is started: Button "C" - show/hide on chart open and close points of closed orders from account history by current symbol; Button "O" - show/hide on chart open points of opened orders and distance between open point and current order close price point; Button "$" - show (if button "C" and/or button "O" activated) / hide every ord
AST_personov is an indicator, which presented of the arithmetic average of the ticks. Next to the current price, a line appears with the value of the AST deviation from the current price (in points). If the value is positive, it is green and if it is negative, it is red. What is the arithmetic average of the ticks ? This is the average of the last ticks that the price move. It has nothing to do with bars ( prices Open, Close, High and Low ). Calculations are carried out using ticks. The values c

Chicken peck rices 这是一个基于价格突破的短线EA,参数简单,适应性强。 要求: 运行时间周期:H1; 账户类型:ECN,货币对点差≤3,如欧美,美日等品种; 挂单最小点差:0,即设置止损或止盈与现价的最小距离为0。 请用符合要求的账户挂EA以保障盈利的可靠性。 参数说明: explanation=chicken peck rices—EA名称。 Magiccode=112201—魔术码,用于区别不同EA的订单。 lots=1.0—仓位系数,1.0对应1万美元开单1手,根据余额自动调整比例开单,如余额为1.5万美元时,仓位自动调整为1.5手。 riskline=0—风控线,可根据账户资金自己设置,当账户净值低于设定值会平掉所有订单以控制最大风险。

MMM Relative Strength Index Strategy: The Expert Advisors uses its two built-in RSI indicators to determine the prices trends and calculates the signal to decide to open buy or sell positions. It sends an order, closes or moves the Trailing Stop loss position as the indicator works. You can define the time period of each day of the week the EA should not trade (the bad time to trade). Usually the period of day when the impact news are published. General Inputs Closes orders with any profit of va

The block of bars is collected under condition of divergence . If the divergence conditions are not met, the block is deleted. More precisely, the condition is the transition of the block of bars from the state of divergence to the state of convergence . Blocks are formed selectively with gaps. Gaps are characterized by the state of convergence of bars. The indicator shows the value and direction of the price in the divergence block .
To determine the divergence value, see here , the line of ex

Этот индикатор предназначен для контроля уровней CCI на текущем и старших от него таймфреймах. Панель управления проста в понимании и состоит из кнопок, с помощью которых можно управлять отображением линий, соответствующим указанным на наименовании кнопок. Цвет кнопки совпадает с цветом линии. Этот индикатор из серии подобных индикаторов, которые уже успели завоевать популярность: https://www.mql5.com/ru/market/product/30276 и https://www.mql5.com/ru/market/product/30403
Параметры "___| Set
Main: Not martingale, not a grid, working on all symbols; a good rational algorithm; Work of two indicators: RSI (from older timeframe - it works as a signal filter) and RSI (from junior timeframe - it works as a signal) ; There is a good money management system (there are several type for trailing stop loss); EA can work on closed candles, and on current candles; Quickly optimized (the work is maximally accelerated). Current sets after optimization are in comments. MetaTrader 4: https://www.m
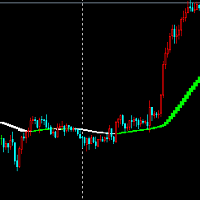
看图就能一目了然,多空变色指标很好用的指标。 指标参数可以随意设置,我一般交易的时候都会用到这个指标来衡量多与空的判断, 虽然指标都有延迟性,但我觉得这个指标无论是性能还是外观,都能让你一眼就能判断多空,我觉得这个指标是交易者参考的神器。 指标中的颜色说明
当指标有绿色变为白色的时候就说明价格的涨势已经到头,或是下跌或是震荡,视情况而定,反之亦然。 对于这个指标我作为开发这也没有太多的说明,本着对交易者负责,我还是做了一些小小的解释,希望我的解释对使用者有些用处。 这个指标我自己已使用了很多年了,成功率很高,希望能对广大投资者有所帮助, 参数我就不一一说明了,很简单的参数设置,一看你就会明白。 该指标对偏震荡的品种看不出效果。
The block of bars is collected under condition of divergence . If the divergence conditions are not met, the block is deleted. More precisely, the condition is the transition of the block of bars from the state of divergence to the state of convergence . Blocks are formed selectively with gaps. Gaps are characterized by the state of convergence of bars. The indicator shows the di vergence value . If the indicator is higher zero, the block is not formed and the bars are skipped. If the indicator
The block of bars is collected under condition of convergence . If the convergence conditions are not met, the block is deleted. More precisely, the condition is the transition of the block of bars from the state of convergence to the state of divergence . Blocks are formed selectively with gaps. Gaps are characterized by the state of divergence of bars. The indicator shows the value and direction of the price in the convergence block .
To determine the convergence value, see here , the line of
The block of bars is collected under condition of convergence . If the convergence conditions are not met, the block is deleted. More precisely, the condition is the transition of the block of bars from the state of convergence to the state of divergence . Blocks are formed selectively with gaps. Gaps are characterized by the state of divergence of bars. The indicator shows the convergence value . If the indicator is below zero, the block is not formed and the bars are skipped. If the indicator

This indicator shows Linear Regression Line and it's channels which calculated with fibo numbers. You can use this indicator in different timeframes on your chosen timeframe chart. You only need to attach this indicator on the chart twice or more with a different colors to do this. There are 6 input parameters; period : you can choose regression timeframe independent of chart timeframe. linewidth : width of line on the chart. bars back regression begin : calculated regression bar count. LR

欢迎使用MQL5上的革命性指标"3 Peaks"!作为一名经验丰富的交易者和专注于销售的卖家,我非常高兴向您推荐这款强大的工具,为您的交易体验带来前所未有的准确性和可靠性。 "3 Peaks"指标拥有令人印象深刻的功能:它能够识别并在屏幕上提醒您当连续出现三个峰值时。无论您使用的是哪种图表表示、时间框架或货币对/商品,该指标始终高效可靠。 那么,什么是峰值呢?峰值特点是价格线呈现倒置的V字形状,由三个柱形图组成。要被视为峰值,第一个柱形图的开盘/收盘价必须低于第二个和第三个柱形图的开盘/收盘价,而第三个柱形图的开盘/收盘价必须低于第二个柱形图。 [包含显示三个柱形图形成峰值的相关屏幕截图或图表] 为什么要依靠"3 Peaks"指标?广泛的研究表明,当连续出现三个峰值时,市场总是延续其牛市趋势。通过我们的指标,您可以准确预测即将到来的牛市。 为了便于识别,"3 Peaks"指标为每个峰值提供了独特的颜色方案:第一个峰值以粉红色显示,第二个峰值以黄色显示,第三个峰值会在屏幕上触发红色警报,提示即将到来的趋势。 [包含显示颜色顺序相连的峰值的屏幕截图] 我们的分析基于市场事件驱动的基本原理
您知道为什么MetaTrader市场是出售交易策略和技术指标的最佳场所吗?不需要广告或软件保护,没有支付的麻烦。一切都在MetaTrader市场提供。
您错过了交易机会:
- 免费交易应用程序
- 8,000+信号可供复制
- 探索金融市场的经济新闻
注册
登录