YouTubeにあるマーケットチュートリアルビデオをご覧ください
ロボットや指標を購入する
仮想ホスティングで
EAを実行
EAを実行
ロボットや指標を購入前にテストする
マーケットで収入を得る
販売のためにプロダクトをプレゼンテーションする方法
MetaTrader 4のための新しいエキスパートアドバイザーとインディケータ - 178

Sputnik it is a Secure Automated Software for trade Forex market and indices.
The architecture is a Fully Automatic Autonomous Robot Expert capable of
Independently analyzing the market and making trading decisions
Sputnik It is an advanced trading system. This is a fully automatic Expert Advisor.
Sputnik is a plug and play system Sputnik It is a 100% automatic system, The system is self-sufficient, performing all the work. You can download the demo and test

The Expert Advisor works with the EUR / USD currency pair. Trades are opened almost every day during the opening of the London Stock Exchange. The robot does not use indicators. To protect the account from trading when the spread is widening, the MaxSpread parameter has been added, in which you specify the maximum allowable spread for trading. It is extremely important to adjust the "OpeningOfTheLSE" parameter to suit your time. In it, you must indicate the opening time of the London Stock Excha

FXC iRSI-DivergencE MT4 Indicator
This is an advanced RSI indicator that finds trend-turn divergences on the current symbol. The indicator detects divergence between the RSI and the price movements as a strong trend-turn pattern.
Main features: Advanced divergence settings
Price based on Close, Open or High/Low prices Give Buy/Sell open signals PUSH notifications
E-mail sending Pop-up alert Customizeable Information panel Input parameters: RSI Period: The Period size of the RSI indicator.
R
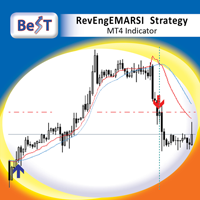
BeST_RevEngEMARSI Strategy is an MT4 Indicator that is based on the indicator RevEngEMARSI by Giorgos Siligardos that was presented in his article " Reverse Engineering RSI (II) " ( TASC_Aug 2003 ) as a new variation of his inverse-RSI indicator and which transforms the Exponential moving average of RSI into a curve in the price graph, simplifying the price projection method and improving its visual representation. BeST_RevEngEMARSI Strategy while implementing the crossings with its Moving Aver

The DYJ GlobalTradeGameTheory(Alligator) is based on Alligator indicator. It can be used for any currency pair and timeframe. Alligator : Market entry condition BUY: Lips#1 > Teeth#1 and Teeth#1 > Jaws#1 SELL: Lips#1 < Teeth#1 and Teeth#1 < Jaws#1 It also uses Laguerre filtering false signals. We will now apply game theory strategy on the future of per currency instead of a price chart of history. This is one level higher. Dynamic Market game theory is a special feature of Advanced Curren
The EA trades at the beginning of the London session. This non-indicator trading strategy is based on the price movement of a currency pair during that day, the previous day and the entire previous week. The Expert Advisor is equipped with partial closing of a trading lot, a spread filter. The recommend
DYJ GlobalTradeGameTheory( Fractals ) is based on Fractals indicator. It can be used for any currency pair and timeframe. It also uses Alligator and Laguerre filtering false signals. We will now apply game theory strategy on the future of per currency instead of a price chart of history. This is one level higher. Dynamic Market game theory is a special feature of Advanced Currency Health Bars indicator and you cannot find in any other Currency Meter! This is a very unique function. Dyn

DYJ GlobalTradeGameTheory(Power) is based on Bulls and Bears indicator. It can be used for any currency pair and timeframe. Power: Market entry condition Power attempts to gauge bullish and bearish forces in the market by using two separate measures, one for each type of directional pressure. The EA's BearsIndex attempts to measure the market's appetite for lower prices
The EA's BullsIndex attempts to measure the market's appetite for higher prices It also uses Laguerre filtering fa

EURUSD DECODER EA is a fully automated mid-term, medium-risk expert advisor. Adaptive price pattern analysis is used to identify potential trade entries and exit. The EA does not use any unfair money management practices like grid and martingale. Each position includes a stop loss and all open positions are monitored by an advanced loss control algorithm, which decides when to close profit and when to accept loss. Before you buy all of my product please be aware of the risks involved: 1) Pl

The indicator identifies two most important patterns of technical analysis - Pin Bar and Engulfing. MT5-version https://www.mql5.com/en/market/product/53701 Settings: Mincandle size for PinBar - The minimum size of the Pin-Bar candlestick; Percentage of candle body on size - The percentage of the candle body in relation to its length; PinBar Alert - Alert when a Pin-Bar is detected; PinBar Mail - Sends an email when a Pin Bar is found; PinBar Notification - Sends a push notification when a Pin
The DYJ GlobalTradeGameTheory(Force) is based on ForceIndex indicator. It can be used for any currency pair and timeframe. It is better to buy when the forces become minus (fall below zero) in the period of indicator increasing tendency; The force index signalizes the continuation of the increasing tendency when it increases to the new peak; The signal to sell comes when the index becomes positive during the decreasing tendency; The force index signalizes the Bears Power and continuation o

DYJ GlobalTradeGameTheory( StrongCurrency) is based on StrongCurrency indicator. It can be used for any currency pair and timeframe. When the long short strength of a currency pair is greater than the specified value (minimum 70%), it is allowed to enter the market. It also uses Laguerre filtering false signals. We will now apply game theory strategy on the future of per currency instead of a price chart of history. This is one level higher. Dynamic Market game theory is a special fea
The DYJ GlobalTradeGameTheory( BandMARSI) is based on Band and MA and RSI indicator. It can be used for any currency pair and timeframe. Moving Average bands together with a RSI filter is a 'simple', but very powerful and reliable signal. two "moving average bands" generate the signals. It also uses RSI and Laguerre filtering false signals. We will now apply game theory strategy on the future of per currency instead of a price chart of history. This is one level higher. Dynamic Market gam
Public Signals using this EA:
https://www.mql5.com/en/signals/1016250 https://www.mql5.com/en/signals/1018964 The EA waits for the first executed order available and then opens a grid of pending stop-type orders in the same direction of the first one The first order that we usually call the master trade can be opened manually, on specified day and or via any other EA, indipendent from this one There is a dedicated Telegram Group with use cases and best settings, feel free to join and ask fo

Money Heist is a dollar cost averaging robot simple to use and understand, good for beginners but not only. The robot uses the last closed candle to decide if to open a buy or sell. If the transaction works in your favour it will be closed at the chosen TP. If goes the wrong direction it will open new orders at the chosen step in order to average the entry price and take the profit in the next correction. If bidirectional is true the robot will open a buy and a sell and manage both of them indep

Индикатор ищет дивергенции по индикаторам: MACD, RSI,CCI,Stochastic,OsMA,RVI. По клику на сигнальную кнопку осуществляется переход на график с
сигналом. Для каждого индикатора применяется свой шаблон. Цифры на сигнальных кнопках указывают расстояние в барах от сигнала. Прокрутка
(scrolling) панели осуществляется клавишами "UP" "DOWN" на клавиатуре.
Входные параметры
Lists Of Currencies To Search For Divergences - Список торговых инструментов.
General Setting - Общие настройки панели.
T

Description This expert advisor uses with a Scalping Technique Strategy . Can be used with limited capital and minimum capital of 100 USD with 1:500 Leverage , it is Recommended by using 200 USD capital Leverage 1:500 , or more.
Use on brokers with tickcharts and data on a good M1 timeframe chart.
Use on brokers with Spreads of less than 30 points .
Use the settings contained in the colomn tab screenshots to get the best settings. Best Open Account Parameter : Equity = 200 USD Leverage =

Trading is a trade war. So a trader is a warrior. A warrior needs to be armed with a weapon
This Binary Star Wars Pro is your workout routine. That can accelerate the results precisely
Who deserves this kind of precision weapon? 1. People who want to profit. From binary options trading 2. Those who want to trade short, profit fast 3. People who want long-term Can be done 4. Newbie can use it. 5. Old hands can be used very well.
How it works It works very easy. For binary options Time fra

Multi Time Frame Indicator acts as a Scanner based on the Ichimoku Trading System. The outcome is displayed on a board. This helps you to make "at a glance" a mental picture of the System without having to open the chart. Up to 10 Currencies can be watched. Scanned elements And Legend "KUMO Futur" - Green : The Kumo Futur is Bullish. "KUMO Futur" - Red : The Kumo Futur is Bearish. "PRICE Cross KJ" - Green : The Price is Above the Kijun Sen. "PRICE Cross KJ" - Red : The Price is Below the Kijun
FREE

RSI Color and Notification Setting Usages :: 1. Set value Oversold and Overbought 2. Set period RSI 3. Set Color 4. Notify to Alert, Email and Mobile.
For Trading :: Forex and Binary option 1. When the color alarm occurs in the OVB area, do the preparation. To enter a Sell order 2. When the color alarm occurs in the OVS area, do the preparation. To enter a Buy order 3. When RSI is between OVB and OVS, consider another indicator to trade.
FREE

MultiPairs MT4 is a fully automated Expert Advisor. This expert advisor is based on Multi-currency strategy . This system analyzes the market volatility to find trading signals based on trend reversal strategies and is used to evaluate oversold and overbought market conditions. Swing trading is a short-medium speculation based on the buying-selling force in the trading market with an advantage and low risk with a trend reversal pattern. The Expert Advisor does not use martingale, grids, hedg

There are 8 types of this indicator. Consisted of 1. Bullish and Bearish Engulfing 2. Morning and Evening Star 3. Three Green Soldiers and Three Red Crows 4. Three Inside Up and Down 5. Three Outside Up and Down 6. Bullish and Bearish Harami 7. Tweezers Top and Bottom 8. Piercing and Dark cloud cover
Signal Filter :: 1. The appearance of the candle stick 2. SMA 3. 2EMA :: EMA Fast and EMA Slow 4. RSI
N otification :: 1. Via screen 2. Email 2. Phone
For trading 1. Scaling 2. Binary options

Индикатор высчитывается по сложному авторскому алгоритму. Он строится с учетом тенденции по зонам перекупленности перепроданности объёмов . Это позволяет выявлять дивергенцию объёмов , выявить так называемые приседающие бары. Также он определяет уровни входа в рынок и цели. Средняя линия канала является предполагаемым уровнем отката.
RPeriod- период расчета индикатора
Indicator_Level - уровень зон перекупленности перепроданности
Draw Fibo Levels - отображаем целевые уровни
Fibo Level Col

A simple and very effective strategy. Mean Renko candles and Moving Averages. Renko Scalping EA can trade fully automatically.
Instructions how to create an Offline chart and Renko Scalping EA Settings
The reason why I use Mean Renko candles is very simple. Mean Renko boxes filter out price ranges and make the chart look very clean and transparent. By adding the usual Moving Averages to such a chart, the overall picture will give you a quick overview of when price is trending

This indicator is an upgrade of traditional MACD on MT4. Macd Base line cross above Macd signal line the color of histogram change is red color and entry order Sell. Macd Base line cross below Macd signal line the color of histogram change is green color and entry order Buy.
For above histogram of Macd can change color to good looking by can change color above zero line and lower line.
Fibo Sequence EA
The EA Strategy: This EA strategy is based on Fibonacci Sequence number Calculations to produce it's own signals and trade automatically. It was built for those traders who loves and trust Fibonacci Levels. In finance, Fibonacci level is a method of technical analysis for determining support and resistance levels. They are named after their use of the Fibonacci sequence. Fibonacci is based on the idea that markets will retrace a predictable portion of a move, after which they
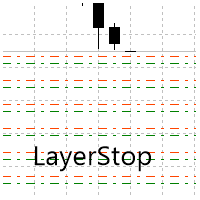
LayerStop EA only performs an action open pending order BUYSTOP or SELLSTOP, thus only monitor the trailing stoploss.
No specific conditions are used to open pending order.
Pending order BUYSTOP or SELLSTOP will generated immediately after an Expert Advisor is attach in the chart.
Suitable for News High Impact.
If you already attach LayerStop EA in the chart, and want LayerStop EA performs new one an action open pending order BUYSTOP or SELLSTOP, you need to remove LayerStop EA from

OPENING PRICE: $49, 2 COPIES LEFT!
Next price: $149 Final price: $299
This is an expert that is fully automated with fixed stoploss and take profit. You can choose if you want to trade with fixed lots, or lots per amount in balance. This EA is based on pure trend movements.
No martingale No grid
Broker and deposit
Any broker with small spreads is suitable. Recommended deposit: $300 or more. Minimum deposit: $100
Currency pairs and timeframe Recommended pair: EURUSD Recommended t
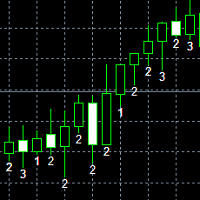
Rob Smith's is a trading method developed over a 30 year career in the market. TheSTRAT is a multi-timeframe strategy that has three major components: Inside Bars - Inside Bars occur when the current candle falls completely within the prior candle. Directional Bars - Directional Bars occur when the current candle takes out one side of the prior candle. Outside Bars - Outside Bars occur when the current candle takes out both sides of the prior candle. #thestrat

hello every one -this ea use angles of gann every time candle close up or down any angle it,s open order -the first lot auto every 1000 usd = 0.01 lot, if the balance 3000 usd = 0.03 lot ,you can change it by(usd-risk)
-lotmponloss is the option for multiplication it.s stander 0 -the tack profit will will move up or down every trade open just if the trade loss. good luck for all

PipJet MT4 EA is a fully automated Expert Advisor. Its advanced price action based algorithm is trying to predict next candle's direction and opens (or not) the appropriate trade. It has a unique number of settings that make it extremely versatile in all market conditions.
Requirements Optimized to work with GBPUSD Timeframe M1. Recommended deposit is $250 for initial lot set to 0.01 , $2500 for initial lot set to 0.10. Any Broker with low spread is recommended to get better results. Co

Retracement Hunter This Indicator based on powerfull daily levels . support and resistance, Buy / Sell entries which is more based on low risk and high reward and winning ratio, Enter trade when you get popup alert , book profit on target1, target 2, target3 levels, most of the trending days it will hit target3, but its always safe to book partial at target1 or target2
Buy best entry when rule 1) look for Buy 2) Emas aligned less than 0.25 3) Main Ema aligned Buy , it will alert when all t

EA WolongVN No1 uses multipair to correlate transactions between pairs. Use data of the stock exchange https://www.nyse.com/ to evaluate the direction of the dollar index Use data of the stock exchange https://www.londonstockexchange.com/ to evaluate the trend of EUR Then compare the correlation between the two data to execute an order XAUUSD, EURUSD, GBPUSD .... EA runs on data of saxo bank and dukascopy bank. So the backtest will not have high accuracy There are of course some constraints, in
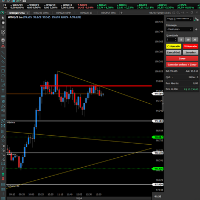
O indicador DonForex é uma das ferramentas mais utilizadas para traçar suporte e resistência automaticamente. Ele traça os melhores níveis de suporte e resistência do gráfico em qualquer tempo. Isso ajuda você a ter uma visão mais amplas para fazer suas operações
As linhas pontilhadas são os pontos mais tocados pelo preço formando assim uma região de suporte ou resistência. Ele também traça automaticamente linhas de tendências de alta (LTA) ou de baixa (LTB) nos dando oportunidade de compra e

Trend Power Indicator is an indicator which helps to identify trend direction and its power by using moving averages ZigZag pattern and correlations of tradable instruments. It provides trend power data with user-friendly interface which can be read easily and fast. This indicator by default is configured for trading of Adam Khoo's ( Piranhaprofit ) strategies. It saves mass of time for searching of tradable pairs by his strategies. It indicates when all required moving averages are align

インディケータは、前日に基づいて計算されたクラシックピボットレベルをチャートに表示します。 数式を計算する時間から選択できます。 フラットでの反転レベルでの取引。 トレンド市場では、それらをターゲットとして使用します。 取引を成功させるための戦略と組み合わせる 。 レベルはバッファを使用して構築され、利用可能な見積もり履歴全体に表示されます。
入力パラメータ 。
Start Hour - 1日の始まりの時間から。 00-デフォルト 。 Show Mid Pivots - 中間レベルを表示する 。
Visual Button - ボタン表示(有効/無効) 。 Corner - ボタンアンカー角度 。 X indent - ピクセル単位の水平パディング 。 Y indent - ピクセル単位の垂直パディング 。
Label Visual - 表示レベルラベル 。 Label Font Size - フォントサイズ 。 Label Shift Bars - バーの碑文のインデント 。 Label Tooltip - レベルの上のカーソルの下にテキストを表示する
FREE

FTU フィボナッチ この指標は、価格アクションからリトレースメント レベルの fib レベルを描画します 特徴: 複数の Fibo レベルを調整可能 範囲からバーの色と量を変更する 50 バーの履歴の場合は 2 行、20 バーの履歴の場合は 2 行で、両方とも 38 と 61 の Fib レベルを示します 使用法: 目的は、価格のリトレースメントを調査または測定することです 範囲からバーの色と量を変更する任意の時間枠、製品/ペア、再描画なし、高速読み込みで使用 将来のアップデートはすぐに来る.. 私の他の製品やビデオを見て、私の指標を組み合わせて、参加すると毎日のバイアスと高低の予測を受け取ります. FTU fibonatchi kono shihyō wa, kakaku akushon kara ritorēsumento reberu no fib reberu o byōga shimasu tokuchō: Fukusū no Fibo reberu o chōsei kanō han'i kara bā no iro to ryō o henkō suru 50 bā
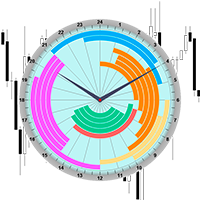
The professional indicator of Trading Sessions is now available in MetaTrader4.
Also the professional BROWSER of the NEWS and Trading Sessions is now available in MetaTrader5.
One dial shows the time of the 18 largest stock exchanges in the world. This makes it possible to trace the characteristic movement of the market at the appropriate time of day.
Thanks to sound and Push notifications, you will never miss the start of trading on the next exchange!
The operating time of each exc
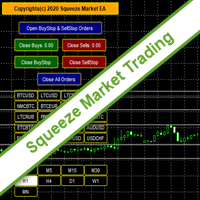
SqueezeMarket EA Utility is an Utility EA that works normally in the environment where the market direction could not be ascertained. It helps the trader to open both the Buystop and Sellstop pending orders at once.
After you see the market squeezed for a particular period on any currency pair, then, you will first of all plot an upper channel line on your chart window and do the same for the lower channel line, then open your SqueezeMarket EA Utility parameter settings by right clicking on t
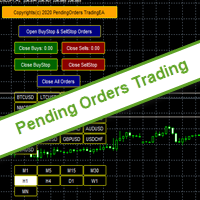
PendingOrders EA Utility is an Utility EA that works by opening both the Buystop and Sellstop pending orders at once.
When you get to a point where you can't really tell where the price will go next or after the release of a big news, what you need is simply plot your pending orders both up and down so that when the price move away from the point of stagnation, it will either move up or down, by this, you will catch most of the moves. All the default setting are defined as the System demands
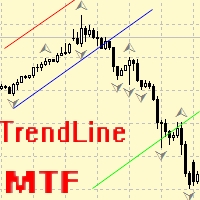
専門家のアドバイザーマニュアル工事の傾向線に伴う損益は、受益となりました。 ビルド後、EAはレベル、方向、およびロットを記憶します。 計算された価格で現在の価格をタッチすると、事前に選択されたパラメータを持つ注文が開かれます。 異なる時間枠から最大10の多方向レベルを構築して保存することができます。 あなたは、任意の取引商品でそれを使用することができ これは、4桁と5桁の価格で正しく動作します。 あなたは、取引チャネルの内訳とそれからのリバウンドの両方のいくつかの取引ラインから取引戦略を作成することができます。 市場価格がそれに触れていない場合は、取引ラインのすべての設定が削除される期間を設定することができます。 トレンド目標の計算の便宜のために、設定レベルを備えた組み込みのFiboルーラーがありますが、イベント処理の特殊性のために、この関数はテスト中に
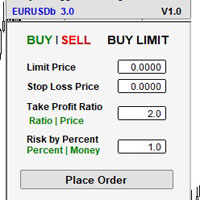
アシスタント取引保留中の注文MT4 貿易アシスタントは、手動取引のために設計された取引パネルです。 パネルでは、リスクの計算、制限注文を使用したポジションの管理、 その他の便利な機能。
パネルの主な機能 通貨ペア、CFD、株式、インデックス、先物、暗号通貨 - それは、任意の取引手段で動作します。 2. ストップロスを設定し、ポイント単位で距離として利益を取ります. 3. 潜在的損失対利益率を設定し、表示します。 4. パネルは、保留中の注文をサポートしています。 5. 開く前に、計算されたポジションのボリュームと利益をチャートに表示します。 6. 機能制限命令。
Trade Assistant is a trading panel designed for manual trading. The panel allows you to calculate risk, manage positions using Limit orders, And other useful features.
Key features of the panel It works w
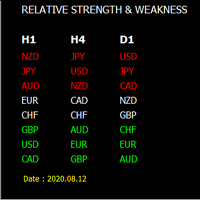
通貨の強さ計は強い、弱い通貨を識別する最も簡単な方法です。 この指標は、8主要通貨の相対的な強さを示しています: AUD, CAD, CHF, ユーロ, GBP, JPY, NZD, 米ドル.
この通貨強度メーターは、多くの強力な機能をサポートしています。 1.通貨強度メーターダッシュボード(1つのユーザーフレンドリーなダッシュボードで名前や値でソートして任意の時間枠の通貨の強さを示しています)。 2.指定された時間枠から平均通貨強度を計算することができます。 いくつかのアルゴリズムで取引可能なペアを検索(強い通貨と弱い通貨を見つけ、テーブルで取引可能なペアとして表示することができ、手動でこの計算を行うためにあなたの時間を無駄にしません)。 4.強力な通知マネージャ: A。 交差レベルによる通知(レベルと時間枠は式によって設定されます)。 B。 交差する線による通知(時間枠は式によって設定されます)。 C。 新しい取引可能なペアが見つかった場合の通知 (取引可能なペアは式によって見つかる); 5.通貨の強さの計算のための多くのアルゴリズム(移動平均、RSI
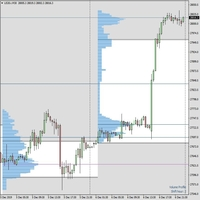
みなさん、こんにちは。 私は 10 年以上取引しており、私の意見では市場プロファイルは頭痛のない長期取引を成功させる方法です。これは、大規模な金融機関が長期的に取引する方法によりよく似たシステムです。私は S & P 、 NASDAQ 、 DAX などのインデックスの累積ポジションを構築するために幅広く使用しています。しかし、 FOREX メジャーやコモディティにも非常に適しています。 マーケットプロファイルは、シカゴのピーターシュタイドルマイヤーによって最初に提示されました。彼はボリュームがガウス曲線を形成する特定の価格レベルの周りに分布していることに気づきました。ガウス曲線は、数学者ガウスによって誤差の分布を研究するために導入されたものであり、今日では、天気予報などの多くの現実の現象を予測するために最も広く使用されている確率モデルです。このトピックについてさらに詳しく知りたい場合は、「 Mind Over the Market 」という本の PDF と、市場のプロファイルについて詳しく説明した他の本をお送りします。インディケータを購入した場合、マーケットプロファイルのみの非常に優れ

This multi time frame and multi symbol indicator alerts about Heiken Ashi Smoothed color changes. As a bonus it can also scan for Hull Moving Average trend (color) changes. Combined with your own rules and techniques, this indicator will allow you to create (or enhance) your own powerful trading system. Features
Can monitor all symbols visible in your Market Watch window at the same time. Apply the indicator to just one chart and instantly monitor the entire market. Can monitor every time frame

Check it out and if you like it just enjoy it. Try various values to find the setting that best suits your trading. Upward signal if the indicator is colored lawn green and bearish signal if the indicator is gray. You can use the line itself to trailing stop when you open orders. This is just a tool. A complement. It is not a strategy. Combine it with your own analysis Just download it and try it, it's free.
FREE

Excellent dashboard for market analytics. The panel helps to analyze the values of the RSI indicator and its signals.
With this panel you can: watch the current signal from RSI on all timeframes; watch the current signal from RSI by different symbols; watch the current RSI value; several types of signals for analytics.
Values in a table cell: RIS value.
Signal type: RSI crosses level buy out/level sell out (outside); RSI crosses level buy out/level sell out (inside);
RSI is upp

Excellent dashboard for market analytics. The panel helps to analyze the values of the Ichimoku indicator and its signals.
With this panel you can: watch the current signal from Ichimoku on all timeframes; watch the current signal from Ichimoku for different symbols; watch the current Ichimoku value; several types of signals for analytics.
Values in a table cell:
Value of Tenkan-Sen Value of Kijun-Sen Value of Senkou Span A Value of Senkou Span B Value of Chikou Span Span A -

The new indicator is a trend predictor for the current chart as well as other symbols and timeframes. Every button on the board is interactive. By default, you have 20 currency pairs in the watchlist and three timeframes (M5, H1, D1) but you can choose the periods and symbols you want to display from the menu.
If the indicator is blue, it indicates the beginning of an uptrend. If it is red, it indicates the beginning of a downtrend.
In capture # 3 (Daylight mode) I will explain each element

Description
Range Detector is an indicator that identifies ranges in the market and displays their presence on the price chart.
Recommendations
You can use this indicator to determine the flet and, accordingly, to determine the direction of opening a position or closing an opposite position.
Parameters
Maximum History Bars - maximum number of history bars for calculating the indicator. Average True Range Period - ATR indicator period (used to calculate the difference between mov

KT Renko Patterns scans the Renko chart brick by brick to find some famous chart patterns that are frequently used by traders across the various financial markets. Compared to the time-based charts, patterns based trading is easier and more evident on Renko charts due to their uncluttered appearance.
KT Renko Patterns features multiple Renko patterns, and many of these patterns are extensively explained in the book titled Profitable Trading with Renko Charts by Prashant Shah. A 100% automate

The automated trading system is developed based on the "Comfort Range" theory. According to this theory, the chart of each trading instrument has its own dynamically changing range of movement.
The skill of determining such a range allows you to use this information as a leading indicator and predict price movement in the near future.
The Rapture Expert Advisor determines the "Comfort Range" of the trading instrument and works in the direction of the expected future movement.
The EA does

WhipGold AI - Expert Advisor
Tthe famous gold trading expert, now available in Market MQL5!!! . This is one of the best EA for scalping in XAUUSD (Gold)
Characteristics
- This strategy works very well on Gold (You can do your own tests on other pairs but we recommend use it on XAUUSD) - It's very stable in trends or ranging , this is one of the weaknesses of almost all robots. If they work well in trends they are weak in range times; or if they work well in range they are weak in trend
First Signal Pro is a simple yet powerful tool that helps find the first pullback after the trend change. Entering into a trader on first pullback has low risk and provides higher risk:reward ratio. This is by-far one of the best trading strategies known in the market and used by many successful traders and fund managers. You can also customize this indicator and enable "All Signals" to trade the ranging market. This shows that First Signal Pro works in trending as well as non-trending markets.

Hello, >>>>> Download ** FREE TRIAL** from here (You can now perform forward test on DEMO account before Purchase) <<<<<< Discord group for updates and discussion here Telegram channel here Contact Directly here For Live Results of the EA please visit here .
PS Gold Miner is an automatic trading system for MT4 which uses markets fundamentals and trends to open, manage and close trades. With the use of advanced recovery strategy it ensure that it can recover from negative trades with hed

FXC iCorrelatioN MT4 Indicator (Specialized for DAX - Dow Jones)
The indicator shows the correlation soefficient between two assets. Correlations are useful because they can indicate a predictive relationship that can be exploited in practice. The correlation coefficient shows the relationship between the two symbols. When the correlation is near 1.0, the symbols are moving togerhet in the same direction. When the correlation is near -1.0, the symbols are moving in opposite direction. Important

Rainbow MT4 is a technical indicator based on Moving average with period 34 and very easy to use. When price crosses above MA and MA changes color to green, it’s a signal to buy. When price crosses below MA and MA changes color to red, it’s a signal to sell. The Expert advisor ( Rainbow EA MT4) based on Rainbow MT4 indicator, as you can see in the short video below is now available here .
FREE

Genaral: Not martingale, not a grid; Use on EURUSD Use on M5
Signals: There is a good rational algorithm. Work of two indicators: CCI and OsMA (from 2 timeframes) (you can set a separate Timeframe for each indicator)
Stop Loss/Take Profit: There is a good money management system (there are several type for trailing stop loss); There is virtual levels of Stop Loss / Take Profit; There is smart lot (percent by risk) or fix lot
Important: EA can work on closed candles, and on current can
FREE

This indicator calculates buy and sell signals by using MACD indicator on two timeframes. MACD is a trend-following showing the relationship between two moving averages of the closing price. The MACD is calculated by subtracting the 26-period Exponential Moving Average (EMA) from the 12-period EMA.The result of that calculation is the MACD line. A nine-day EMA of the MACD called the "signal line".
This indicator has 2 modes to calculate the buy/sell signals: - MACD crosses 0 line - MACD cro
FREE

Detailed article about the work of the advisor . The strategy is based on technical analysis. It is based on the technical signal divergence. Divergence is searched for using the MACD oscillator and the Price deviation MA indicator. The main feature is the consistency and stability of the strategy, which is confirmed by 20 years of history tests. Advantage: multicurrency. The Expert Advisor is suitable for any instrument, while launching 15-20 instruments and preferred timeframes on one chart at
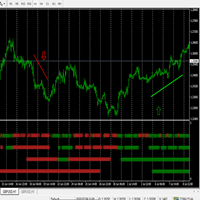
Hello This EA will open buy or sell orders depending on my (MTF) indicators. you can chooses 3 or 4 "Greens (Up) or Red (Down)" arrows. and a there a multi chooses in EA to make it more profit. you can find my (MTF indicators from this link) https://www.mql5.com/en/users/nebal you can buy any (MTF indicator) then put the indicator and EA on same chart and will open orders Please watch our video for more details about my (MTF indicators) https://youtu.be/MVzDbFYPw1M Good luck --------------------

Description : Rainbow EA MT4 is a simple Expert advisor based on Rainbow MT4 technical indicator witch is based on Moving average with period 34. The indicator is incorporated in the EA, thus, it is not required for the EA to operate, but, if you wish you can download it from my product page . The Expert Advisor settings are as follows : Suitable for Timeframes up to H1 The parameters below can be set according to your trading rules. StopLoss ( Stop Loss in pips) TakeProfit ( Take Profit in pip
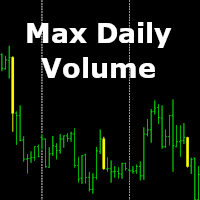
Do you want to trade like a pro? Buy where the professional buys and sell where the professional sells! Our indicator shows the most controversial and heated moment of the day! A moment of the day where a lot of money was loaded in the market and for this "Treasure" the further struggle will go!
And so, the indicator shows the bar in which there was the maximum struggle between the buyer and the seller for the past day, and it is this bar, or its extremes, or itself as a whole, becomes an imp
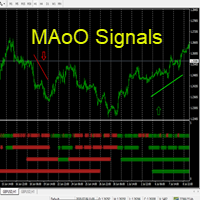
Hello This Indicator will draw Green (Up) and Red (Down) small arrows from Multi TimeFrames based in ( moving average of oscillator) to help you to take decision to buy or sell or waiting If there 4 green arrows in same vertical line that's mean (Up) and If there 4 Red arrows in same vertical line that's mean (Down) and the options contain (Alert and Mobile , Mail Notifications). Please watch our video for more details https://youtu.be/MVzDbFYPw1M and these is EA for it https://www.mql5.com/en/
The DYJ GlobalTradeGameTheory(ADX) is based on ADX indicator. It can be used for any currency pair and timeframe. The DYJ GlobalTradeGameTheory(ADX) recommends buying when +DI is higher than -DI, and selling when +DI sinks lower than -DI. It also uses Laguerre filtering false signals. We will now apply game theory strategy on the future of per currency instead of a price chart of history. This is one level higher. Dynamic Market game theory is a special feature of Advanced Currency Healt

The EA is based on MACD indicator. It also uses Stochastic and Laguerre filtering false signals. It can be used for any currency pair and timeframe. Signals to buy are generated if the MACD line crosses over the SIGNAL line in the negative area below the MACD open level, and when Stochastic has crossed InpStochOversold downwards, reached InpStochOversold and then crossed back up through InpStochOversold. Signals to sell are generated if the MACD line crosses under the SIGNAL line in the po
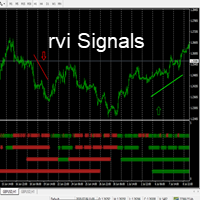
Hello This Indicator will draw Green (Up) and Red (Down) small arrows from Multi TimeFrames based in ( Relative Vigor Index ) to help you to take decision to buy or sell or waiting If there 4 green arrows in same vertical line that's mean (Up) and If there 4 Red arrows in same vertical line that's mean (Down) and the options contain (Alert and Mobile , Mail Notifications). Please watch our video for more details https://youtu.be/MVzDbFYPw1M and these is EA for it https://www.mql5.com/en/market/
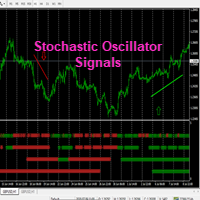
Hello This Indicator will draw Green (Up) and Red (Down) small arrows from Multi TimeFrames based in ( Stochastic oscillator ) to help you to take decision to buy or sell or waiting If there 4 green arrows in same vertical line that's mean (Up) and If there 4 Red arrows in same vertical line that's mean (Down) and the options contain (Alert and Mobile , Mail Notifications). Please watch our video for more details https://youtu.be/MVzDbFYPw1M and these is EA for it https://www.mql5.com/en/ma
The DYJ GlobalTradeGameTheory(WPR) is based on WPR indicator. It can be used for any currency pair and timeframe. The WPR recommends Indicator values ranging between 80 and 100% indicate that the market is oversold. Indicator values ranging between 0 and 20% indicate that the market is overbought. It also uses Laguerre filtering false signals. We will now apply game theory strategy on the future of per currency instead of a price chart of history. This is one level higher. Dynamic Market
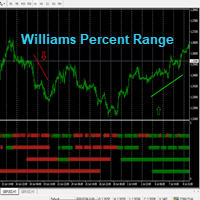
Hello This Indicator will draw Green (Up) and Red (Down) small arrows from Multi TimeFrames based in ( Williams Percent Range ) to help you to take decision to buy or sell or waiting If there 4 green arrows in same vertical line that's mean (Up) and If there 4 Red arrows in same vertical line that's mean (Down) and the options contain (Alert and Mobile , Mail Notifications). Please watch our video for more details https://youtu.be/MVzDbFYPw1M and these is EA for it https://www.mql5.com/e
MetaTraderマーケットはトレーダーのための自動売買ロボットやテクニカル指標を備えており、 ターミナルから直接利用することができます。
MQL5.community支払いシステムはMetaTraderサービス上のトランザクションのためにMQL5.comサイトに登録したすべてのユーザーに利用可能です。WebMoney、PayPal または銀行カードを使っての入金や出金が可能です。
取引の機会を逃しています。
- 無料取引アプリ
- 8千を超えるシグナルをコピー
- 金融ニュースで金融マーケットを探索
新規登録
ログイン