适用于MetaTrader 4的付费技术指标 - 88
149只剩下9份! 下一个价格199!
我们的MA-狙击手仪表板是活的!
在这里找到替代HA-Sniper仪表板[ https://www.mql5.com/en/market/product/85666 ]
任何新手或专家交易者的最佳解决方案! 再也不要错过任何一个动作!
对于喜欢简单和点的交易者,我们有一个特殊的产品给你。 简单的性质,仪表板做所有的工作看28货币对与我们的自定义移动平均算法。 只有一个图表,你可以像专业人士一样阅读市场。 想象一下,如果您能够精确定位任何外汇对的方向以及它何时开始移动,您的交易可以改善多少。
我们的系统是为了找到这些高概率信号并实时向用户发送警报。 没有滞后,没有虚假的承诺,我们坚持我们的话。 该系统是建立找到移动和提醒你的那一刻,他们出现!
为了保持图表的清洁,当你不需要它的时候,指示器可以隐藏起来,同时在后台工作,找到你的高概率移动。 只需按下按钮箭头按钮即可隐藏或显示仪表板。
MA-Sniper适用于从1分钟到每月的所有时间框架,让您可以在您选择交易的任何时间框架内快速发现趋势。
高概率信号

The indicator for determining key patterns for the BBMA strategy will perfectly complement the Fibo Musang strategy, and can also be used as an independent tool. IMPORTANT! Contact me immediately after purchase to receive the second file! If you have any questions, I will help you deal with the indicator. Designed to save market analysis time; Sends push notifications to the phone when key moments of the strategy have arisen (Extrem A, Csak, cross the BB line with a candle) Advantages Easy to u
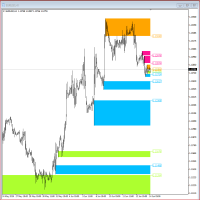
"Supply / Demand Zones"
The concepts of supply and demand zones are undoubtedly two of the most highly discussed attributes of technical analysis. Part of analysing chart of pattern , these terms are used by traders to refer to price levels i n charts that tend to act as barriers, preventing the price of an asset from getting pushed in a certain direction. At first, the explanation and idea behind identifying these levels seems easy, but as you'll find out, supply and demand zones can co

As per name Candles Talk, This Indicator is a affordable trading tool because with the help of Popular Developers & Support of M Q L Platform I have programmed this strategy. I tried to input history of candles with average Calculation regarding High, Low, Last High, Last Low with Moving averages. Furthermore, I have also taken help of Moving average So Trader can easily get in touch with market in another way also. What is in for Trader?
Arrows: Buy Sell Indications (Candles Hig
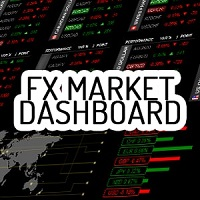
Fx Market Dashboard is a very innovative tool that features very professional graphics. Simplifying the reading of the market has always been our prerogative and we believe that with this tool everyone can better understand the market. This tool is mainly concerned with giving us a clear view of what are the strongest and weakest currencies, through this information we can begin to better understand where the market puts money or takes away money. The reading of the percentage logic serves to h
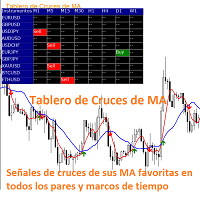
El indicador Tablero de Cruces de MA es un indicador que muestra los cruces de 2 medias móviles seleccionadas en el gráfico de precios indicando si se trata de un cruce alcista o bajista. Además, como su nombre lo indica, muestra un tablero de señales que indica en que mercado y marco de tiempo se produce un cruce de las dos medias móviles. En la ventana de configuración el usuario puede seleccionar los mercados y marcos de tiempo que puede visualizar en el tablero. También tiene la opción de ac
A ready-made trading system that shows with arrows when to buy and when to sell. The indicator does not redraw its arrows. Shows signals with 94% accuracy. Works on all currency pairs and all timeframes (recommended timeframes M5, M15, M30, H1). This is a ready-made trading system that trades according to the scalping strategy. The intraday indicator shows a large number of signals on the M5 and M15 timeframes.
How to trade with this indicator? When the red arrow appears, we need to look at t

MetaTrader indicator that detects WRBs (Wide Range Bodies/Bars) and Hidden Gaps.
WRB Hidden Gap MetaTrader indicator detects WRB and marks it. WRB can be either a Wide Range Bar (a very large bar) or a Wide Range Body (a candlestick that has a very long body). WRB alone do not provide much information so the indicator uses WRB to detect Hidden Gaps. The indicator also displays filled and unfilled Hidden Gaps in a different way, making it easier to view the market situation at a glance
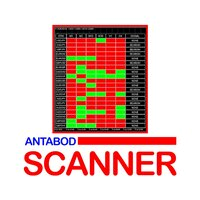
Antabod Scanner, Is a multi-timeframe scanner. It's a metatrader 4 indicator, which allows the detection of the trend of several pairs at a glance. I t will display on the platform any pair or pairs that all the timeframes, from the higher time frame to the lower timeframe, in the inputs, are all bullish or all bearish. When a pair is completely bullish, all the timeframes will be green, or when bearish all the timeframes will be red, and a sound will alert and a written alert will be displayed

The Pearson Trend!! My name is Murat Yazici. I have B.Sc. Statistics and M.Sc. Quantitative Methods degrees. I have several scientific papers, conference presentations in Texas, Toronto, London, Istanbul, books and book chapters studies, and many projects about mathematical and statistical modelling. I am also journal reviewer at some scientific journals.
What is The Pearson Trend's Logic? It is based on A Fuzzy Model developed by me. Vague or fuzzy data and application several fields,

Optimized for Asia- London- US- Open-Session the best Features from MOMENTUM-SOLO true Momentum - time-based Indicator it's based on a self-developed candle Pattern, in relation to the ATR
Filter
Daytime Weekdays Moving Averages Keltner-Channel
Advantages Optimized for Asia- London- US- Open-Session choose your personal times to trade - select Daytime and Weekdays Keltner-Channel => to reduce market noise - sideways movement will be hidden 3x Moving Averages => for the Trend Sig

Ready scalping system!
F1 Scalping for MT4 is a complete trading system that analyzes the market instead of you, shows you when you need to open orders and at what level to place TakeProfit and StopLoss in order to get a good result. This is a whole trading complex of tools, packed into one technical indicator. Also, this system can send signals to the trader on the phone. This greatly facilitates the trading process. You receive a signal on your phone, go to your PC and see where you need to

Welcome to Investment Castle products This product is exclusively available in the MQL5 market and is not available and will not be available anywehere else. The Combined indicator is a multi-time frame indicator and it is built using 3 indicators: Bands indicator which draws the support and resistance key levels using up to 5 different time frames Patterns indicator which draws the chart patterns using up to 6 different time frames Spots indicator which shows the common candlestick pattern

Night Crawler 是一种移动平均趋势交易策略,如果应用和交易得当,可提供超过 89% 至 90% 的胜率。 它适用于所有时间框架和在 MQL4 平台上交易的每个货币对。 明确市场趋势偏差 将 EMA 50 和 EMA 21 应用到您的聊天中,以充分利用该策略为您的整体趋势视图。 最好使用的 Timefarme 是 H1 或 H4 报名规则: 对于买入交易: 1. 等待 EMA 21 突破 50 2. 当箭头(蓝色)出现时,在蜡烛收盘后毫不犹豫地买入。 3. 将 SL 放在箭头下方。 4. 一旦价格向您有利的方向移动 20 点,将 Sl 移动到盈亏平衡点。 对于卖出交易: 1. 等待 EMA 21 跌破 50 2. 当箭头(红色)出现时,在蜡烛收盘后毫不犹豫地卖出。 3. 将 SL 放在箭头上方。 4. 一旦价格向您有利的方向移动 20 点,将 Sl 移动到盈亏平衡点。 为了您的成功...... Kmadu

66% discount only for the first 5 buyers (4 left), main price: 300 $
Show the signal as a line graph Prediction of 10 future candles and advanced display Prediction of individual candles graphically Can be used in the gold symbol Can be used in 15 minutes time frame Can be used only in gold symbol and only 15 minutes time frame
How the indicator works:
Using complex mathematical calculations, it predicts the future 10 candles. The predictions of this indicator are based on price. Ther
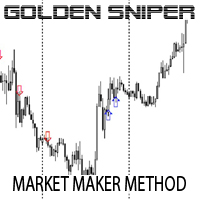
指标基于做市商策略。无需重新粉刷。 MM是交易员,他们的目标是赚钱。这包括与零售交易者进行交易的策略。他们与其他交易者之间的主要区别在于,他们有能力通过大量交易来随意调整价格。因此,为了赚钱,他们的目标是以较低的价格购买,然后以较高的价格出售。 他们通过以下方式实现这一目标: 1. 诱导交易者持仓。这是通过使用一系列价格变动来“诱骗”交易者在给定方向上建立头寸,然后再次反转来实现的。这意味着 MM 可以以特定价格卖出特定货币,然后在零售交易者因货币价值向后移动而感到痛苦并想要再次将其卖回时(例如通过止损)以较低的价格买回) 2. 制造恐慌和恐惧,诱使交易者情绪化和非理性思考。这通常涉及: ⋅ 快速移动 ⋅ 尖刺蜡烛 ⋅ 新闻稿 ⋅ “莫名其妙”的价格行为。 3. 击中止损并清除棋盘。这迫使交易者陷入“保证金问题”并最终退出游戏。 所有有关做市商方法的信息都在此指标下进行了简化。 如何使用: 根本没有输入。便于使用。您无需更改任何设置。所有算法都设置在屏幕后面。在 M30 时间范围内使用它。 入口: 在下一个蜡烛开盘时信号消失后进场 风险和资金管理: 始终从您的资本中承担最大 1-2%
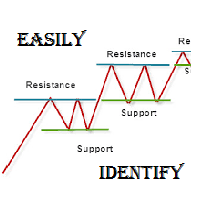
SUPPORT RESISTANCE
Function: Trader will find rejections, Movements & Easily understand to take positions Time Frames: 1 Hour, 4 Hours, Daily Types: Standard, Woodie, Fibonacci Font size & Name: Any Colours: Default black, Trader will find their own Finally this is very important to understand what is indicator. Indicator is just use for indicate not confirmation therefore, experienced traders always guide that do proper cash management & trade wisely. Good Day, Best of Luck :)
Beta Fort Trader 是一种移动平均趋势交易方法,根据给定说明使用时,可提供超过 75% 至 90% 的胜率。
使用的最佳时间框架是 H1 或 H4
它适用于所有时间框架和在 MQL4 平台上交易的每个货币对。 明确市场趋势偏差 将 EMA 50 和 EMA 21 应用到您的聊天中,以充分利用该策略为您的整体趋势视图。
交易说明:
对于卖出交易:
1. 留意 EMA 21 跌破 50 2. 当箭头(红色)出现时,在蜡烛收盘后卖出。 3. 将 SL 放在箭头上方。 4. 一旦价格向您有利的方向移动 30 点,移动 SL 以达到盈亏平衡。
对于买入交易:
1. 等待 EMA 21 突破 50 2. 当箭头(蓝色)出现时,蜡烛收盘后买入。 3. 将 SL 放在箭头下方。 4. 一旦价格向您有利的方向移动 30 点,移动 SL 以达到盈亏平衡。

What does this do? It shows you on the chart which stop belongs to which entry. Have you ever had multiple positions or trades open on a single pair and were confused which stop loss goes with what entry? Even worse, the stop loss orders for buy and sells are the same color on the chart. Well, your problem has been solved! This indicator will show you which stop belongs to which entry. It will place a vertical line and an arrow on the chart for each open trade. A yellow line connects the entry

This indicator tool provides mini charts, with adjustable symbol/tf that can be dragged and resized into place. Lightweight operation with multiple mini charts are supported.
Chart features: adjustable symbol and tf draggable resizeable multiple mini charts color styling and font sizing, foreground/background colors candle coloring candle styles; candles, bars, line, high-low channel
optional background color gradient predfined period separators on all tf's (eg 1hr/1day sep on 1Min, 4hr/1day

HFT Scalper Scanner 從多品種和多時間框架準確的技術指標掃描市場趨勢,並將其顯示在圖表上的可移動面板上。 交易者可以選擇多對他選擇的貨幣對進行顯示。
它是查看趨勢方向的絕佳工具,可用於手動交易或 EA 交易,僅允許根據趨勢買入或賣出訂單。 HFT Scalper Scanner 從多品種和多時間框架準確的技術指標掃描市場趨勢,並將其顯示在圖表上的可移動面板上。 交易者可以選擇多對他選擇的貨幣對進行顯示。
它是查看趨勢方向的絕佳工具,可用於手動交易或 EA 交易,僅允許根據趨勢買入或賣出訂單。 HFT Scalper Scanner 從多品種和多時間框架準確的技術指標掃描市場趨勢,並將其顯示在圖表上的可移動面板上。 交易者可以選擇多對他選擇的貨幣對進行顯示。
它是查看趨勢方向的絕佳工具,可用於手動交易或 EA 交易,僅允許根據趨勢買入或賣出訂單。 HFT Scalper Scanner 從多品種和多時間框架準確的技術指標掃描市場趨勢,並將其顯示在圖表上的可移動面板上。 交易者可以選擇多對他選擇的貨幣對進行顯示。
它是查看趨勢方向的絕佳工具,可用於手動交

BeST_Gann Swing Oscillator is an MT4 indicator that is based on the corresponding work of Robert Krausz who introduced it in the book “ A.W.D Gann Treasure Discovered ” .
The Gann Swing Oscillator is a range-bounding technical indicator that oscillates between +1 and -1 and thus it describes the market swings.
Generally when the market is in an upswing, the Gann Swing Oscillator describes it as 2 higher highs with the value of +1 while after an upswing, the downswing is expected.
Also the do
Trend Support Resistance is a fairly simple indicator that provides traders with confirmed immediate support and resistance in whatever timeframe you monitor. It's good for short-term and long-term order blocks. With the default settings, the indicator identifies critical support and resistance areas. Bearish Order Blocks are around the OrangeRed areas while Bullish Order Blocks almost always form near the LawnGreen areas. We have also added a Multi-timeframe feature that can be helpful to allow

Trender is a special TrendLine Indicator because it is combined with a NON-REPAINT Signal Settings: showBars = if showBars= 0 so the indicator will be shown for all the chart PointLevel = Point Levels; 2 = central bar will be higher (lower) then 2 bars on the left side and 2 bars on the right one. qSteps = number of steps/ no more than 3 BackStep = number of steps back startBar= if startBar=0 so we have recommendation for the current bar, if 1 - for possible next bar TrendLine= True = Trendli

This trend following system was designed by Dennis Gartman and Bill Eckhart , and relies on breakouts of historical highs and lows to take and close trades: it is the complete opposite to the "buy low and sell high" approach. This trend following system was taught to a group of average and normal individuals, and almost everyone turned into a profitable trader.
The main rule is "Trade an N-day breakout and take profits when an M-day high or low is breached (N must me above M)" . Example
Indicator Rua Alert Line. This indicator will notify when the High-price of candle breaks any TrendLine or HorizontalLine on the chart. Notifications will be sent to the phone and on MT4. And it have ArrowBuy/ArrowSell on chart. It is very useful for those of you who use the TrendLine or HorizontalLine but do not have time to observe the chart. RuaCoder Zalo_Tel: 033.818.8914 Telegram : https://t.me/Ruacoder
GO Universal Scanner is a simple scanner tool that can be used to scan any indicator on multiple symbols and timeframes. From now on, you don't have to ask anyone for a scanner of your favorite indicator, this scanner can do all the job for you.
You can also jump to the desired symbol and timeframe by simply clicking on the signal on the scanner dashboard. More than that, you the scanner can load your desired template on the newly opened chart. However, please note that, due to mt4 limitations

At the heart of any form of trading is the need to anticipate the direction the markets will go. To make this decision traders cannot afford to ignore trend analysis. Apply this before taking any trades otherwise you will loose. Market Trend Analysis is fundamental part of trading that's based on many indicators, patterns to predict future prices. The process of analysing each symbol can take weeks. This indicator saves the time of sitting and determining the direction of the markets. This indic
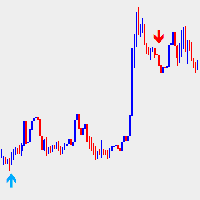
提到 股票 购买 / 销售 的 指示 信号 , 向上 和 向下 的 信号 向上 指示 股票 价格 的 上升 , 向下 指示 股票 价格 的 下跌。 股票 信号 指示器 生成 购买 / 销售 股票 向上 和 向下 的 警报 和 信号 , 以 指示 反转 或 继续 趋势 的 模式。 正如 其 名称 所示 , 此 指标 基于 生成 信号 , 更 有效 地 进行 交易 , 并 遵循 反 趋势 的 原则。 可以 手动 确定 和 调整 基本 信号。 良好 的 信号 使用 通过 警报 标志 显示 , 当 良好 的 标志 出现 时 , 会 生成 信号。 该 指标 适用 于 M5 和 M15 交易 指标 , 用于 寻找 交易 机会 , 适用 于 M30 、 H1 和 H4 交易 者。 仅 在 应用 良好 的 情况 下 , 使用 指标 进行 交易 , 并 考虑 反 趋势 交易 的 原则。 例如 : M5 和 M15 适用 于 寻找 交易 机会 的 交易 者 , 而 M30 、 H1 和 H4 适用 于 交易 者。 使用 方法 : 启用 警报 功能 (电子邮件 / 推送 通知 / 弹出 式 通知)。 接收

Waterstrider Band Waterstrider Band Indicator is a custom Indicator based on my experience in fx trade. This indicator also gives buy or sell signal when the condition are meet the open position rules. For Stop Loss you can put in the highest 3 previous candle + some pips (if SELL position) or put the lowest 3 previous candles + some pips (if BUY position).Trailing stop loss is good when the profit reach 20 pips. Do with your own risk, as we not guaranteed if any loss happen. Thanks H
Ever needed an instant 5 - 10 pips quickly? We have developed a powerful solution for you. Important - Read description below!
You can use InstaScalper as an entry tool on a smaller timeframe when you get higher timeframe signals here [ https://www.mql5.com/en/market/product/85710 ] or as a standalone tool!
Introducing InstaScalper Dash. A true algorithmic beast GUARANTEED to give you a few pips at ANY time of the trading day, even just before market close! Useful for both newbie and exper
This indicator changes all the open charts to one single currency pair. This is useful when scanning multiple timeframes for setups and when backtesting strategies across multiple currency pairs.
The image combines this indicator (Set Symbol For All Charts) with the ABHSyncScroller and a Currency Picker. IF you have this indicator and the ABHSyncScroller , send me a message and I will send you the Currency picker and a template for FREE.
Simply add the indicator to one open chart. All th

Indicator of peaks and direction of the trend Adapter Trend. Uses all one parameter for settings. When choosing a parameter, it is necessary to visually similarize so that there is a slight projection of the peaks on the corresponding graph. The indicator displays both entry points and the trend itself. Then confirm the signal with some oscillator, for example RSI. It also does not hurt to correct your actions, taking into account some kind of flat indicator.
Options:
Length - the number of

Smart indicator Smart trend allows you to find the most likely trend reversal points. You will not find this indicator anywhere else. A simple but effective system for determining the forex trend. From the screenshots you can see for yourself the accuracy of this tool. Works on all currency pairs, stocks, raw materials, cryptocurrencies. This is a trend indicator for the MetaTrader 4 trading platform.
The alert system (alert, email notifications) will help you monitor several trading instrume

The Recommendation Trend indicator reflects price fluctuations, which already contain all the information about the market. For many traders, this postulate is a reasonable justification not to use fundamental analysis when working in the stock market, focusing only on what is happening on the chart, but using this indicator you will not regret the tips. The indicator shows favorable moments for entering the market. The intelligent algorithm of the indicator determines the trend, filters out mar

The Trend Live indicator is a development for trend trading. Trend indicators make it possible to classify the direction of price movement by determining its strength. Solving this problem helps investors enter the market on time and get a good return. The Trend Live indicator helps to analyze the market on the selected time interval. They define the mainstream. Easy to set up and works on all pairs and all time frames. Trend Live is a trend trading and filtering solution with all the important
M1 箭頭倒賣 - 顯示 M1 週期的信號,不重新繪製入場點,並且適用於所有主要貨幣對 + 金屬(黃金/白銀)。該指標使用確定價格模式的算法分析市場,並向交易者顯示圖表上的價格反轉點。紅點表示價格會下跌,藍點表示價格會上漲。該指示器還以 PUSH 通知的形式向手機發送信號。因此,您無需一天 24 小時都坐在 PC 附近。您可以開展業務,但當出現價格反轉時刻時,指標會在您的手機上向您發送通知。您不會在 Internet 上免費找到這樣的指標。指標信號在不同貨幣對上的準確率從 71% - 94%。該指標適用於 M1 週期,但如果您在 H1 和 H4 等大周期進行交易,該指標也會很好地顯示它們的信號。
指標的好處: 取決於貨幣對的信號准確度從 71 - 94% 不重繪其信號 適合在 M1 期間剝頭皮 可以確定所有主要貨幣對的價格反轉點 通過電話向交易者發送信號 如何使用該指標進行交易: 當指標畫出紅點時,價格下跌的可能性為 71 - 94% 。 當指標在圖表上畫一個藍點時,價格有 71 - 94% 的機會上漲。 指標設置: Gap - 從價格點到點的距離。在這裡,您可以設置指標在離

Acceleration Force Meter Indicator - is a trend system that join market in trend phase and after trend pull-back. AFM indicator - is the system that watchs market phases from flat to extreme volatility and prefers to enter in market when it's active, more volatility, ignoring most flat places. This is 100% complete trading system including enter and exit points. It works well with profitable trades - maximizing take profit targets(analysis of recent market volatility, its pips range to adapt cur

Market Chopper Indicator - is the manual system for market scalping. Indicator uses most accurate points to enter, when current trend has lost it's power and new one starts. Indicator shows : Enter points(buy/sell arrows), Exit points(Stoploss/Takeprofit arrows). Indicator makes market analysis and adapts to any market, any timeframe showing most relevant strategy for exact conditions. Main Indicator's Features Signals are NOT repaint, late or disappear; Every signal comes at the open of new bar

ImbaTrend Runner - is the trend following manual system for forex/crypto market. It defines medium-term trends and works with it in intraday mode. System shows enter points, profit and loss targets. As a rule profit targets are 2-3 X bigger than loss targets. Indicator is AutoAdaptive and it automatically updates it's settings during trading. Indicator is sensitive to market changes, regular updates helps to stay in relevant trend. Main Indicator's Features Signals are not repaint, late or disap
波动率分析仪是一种动量指标,它利用价格在狭窄交易区间盘整后强劲突破的趋势。该指标还使用动量振荡器来显示挤压触发时的预期移动方向。该直方图在零线附近震荡,零线上方的动量增加表明有机会买入多头,而动量低于零线则表明有做空机会。
限时优惠:该指标仅适用于 50 美元和终身。 (原价 125 美元) 主要特征 横向趋势检测器。 低挥发性检测器。 看涨高位和看跌高波动率检测器。 使用所有时间框架和所有货币对。 提供弹出警报和推送通知警报。
接触 如果您有任何问题或需要帮助,请通过私信与我联系。
警告 我们所有的指标和工具都只能通过官方 Metatrader 商店 (MQL5 市场) 获得。
溢价指标 通过访问我们的 MQL5 配置文件,您可以找到我们所有的免费和高级指标。要访问我们的个人资料, 请单击此处。
作者 SAYADI ACHREF,金融科技软件工程师,Finansya Lab 创始人。

Early WPR divergence - is the manual system to define trend reverse. Green histogram shows main trend, Orange one - shows "short"/local trend. System is looking for clear divergence between both trends and pick up position(plot buy/sell arrows). When main trend is up, but local trend reverses to bearish trend and get's big power - sell arrow is plotted; When main trend is down, but local trend reverses to bullish trend and get's big power - buy arrow is plotted; Main inputs are : mediumTrend

Trend Gain Oscillator - is the manual system for defining trend phase(bullish/bearish). When histogramm is pink - market is up/bullish and when histogramm is blue - market is down/bearish. Arrows is plotted on zero cross, in case if additionally market has power for future movement. Main inputs are : trendPeriod- main indicator's period for trend calculation; trendPowerPeriod - period for market's power(volatility+volume) calculation ; trendPowerTrigger - arrows is not plotted if market's power

24 Hours BO is designed for trading manually on brokers like iq option,alpari,pocket option,quotex,olymp trade,binomo etc.
The indicator allows you to trade binary options. The recommended timeframe is М5 and the expiration time is 5-15 minutes. The indicator works on any currency pairs. Arrows are not re-painted and appear only when a new candle appears! Trade sessions: any (24 hours); Currency pairs: any. Working timeframe: M5; Expiration time: 5-15 minutes. Entry Type - INTRBAR

Bull bear pressure indicator - is the manual system which defines bull/bear market. When lines is above zero level - market is strong bullish, and when lines below zero level - market is bearish. First line represents global trend and second one are smoothed and shows local market's mood. Main inputs are : MainPeriod- main indicator's period for global trend calculation; SignalPeriod - period for smoothed and shows local market's trend; Main Indicator's Features Signals are not repaint,non-la

StarSwing è un indicatore NO REPAINT che unisce in un unico strumento oscillatori e indicatori di forza. I parametri esterni permettono di bilanciare il peso delle componenti e di regolare a proprio piacimento l'indicatore stesso. StarSwing, graficamente, è composto da segmenti di 2 colori: uno rappresentante il rialzo e uno il ribasso. Il colore non dipende dalla pura direzione del segmento ma dal trend di fondo calcolato dall'indicatore stesso. Sul grafico, si può far disegnare una media mobi

ROC acceleration-deceleration is the manual system for medium-term scalping. Indicator based on custom ROC system which defines bullish/bearish market and especially acceleration-deceleration of tendention in the market's main direction. Buy arrow is plotted during bearish market when current trend decelerates and sell arrow is plotted during bullish market when current trend decelerates. Main Indicator's Features Signals are not repaint,non-late or disappear(exept cases when system recalculat

ArchIntel Strength meter is different from the conventional strength meter. It displays correlation index for currency pair and individual currencies, see image 4 and image 6 for the currency pair correlation index and currency strength index. This strength meter displays correlated pair. EURJPY is used to explain the formula, EURUSD and USDJPY must be going up before I can buy (Long ) EURJPY , vice-versa is for sell. When any of the currency pair is correlated using this formular the the rectan

ASI fractals with DPO filter - is the manual trend-following system. ASI fractals are the base of every trend. System plots an arrow when fractal pattern appears on ASI indcator and DPO direction is same as incomming signal. System has several ways of usage : simply indicator, indicator with suggested arrows, arrows with single targets and arrows with common profit targets. User can simply switch indicator's modes directly from chart. Main Indicator's Features Signals are not repaint,non-late or

Asterysc SL & TP Values Info, is an indicator which will allow you to see on the chart in a visual way the potential profit/loss you could have if your trade touches TP or SL.
It will also allow you to see the total accumulated TP/SL of all open trades in a very simple way on each chart.
You will also be able to quickly visualize the current Drawdown of your account.
*The indicator is customizable, so you can change the colors, size and fonts of each section.

Trend reversal index - is the manual trading system that works with overbought , oversold levels and reversal patterns. Sell arrow is plotted when indicator is higher than overbought level and here forms reversal pattern, all pattern points located higher than overbought level. Opposite with buy arrow : ndicator is lower than oversold level and here forms reversal pattern, all pattern points located lower than overbought level. Main Indicator's Features Signals are not repaint, late or disapp

Use with disciplined risk management. Fibonacci entry system based on the golden zone 38.2 - 61.8 where the entry is confirmed at 23.6 with indications of Take Profit 3:1. Automatically plotted Fibonacci contains retracement and expansion Fibonacci in a single indicator. Up to 77% win rate with this system. FTMO challenge pass with 0.50% risk and 1.50% R:R.

StarBounce è un indicatore NO REPAINT che sfrutta i livelli importanti dei timeframe superiori. StarBounce disegna i livelli di Apertura, Chiusura, Massimo e Minimo delle candele di uno specifico timeframe e su questi livelli cerca dei re-test. Si cercano candele con corpo sopra/sotto un livello e minimo/massimo oltre il medesimo livello. Si possono filtrare le candele segnale con diversi filtri selezionabili, attivabili, disattivabili con variabili esterne. Number of trending candles: permette

Dema divergence points - is the manual trading system based on double exponental moving divergence. Histogram represents 4 colors : yellow - strong up trend, orange - up movement, blue - down movement and aqua - strong down trend. Up arrow is poltted when dema crosses current price up - but phase is still strong down (aqua color), down arrow is poltted when dema crosses current price down - but phase is still strong up (yellow color). Main inputs : mainPeriod - main dema calculation period; f

Demarker pullback system - is the manual trading system for choppy markets. It show 2 colored histogram. When histogram is blue - market is quite bullish, when histogram ir orange - market is more bearish. Up arrow is plotted when histogram is in oversold zone but blue color. Down arrow is plotted when histogram is in overbought zone but orange color. These patterns shows false breakout and possible soon reverse(price is overbought but shows bearish signs and price is oversold but shows bullis
Super Signal Buy And Sell Indicator
Pairs - XAUUSD - XAGUSD - Oil - BTCUSD - EURUSD - GBPUSD - USDJPY - AUDUSD - GBPJPY .... etc TimeFrame - 15Mins - 30Mins - 1Hour - 4Hour - 1Day - 1Week - 1Month
Setting : - Once Show On Green Arrow And Next Engulfing For Candle You Can Place The Buy Order Once Show For Red Arrow And Next Engulfing For Candle You Can Place The Sell Order Otherwise Please Wait For Conformation Push Notification Alert

訂閱指標注意事項 此信號只支援電腦版MT4 不支援MT5、手機、平板 指標只顯示當日進場箭頭 非直播指標顯示歷史箭頭 (直播為展示用) 指標為交易輔助性質 非EA自動交易 無跟單功能
指標只標示進場位置 無出場(止盈)指示
進場止損點位設定30-50 PIPS 或是前高前低做為防守 止損不需拉太遠
紅色箭頭為多方進場訊號 綠色箭頭為空方進場訊號 撐阻力強度用箭頭大小表示 此指標適用於波段策略 不適合當沖策略盤整 多空反轉時不適用
指標載入後 右下角都會預設顯示盤整 載入指標一小時後 才會顯示多空
加入Youtube頻道會員 可參加每個月一次實體抽獎活動(台灣以外地區,獎品折現金用Paypal匯出) 每月抽獎時間為非農數據公布當週的週末盤勢分析(2100) 得獎者必須抽獎時在線上,逾期不候

The Magic MA Moving Average Indicator is a market analysis tool that has more than 30 types of moving averages that the trader can use to gauge the market trend.
Among the types of moving averages that the trader can visualize are the most common MAs (SMA, EMA and SMMA), adaptive moving averages such as FRAMA and KAMA and other MAs based on innovative calculation and analysis methods such as LSMA, ZLEMA and others.
The indicator is designed to display all these moving averages on a single c
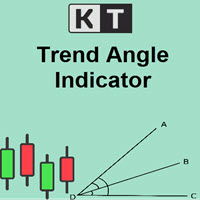
The KT Trend Angle helps to identify ranging and trending markets. The idea is to only enter a trade following the market trend if the slope is steep enough.
An angle is the ratio of the number of bars to the number of points: The bars mean the time offered by standard (M1, M5, etc.) and non-standard time frames. Points represent the unit of price measurement with an accuracy of 4 or 5 decimal places.
Input Parameters Period: An integer value to define the intensity of angled trendlines. A

KT Forex Blau Balance combines elements of momentum and volatility. It helps you identify entry and exit points.
Blau Balance consists of two moving averages (a slow-moving average and a fast-moving average) intersecting key transition points in market price. The indicator turns green or red when one is above or below the other, signaling to buy or sell trade signals.
It can be used in currency pairs and other markets that your MT4 or MT5 platform supports. Both short-term and long-term tra

Levels indicator. It works on a neural network and is formalized according to professional rules for building horizontal levels. The indicator redraws the levels every day and notifies you when the price approaches or cross the levels. The indicator is suitable for both professionals and beginners who have only recently begun to learn how to trade in the market. PrimeTools is a series of products designed for correct and professional trading. [PrimeTools Levels | PrimeTools Range ]
Panel Show
Zig Zag Multi Time Frame Indicator counts in how many consecutive candlesticks the current Zig Zag "lit" on the different Time Frames. It can be used for both trend signal strategies and range breakout strategies. Shows simultaneously on all Frames in how many candles we have had Zig Zag value in the current swing. The Zig Zag period can be adjusted in the Indicator settings.
The KT De Munyuk is a trend-based indicator that uses Parabolic SAR to identify the market direction. The indicator shows the PSAR in the form of green/red dots using a separate window. Buy Signal: When a green dot appears after a series of at least three red dots. Buy Exit: When a red dot appears on the current or next higher time frame. Sell Signal: When a red dot appears after a series of at least three green dots. Sell Exit: When a green dot appears on the current or next higher

In MetaTrader, plotting multiple horizontal lines and then tracking their respective price levels can be a hassle. This indicator automatically plots multiple horizontal lines at equal intervals for setting price alerts, plotting support and resistance levels, and other manual purposes. This indicator is suitable for Forex traders who are new and looking for chances to make quick profits from buying and selling. Horizontal lines can help traders find possible areas to start trading when the

KT XMaster Formula is a buy & sell signal indicator that works magically on most of the timeframes and currency pairs when used correctly.
The indicator uses calculations based on moving averages, RSI, and MACD. It is usually appropriate for scalping and trend trading - whether you are a novice or an experienced trader, the signals generated by this indicator are simple to understand and implement.
Overview The indicator comprises green and red dots arranged in wavy lines. These dots corre

KT Forex Trend Rider uses a trend following algorithm developed specifically for the Forex market to provide reliable buy & sell signals across the major currency pairs. It works best on major FX pairs and all time-frames.
Features
It comes with a Multi-Timeframe scanner that can search for upcoming signals across all the time-frames. It comes with four preset profiles to facilitate trading for scalpers, tick-trend, swing, and trend traders. It marks the potential reversal points in the mark

The BSI stands for Bar Strength Index. It evaluates price data using a unique calculation. It displays readings in a separate window. Many financial investors mistake this indicator for the Relative Strength Index (RSI), which is incorrect because the BSI can provide an advantage through its calculation method that the RSI indicator does not. The Bar Strength Index (BSI) is derived from the Internal Bar Strength (IBS), which has been successfully applied to many financial assets such as commodit

The KT Tether Line is a trend-following tool consisting of three indicators that work together to generate trading signals. It can correctly identify market trends while signaling trade entries. It was first introduced by Bryan Strain in the Stock & Commodities magazine in 2000 in "How to get with the trend and out at the end."
The Concept
When a market trend is confirmed, the most challenging part is determining the timing of the entries. This indicator alerts you to potential trend reversal

Wicks UpDown Target
Choppy movement up and down on the opening range every day. Trading breakouts on London session and New York session is recommended. Wicks UpDown Target is specialized in all forex pairs.
Guideline Entry Strategy Idea:
Step 1 - Breakout Forming (Warning! Trade on London Session and New York Session) Step 2 - Breakout Starting (Take Action on your trading plan) Step 3 - Partial Close your order & set breakeven (no-risk) Step 4 - Target complete Step 5 - Don't trade in
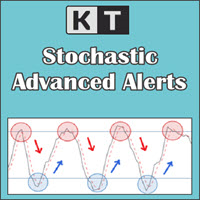
KT Stochastic Alerts is a personal implementation of the Stochastic oscillator that provide signals and alerts based on six custom events: Bullish Crossover: When Stochastic main line cross above the signal line. Bearish Crossover: When Stochastic main line cross below the signal line. When Stochastic enter in an overbought zone. When Stochastic exit from an overbought zone. When Stochastic enter in an oversold zone. When Stochastic exit from an oversold zone.
Features
A perfect choice for
MetaTrader市场是一个简单方便的网站,在这里开发者可以出售自己的交易应用程序。
我们将帮助您发布您的产品,并向您解释如何为市场准备您的产品描述。市场上所有的应用程序都是加密保护并且只能在买家的电脑上运行。非法拷贝是不可能的。
您错过了交易机会:
- 免费交易应用程序
- 8,000+信号可供复制
- 探索金融市场的经济新闻
注册
登录