适用于MetaTrader 4的付费技术指标 - 5

OVERVIEW
A Lorentzian Distance Classifier (LDC) is a Machine Learning classification algorithm capable of categorizing historical data from a multi-dimensional feature space. This indicator demonstrates how Lorentzian Classification can also be used to predict the direction of future price movements when used as the distance metric for a novel implementation of an Approximate Nearest Neighbors (ANN) algorithm. This indicator provide signal as buffer, so very easy for create EA from this in

玛莉指标:MT4 中的精确交易 使用玛莉指标提升您的交易,该指标专为MT4和MT5中的卓越信号精确度设计。这一多功能工具针对加密货币和外汇市场进行了优化,为您的交易策略提供精确性和灵活性。 无缝集成至MT5:对于MT5平台用户,玛莉指标完全兼容且可在 此处 访问。 针对加密货币和外汇市场的优化: 加密货币卓越性 :玛莉指标专为动态的加密货币市场量身定制,提供精确及时的信号,对于导航加密货币交易至关重要。 外汇友好默认设置 :其设置同样适用于外汇市场,确保在不同的市场条件下具有多功能性和可靠性。 主要特点: 灵活的显示选项 :选择您偏好的信号显示方法——视觉冲击力强的箭头或信息丰富的文本标签。 可调敏感度 :微调敏感度,实现信号响应性和准确性之间的平衡。 高级ATR周期自定义 :调整ATR周期,以迅速适应波动的市场条件,增强您的分析。 基于平均趋势指示的信号 :通过基于平均趋势指示蜡烛的信号,探索市场趋势,提供独特的市场视角。 信号设计和提醒: 可定制视觉效果 :个性化信号大小和颜色,以获得清晰的视觉提示。调整文本标签颜色以提高可读性。 实时提醒 :配置提醒以保持最新状态。选择MT4弹

该仪表盘显示所选符号的最新可用谐波形态,因此您可以节省时间并提高效率 / MT5 版本 。
免费指标: Basic Harmonic Pattern
指标列 Symbol: 显示所选符号 Trend: 看涨或看跌 Pattern: 形态类型(Gartley、蝴蝶、蝙蝠、螃蟹、鲨鱼、Cypher 或 ABCD) Entry: 入口价格 SL: 止损价 TP1: 第一止盈价 TP2: 第二次获利价格 TP3: 第三次获利价格 Current price: 当前价格 Age (in bars): 最后绘制的模式的年龄
主要输入 Symbols : 从 "28 种主要货币对 "或 "选定符号 "中选择。 Selected Symbols : 希望监控的符号,用逗号分隔("EURUSD,GBPUSD,XAUUSD")。如果您的经纪商为货币对设置了后缀或前缀,您必须在以下两个参数中添加(货币对前缀或货币对后缀)。 Max Iteration: 调整模式的最大迭代次数(如果该值越小,则模式越少,性能越快;如果该值越大,则模式越多,性能越慢)。事实上,它的工作原理如下:如

Pipfinite creates unique, high quality and affordable trading tools. Our tools may or may not work for you, so we strongly suggest to try the Demo Version for MT4 first. Please test the indicator prior to purchasing to determine if it works for you. We want your good reviews, so hurry up and test it for free...we hope you will find it useful.
Combo Energy Beam with Swing Control Strategy: Confirm swing pullback signals Watch Video: (Click Here) Energy Beam with Trend Laser Strategy: Confirm Tr

Metatrader 4 的这个指标识别价格和振荡器/指标之间何时出现背离。它识别看涨和看跌背离。它有一个 RSI 过滤器选项,可以只过滤掉最强的设置。该指标还提供了等待 Donchian 通道突破或价格穿过移动平均线(见屏幕截图 3)以在发出交易机会之前确认背离的选项。结合您自己的规则和技术,该指标将允许您创建(或增强)您自己的强大系统。 特征
在结束时 产品的博客 您将能够下载使用 iCustom() 函数从指标中检索交易信号的示例智能交易系统 (EA) 的源代码。尽管 EA 功能齐全,但主要目的是使用代码并将其粘贴到您自己开发的 EA 中。 摹 伊芬我有限的时间 不过,我将无法提供任何编程支持。 我很抱歉 。
可以检测以下振荡器/指标的背离:MACD、OsMA、随机指标、RSI、CCI、RVI、Awesome、ADX、综合指数、ATR、OBV、MFI 和动量。只能选择一个振荡器/指示器。 为常规/经典(潜在逆转)背离绘制实线,为隐藏(趋势延续)背离绘制虚线。线条绘制在图表和指标窗口中。 当检测到背离或突破/交叉时发送警报。支持所有 Metatrade

Pipfinite creates unique, high quality and affordable trading tools. Our tools may or may not work for you, so we strongly suggest to try the Demo Version for MT4 first. Please test the indicator prior to purchasing to determine if it works for you. We want your good reviews, so hurry up and test it for free...we hope you will find it useful.
Combo Razor Scalper with Trend Laser Strategy: Scalp in the direction of the trend Watch Video: (Click Here)
Features Scalping indicator using a confir
SL Curruncy impulse https://www.mql5.com/en/market/product/82593 SL Session Strength 28 Pair flow of this intraday Asian London New York Sessions strength.SL Session Strength 28 indicator best for intraday scalper. market powerful move time you can catch best symbol. because you'll know which currencies are best to trade at that moment. Buy strong currencies and sell weak currencies (Diverging currencies). Suggested timeframes to trading : M5 - M15 - M30 - You can however just change session

多时间框架锯齿形调整浪指标。 它显示支撑/阻力水平线及其突破,并绘制当前的市场目标。 它还可以显示分形指标的线条和其他时期(最多季度)的蜡烛。
该指标重新绘制最后一个(当前)点,并且在某些情况下可以更改最后 2-3 个点。
所有线条均绘制为对象(不是指标缓冲区,但有可能接收 EA 的数据)。 在 Expert Advisor 中使用时,您可以使用 iCustom 读取 ZigZag 点。
设置 Mode — 根据以下因素绘制支撑位和阻力位: — Zig Zag — ZigZag 指标; — ZigZag Close — 之字折线收盘指标; — Fractals — 分形指标; — High-Low of the period — 通过高低水平构建指标。 时间范围在Period参数中指定; — Candles only — 仅绘制蜡烛; Depth — 如果最后一根蜡烛的偏差小于(或大于)前一根,则 Zigzag 将不会绘制第二个最大值(或最小值)的烛台的最小数量; Deviation — 锯齿形形成局部顶部/底部的两个相邻烛台的最高点/最低点之间的最小点数; B

ICT Silver Bullet
If you are searching for a reliable indicator to trade the ICT Silver Bullet concept, or ICT concepts, Smart Money Concepts, or SMC, this indicator will respond to your need! This indicator will help you identify the following: FVG - fair value gaps Market structure: BOS and CHOCH. It is based on ZIGZAG as it is the most subjective way to do it. ICT Silver Bullet windows and related notifications when it starts and when an FVG appears Swing High and low that are potential b

What is the Volume Weighted Average Price (VWAP)? The volume weighted average price (VWAP) is a trading benchmark used by traders that gives the average price an instrument has traded at throughout the day, based on both volume and price. It is important because it provides traders with insight into both the trend and value of the instrument.
What is the Difference between VWAP and AVWAP? While VWAP is having as starting point the beggining of the day,week,month etc. in the AVWAP you can pla

指标在图表上找到脉搏波。 分析分形通道的击穿并建立脉冲电平。 此外,它还发现了所谓的虚假突破和流动性捕获的地方。 在设置中,您可以启用多币种仪表板并选择任何工具和时间表。 通知在当前计划或整个列表之间进行选择。 有单独的脉冲和假击穿信号。 Blog-Link - Retest and Fake Breakout with UPD1 。
交易模式: +按趋势重新测试 。 +假故障 。 +其他 。
EURUSD, GBPUSD, XAUUSD, ... M15, M30, H1 。
输入参数 。
主要的 。 Bars Count – 指示器的显示条数 。 Coeff Period – 蜡烛的数量来计算平均波浪大小。 Coeff - 无后坐力波的大小的系数,我们将考虑脉冲 。
图标视觉 。 Impulse End Arow – 显示波结束图标波结束图标 。 Impulse End Arow Code – 代码(Wingdings字体) 。 Impulse End Arow Indent Coeff – 压痕系数 。 Impulse End Arow Size -

Price pivot point indicator. The indicator shows with points on the chart the places where the price can turn in the opposite direction. When the indicator draws a red dot, it means that the price can turn its movement down. When the indicator draws a blue dot, then the price can turn its move up. This indicator can be used for both manual trading and automated trading by integrating it into your robot. To do this, the indicator has data exchange buffers.
Recommended currency pairs: XAUUSD EU

indicator is no repaint trend indicator. when red stars up to line that is probably end of long trades. when blue stars up to line that is probably end of down trades. indicator can use all pairs and lower than weekly charts, to use weekly chart need to at least 500 bars data on back.and lowering processing value 500. it is also suitable for 1m charts. indicator hold long way to go. there is not too many signals.
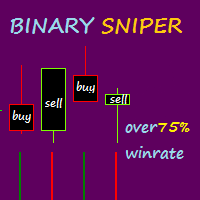
Binary Sniper 是一个 mt4 指标,为二元期权交易提供买入和卖出信号,该指标有不同的方法, 对于二元期权交易,该指标不会重新绘制或延迟信号。 参赛规则: 1. 看涨(买入),当红色蜡烛收盘时,二进制狙击条颜色在红色后变为绿色。(第一次颜色翻转) 2. 卖出(卖出),当绿色蜡烛收盘时,二进制狙击条颜色在绿色后变为红色(第一次颜色翻转)。 该指标适用于价格行为/交易量和蜡烛形态,因此设置受到限制。 ==========================================================================================================

介绍 ON Trade Waves Patterns Harmonic Elliot Wolfe,这是一款高级指标,旨在使用手动和自动方法检测各种市场模式。以下是它的工作原理: 谐波模式: 该指标可以识别出现在您图表上的谐波模式。这些模式对于练习谐波交易理论的交易者非常重要,正如Scott Carney的书《谐波交易第1卷和第2卷》所描述的那样。无论您是手动绘制它们还是依赖自动检测,ON Trade Waves Patterns都可以胜任。 控制面板: 我们配备了一个用户友好的控制面板,它会保存您的图表和时间帧设置,使您可以轻松切换不同配置。您甚至可以最小化它以最大化图表空间。如果您更喜欢使用其他分析工具,只需单击关闭按钮即可隐藏所有指标数据。 模板保存: 当您自定义设置或添加其他指标,如移动平均线或布林带时,该指标会自动保存您的模板。这意味着您可以随时轻松加载您喜欢的设置。 优化显示: 对于Windows 10用户,我们建议调整您的DPI设置以获得高清设备上的最佳屏幕体验。右键单击MetaTrader图标,选择“兼容性”,然后选择“更改高DPI设置”,将其设置为“系统(增强)”。

Use of support and resistance in systematic trading is very subjective. Every trader has their own idea and way to plotting the support and resistance levels on the chart. KT Support and Resistance indicator take out this ambiguity out of the situation and automatically draws support and resistance levels following an algorithmic approach using a unique multi-timeframe analysis.
When launched on the chart, It immediately scan the most significant extreme points across all the available timefr

Dark Absolute Trend is an Indicator for intraday trading. This Indicator is based on Trend Following strategy but use also candlestick patterns and Volatility. We can enter in good price with this Indicator, in order to follow the main trend on the current instrument. It is advised to use low spread ECN brokers. This Indicator does Not repaint and N ot lag . Recommended timeframes are M5, M15 and H1. Recommended working pairs: All. I nstallation and Update Guide - Troubleshooting guide

LordAutoTrendLine 是 MetaTrader 的一個指標,其開發目的是分析金融市場的上漲和下跌趨勢線。
例如,趨勢線與斐波那契一起計算貨幣對的最高點和最低點。
在H4影像的範例中,我們可以看到一條線穿過1790高點和1784低點,例如,如果跌破1784將意味著賣出,並且非常肯定根據該線,它可以毫不費力地首先到達1790,即, 購買。
在第二張 H1 影像中,同樣的情況,即 1790 高點和 1782 低點,遵循上述範例。
LordAutoTrendLine 指標也會在圖形面板上向您顯示訊息,例如貨幣對的最大值和最小值、點差、上升和下降趨勢的通道、之前可以達到的每日頂部或下降最大值的分析(最大值)或貨幣對當天可能達到的最低值)。
用愛和關懷製造<3。
加入 Telegram 群組: https://t.me/expertfxschool

Moving Average Trend Scanner is a multi symbol multi timeframe triple MA crossover dashboard that helps traders to monitor, and identify potential market trends from one chart. This panel scans 3 moving averages in up to 28 configurable instruments and 9 timeframes for triple moving average alignment and moving average crossover with a deep scan feature to scan all market watch symbols (up to 1000 instruments!).
Download Demo here (Scans only M1 and M5) Settings description here MT5 version
Introducing Sterling Blaster V1.0: Specifically engineered for the unique nature of GBPUSD, delivering a remarkable around 99% success rate and an excellent way to achieve prop firm challenges. USE 5MIN TIMEFRAME Sterling Blaster Features: Optimal for GBPUSD : Tailored to deliver outstanding performance on GBPUSD. Exceptional Success Rate : Achieves a remarkable around 99% success rate based on extensive backtesting. Thoroughly Backtested : Verified through years of historical data. Risk Managem

NOTE: PRICE WILL RISE VERY SOON. DON'T SKIP THIS OFFER! Dear traders I am glad to introduce the " Market Swing Scanner Board" indicator to you. This indicator was made mainly to be used in combination with the Market Swing Index Indicator. You use the "Market Swing Scanner Board" indicator to scan for trading opportunities on the Market Swing Index Indicator . This tool is designed for serious traders who have decided to make a difference through trading. Be the next person to witness this st

This scanner shows the trend values of the well known indicator SuperTrend for up to 30 instruments and 8 time frames. You can get alerts via MT4, Email and Push-Notification as soon as the direction of the trend changes.
Important Information How you can maximize the potential of the scanner, please read here: www.mql5.com/en/blogs/post/718074
You have many possibilities to use the scanner. Here are two examples: With this scanner you can trade a top-down approach easily. If two higher time

VR Sync Charts 是用于在窗口之间标记同步的实用程序。 使用VR Sync Charts,您的趋势水平、横水平、斐波那契折返将与所有图表同步。 该实用程序允许同步MetaTrader终端中的所有标准图形对象,您的所有趋势、江恩线和其他对象都将被准确复制到相邻图表。 您不再需要手动复制您的划线和标记。在下面的图片和视频中,您可以查看和评定VR Sync Charts实用程序的工作。 建议: 在所有图表上指定指标。 在终端设置中设置为通过双击选择一个对象。 对该程序无法在策略测试器中进行测试,请看下面的视频。 有点 同步任何图形对象 将图表与任何时间范围同步 所有更新都是免费的 适合初学者和专业交易者 设置数量不大,有助于有选择地做同步 适用于任何金融工具(Forex, CFD, Crypto, Metalls, Futures) 易于安装和配置,该程序带有文本和视频说明 版本: MetaTrader 5 博客上的更多信息 跳转 您的反馈是最好的感谢! 留下评价。 技术支持、设置、set文件、试用期可以在 聊天群

** All Symbols x All Timeframes scan just by pressing scanner button ** *** Contact me after the purchase to send you instructions and add you in "Trend Reversal group" for sharing or seeing experiences with other users. Introduction: Trendlines are the most famous technical analysis in trading . Trend lines continually form on the charts of markets across all the different timeframes providing huge opportunities for traders to jump in and profit on the action. In the other hand, The tr
Pipfinite creates unique, high quality and affordable trading tools. Our tools may or may not work for you, so we strongly suggest to try the Demo Version for MT4 first. Please test the indicator prior to purchasing to determine if it works for you. We want your good reviews, so hurry up and test it for free...we hope you will find it useful.
Combo Swing Control with Energy Beam Strategy: Confirm swing pullback signals Watch Video: (Click Here)
Features Detects overall bias and waits for ove

EasyTrend Pro is the powerful trend indicator provided with all necessary for trade and it is very easy to use. Everyone has probably come across indicators or Expert Advisors that contain numerous input parameters that are difficult to understand. But here, input parameters are simple and it is no need to configure anything — neural network will do all for you.
Difference from a classic version
The real-time multi time frame panel is added, so you can check a trend for other timeframes witho

1000% non-repaint high accuracy signal technical indicator. Solar wind Predator work on all pairs with high and low volatility Solar wind Predator work from the 1 minute timeframe to the Monthly timeframe Swing trading H1 to W1 Scalping M1 to M30 Blue arrows above the zero line look for buying(bullish) opportunities. Orange arrows below zero line look for selling(bearish) opportunities.

通过简单的拖放EA将Metatrader 4与Python连接的文档。 完整的端到端解决方案,经过全面测试,快速,高效!
Pytrader生态系统由python脚本和MT5或MT4 EA组成。 对于许可,还使用指示器。 python脚本和EA之间的通信基于套接字。 EA是服务器,而python脚本是客户端。 它始终是查询(函数/ python脚本)和输出(数据/服务器)。 EA不需要与运行python脚本的计算机相同。 在我们的Github链接上,您会找到python脚本,EA,完整的文档以及一个显示如何调用函数的Pytrader示例脚本。 如有疑问,我们还有一个不和谐频道。 在演示中(没有许可指示符)还具有全部功能,但适用于数量有限的乐器 (EURUSD,AUDCHF,NZDCHF,GBPNZD和USDCAD)。
下载EA =>这里
演示支持:EURUSD,AUDCHF,NZDCHF,GBPNZD和USDCAD
Python MT5 EA插座连接器 比以往更轻松!通过简单的拖放式EA将Metatrader4与Python策略连接起来从未如此简单! 完整,快速的解决方

KT Candlestick Patterns Scanner is a Multi-Symbol and Multi-Timeframe scanner that fetches and shows various candlestick patterns on 28 currency pairs and 9 time-frames concurrently . The scanner finds the candlestick patterns by loading the KT Candlestick Patterns indicator as a resource in the background.
Features
The scanner can find the candlestick patterns on 252* combinations of symbols and time-frames from a single chart. Open the signal's chart loaded with a predefined template with
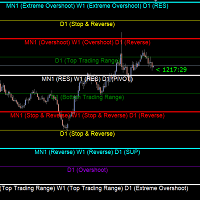
Gold Levels MTF - this is a fine stock technical indicator. The indicator algorithm analyzes the movement of the asset price, displays price levels of support and resistance from all time frames (TF) using the Murray method based on the Gann theory. The indicator indicates overbought and oversold fields, giving an idea of possible reversal points and at the same time giving some idea of the strength of the current trend. Description of levels: (Extreme Overshoot) - these levels are the ultimat

This indicator is based on the mathematics of the great trader W.D. Ganna. With its help, you can easily find strong levels by analyzing swings to find the optimal entry point. The indicator works on all instruments and all timeframes. The indicator is fully manual and has control buttons. All you need to do is press the NEW button, a segment will appear, which you can place on any movement, swing or even 1 candle that you want to analyze. By placing the segment, press the OK button. A grid (th

Read detailed description and Get Free Demo and extra indicators: https://www.mql5.com/en/blogs/post/758610
Features:
Halftrend Arrow Scan: Scan Max Past Bars for Halftrend arrows. Show how many bars back the arrow occurred in a bracket Past Bars Back Alerts: Num of bars back for which scanner will send alerts Halftrend HTF Align: Scan Higher timeframes for Trend Direction of Halftrend Indicator and if trends align show a slanting Green/Red Arrow for Up/Down trend Semafor 3 Check: Few bars

This indicator is designed to detect high probability reversal patterns: Double Tops/Bottoms with fake breakouts . Please read also the blog post " How To Yield Big Winners Consistently! " which explains the concepts behind the ULTIMATE Double Top/Bottom indicator and how you can use a top-down approach to get 15 - 20R winning trades on a regular basis . The provided video shows the maximum performance of the indicator. With maximum performance, I mean that this could have been the profit if you

Was: $299 Now: $99 Supply Demand uses previous price action to identify potential imbalances between buyers and sellers. The key is to identify the better odds zones, not just the untouched ones. Blahtech Supply Demand indicator delivers functionality previously unavailable on any trading platform. This 4-in-1 indicator not only highlights the higher probability zones using a multi-criteria strength engine, but also combines it with multi-timeframe trend analysis, previously confirmed swings

VR ATR Pro 指标是一个强大的专业工具,用于确定金融工具的目标水平。该指标的有效性已被真实和模拟账户的数千次测试所证明。 VR ATR Pro 指标在真实数据上运行,使用实时真实的统计数据。统计数据是很顽固的东西,在数学计算中使用真正的统计数据可以让你计算出金融工具的准确目标水平。 对于安装文件,说明,愉快的奖金 联系我 好处 该指标有许多优点,以下是其中的几个。 指标的高精确度。 超自然现象可以排除在计算之外。 直接在图表上简单显示目标水平。 适用于任何金融工具(外汇、金属、差价合约、期货、加密货币)。 它不会被重新绘制,它不断地保存它的读数。 对确定 Stop Loss 和 Take Profit 水平有效。 智能手机通知,电子邮件和MetaTrader提醒。 MetaTrader 4和MetaTrader 5的版本是完全相同的。 易于设置和安装。 适用于初学者和有经验的交易者。 适用于所有时段和时间范围。 建议 计算指标的时期必须小于指标的时间框架。 在新金融工具的设置中使用读数的准确性计算。 使用该指标来计算每日或长于一天的时期的水平。 将该指标与你的交易系统结合起来使

The indicator displays volume clusters or volume profiles to choose from.
Input variables
StepPoint - cluster step in points, if the value is zero, the step is assigned automatically. AssociatedTimeframe - binding the indicator to the specified timeframe of the chart, if the value is equal to Current, the indicator works on all timeframes. ClustersVolume - volume in clusters: All - all volume. Active - active volume (which produced the price movement). ClustersAsDelta - difference betw

多货币和多时间框架指标 MACD。 仪表板可以显示传统(真实)MACD 和 MetaTrader 中内置的 MACD。
在面板上,您可以看到指标的当前状态 - MACD 线的移动方向、它们的交点以及带有指标图表的弹出窗口。 在参数中,您可以指定任何所需的交易品种和时间范围。 扫描仪还可以发送有关线相互交叉以及线穿过零电平的通知。 通过单击单元格,将打开给定的符号和句点。
因此,您可以轻松扫描所有时间范围的所有货币对和交易品种,以找到 MACD 主线和信号线或零水平的交叉点。
显示/隐藏仪表板的热键默认为“D”。 默认情况下,启用/禁用弹出图表的热键为“C”。 用于切换图表“1”和“2”上的箭头的热键。 MACD(移动平均收敛/发散)指标(或“振荡指标”)是根据历史价格数据(最常见的是收盘价)计算得出的三个时间序列的集合。 这三个系列是:MACD 系列本身、“信号”或“平均”系列以及“背离”系列(两者之间的区别)。 MACD 系列是价格系列的“快速”(短期)指数移动平均线 (EMA) 和“慢速”(较长周期)EMA 之间的差异。 平均数系列是 MACD 系列本身的 EMA。
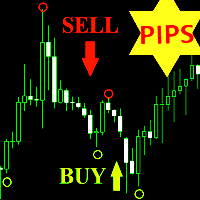
Pips Scalper Indicator - is a forex trading indicator specially designed for traders who are interested in scalping strategy. Scalping is a trading strategy in which a trader attempts to make a positive trade by snippets of small price movements. How to use the indicator? When the indicator draws a green circle on the chart of the currency pair, we open a buy deal and set a short TakeProfit of 20-25 points. In 87% of the signals, the price will go at least 20 pips in the direction of the arrow.

这个多时间框架和多符号供需区仪表板指示器在价格达到供需区时发送警报。也可以使用它来提醒常规的双顶/双底而不是区域。它可以用于从 M1 到 MN 的所有时间范围。可以使用 RSI、背离(MACD、RSI 或 Awesome)和蜡烛图过滤器(pin bar、吞没、镊子和晨星/夜星)来仅过滤掉最强的设置。结合您自己的规则和技术,该指标将允许您创建(或增强)您自己的强大系统。 在产品博客 的末尾,您将能够下载示例智能交易系统 (EA) 的源代码,该示例使用 iCustom() 函数从指标获取交易信号。尽管 EA 功能齐全,但主要目的是使用代码并将其粘贴到您自己开发的 EA 中或将您自己的额外进入/退出逻辑添加到此 EA 中。鉴于我的时间有限,我将无法提供任何编程支持。我很抱歉。
特征 这 足以放置一个指标图表上,你会出现在仪表板的任何新的信号接收警报。支持所有 Metatrader 原生警报类型。
可以选择要在仪表板中显示的时间范围。 在仪表板内持续执行发散等级排序。可以禁用此排序,以便更轻松地找到特定符号。然后,交易品种将按照它们在交易品种参数中输入的相同顺序显示,或者按照它们在市场报
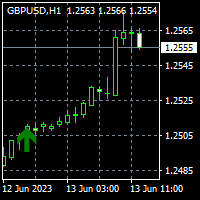
To get access to MT5 version please click here . This is the exact conversion from TradingView: "UT Bot Alerts" by "QuantNomad". This is a light-load processing and non-repaint indicator. Buffers are available for processing in EAs. Candle color option is not available. You can message in private chat for further changes you need. Here is the source code of a simple Expert Advisor operating based on signals from UT Bot Alerts . #property strict input string EA_Setting= "" ; input int magic_numb

你想成为一个持续盈利的五星级外汇交易商吗? 1. 阅读我们简单的 交易系统 的基本描述 以及 它在2020年的主要策略更新 2. 发送你的购买截图,以获得我们独家交易聊天的个人邀请
Lighthouse 是一个惊人的精确和可靠的支撑和阻力指标。
它显示最重要的交易水平,并根据其相关性绘制。
如果一个水平被明显打破,它将改变其作用和颜色。支撑位变成阻力位,反之亦然。 主要特点 自动调整到基础时间框架 只显示重要的支撑和阻力水平 如果一个水平被明显突破,立即作出图形反应 较厚的SR水平比较薄的水平更重要
一般设置 分析模式: 在三种不同的扫描模式(日内、中度和高度时间框架)中选择,或使用默认设置的自动调整。
自动模式根据基础图表时间框架调整使用的分析模式。 敏感模式。敏感模式可以识别更多的支持和阻力水平。如果您是一个日内交易员,我们建议使用它。将此设置为 false ,如果您想减少绘制的SR水平的数量。 SR距离(点)。这个可改变的数值是内置支撑和阻力位距离检查的基础。它测量当前价格与下一个Lighthouse水平之间的距离。如果当前价格与下一级别的距离超过5个点,你将

Contact me after payment to send you the User-Manual PDF File. How To Test
You can test the indicator by free version, to get the free version please contact me ( the free version scans charts in W1 and MN1 time-frames ) it's free.
123 Pattern Breakout
Trend is your friend, trade along the trend, but how do we identify trends? Sometimes the simplest methods have the best results. Pattern 123 is based on the breakout important price levels, when the price is trying to break the previou

KT Higher High Lower Low marks the following swing points with their respective S/R levels: Higher High: The swing high made by the price that is higher than the previous high. Lower High: The swing high made by the price that is lower than the previous high. Lower Low: The swing low made by the price that is lower than the previous low. Higher Low: The swing low made by the price that is higher than the previous low.
Features The intensity of swing high and swing low can be adjusted by cha

BeST_ Elliot Wave Oscillator Strategies is an MT4 indicator which by default is the difference of two SMAs displayed as a histogram fluctuating around zero while a Signal Line generates Entry Signals either in a Reverse or in a Normal Mode and it is a very powerful tool that very often exploits huge market movements. Signal Line comes in 2 types: Advanced Get Type – like the corresponding one used in the homonym analysis package Mov. Average Type – as a Moving Average of the Elliot Oscillator I

The indicator of a Professional Trader is an arrow indicator for predicting the direction of price movement. I have been working on this indicator since 2014.
You can use this indicator as your main indicator, use its entry signals, and use it as your only indicator to find entry points.
About the product: Recommended TF [H4-D1-W1] . The indicator predicts the direction of the next candle. Fits a variety of tools; Flexibility in settings for different instruments and intervals through the

Currency Strength Meter is the easiest way to identify strong and weak currencies. This indicator shows the relative strength of 8 major currencies + Gold: AUD, CAD, CHF, EUR, GBP, JPY, NZD, USD, XAU. Gold symbol can be changed to other symbols like XAG, XAU etc.
By default the strength value is normalised to the range from 0 to 100 for RSI algorithm: The value above 60 means strong currency; The value below 40 means weak currency;
This indicator needs the data of all 28 major currency pair

Royal Prince Fibonacci , has the most advance Trend detection algorithm built into its Alert system combined with the RoyalPrince Non-repaint Arrows with it's own alert system you will never miss the opportunity of the trade.
2nd picture is how to use Guide on how i use it to Scalp or take long trades.
works on all Charts and all Timeframe on mt4. ︎Best Timeframe M15 for scalping H1 for Day Trading Options: • Fibonacci days High and Lows • Fibonacci Targets • Fibonacci Alert System • Tren

EZT 趋势指标将向您显示趋势、回调和入场机会。 提供可选的过滤和所有类型的警报。 添加电子邮件和推送通知警报。 我们还在开发基于该指标的 EA,即将推出。
它是一个多功能指标,由两个颜色直方图和一条线组成。 它是趋势方向和强度的直观表示,您也可以在线上或直方图上多次发现背离。
该指标与自动参数设置配合良好。 这些是针对给定时间范围预先确定的,我们建议使用具有该设置的指标。 在手动模式下,您可以设置自己的参数。 这是一个多时间框架 (mtf) 指标。
该指标与我们的其他指标(例如 MTF rsi 或 MTF cci 或 MACD pro)组合起来效果很好。
交易工具的波动性越大,您寻找最佳入场机会的时间范围就越小。 始终考虑更高的时间范围方向!
为此,您应该使用更多指标实例。
输入 参数模式:可选择“手动参数”或预设的“自动参数”。 自动参数处于多时间范围模式。 示例:当您设置自动 H1 参数时:您可以看到从 H1 时间范围一直到 1 分钟的相同显示。 在此设置中,指标不会在更高的时间范围(例如 H4 或更大)上显示。 手动时间范围:当在第一个菜单中选

介绍 Quantum Heiken Ashi PRO 图表 Heiken Ashi 蜡烛旨在提供对市场趋势的清晰洞察,以其过滤噪音和消除虚假信号的能力而闻名。告别令人困惑的价格波动,迎接更流畅、更可靠的图表表示。 Quantum Heiken Ashi PRO 的真正独特之处在于其创新公式,它将传统烛台数据转换为易于阅读的彩色条。红色和绿色条分别优雅地突出了看跌和看涨趋势,让您能够以非凡的精度发现潜在的进入和退出点。
量子 EA 通道: 点击这里
MT5版本: 点击这里
这一卓越的指标具有以下几个关键优势: 增强清晰度:通过平滑价格波动,Heiken Ashi 金条可以更清晰地反映市场趋势,使您更容易识别有利的交易机会。 减少噪音:告别经常导致错误信号的不稳定价格变动。 Quantum Heiken Ashi 指标可过滤噪音,使您能够做出更明智的交易决策 无缝集成:Heiken Ashi 指标专为 MetaTrader 开发,可无缝集成到您的交易平台中。它用户友好、高度可定制,并且与您的其他交易指标和过滤器兼容 无论您是寻求新优势的经验
Follow Line 指标是交易者用于准确识别和跟随市场趋势的重要工具。该指标动态适应价格变化,绘制一条平滑、连续的线来跟踪价格走势。凭借其视觉上的简洁性和有效性,能够提示趋势变化,Follow Line 是任何交易者策略中的绝佳补充。 主要特点: 趋势跟踪: Follow Line 紧随价格变化,使交易者能够轻松识别当前的市场趋势。 视觉简洁: 通过清晰明确的线条,即使是经验不足的交易者也能快速理解市场方向。 适应性强: 适用于各种时间框架和工具,适合从日内交易到波段交易的多种交易策略。 如何使用: 安装: 将 Follow Line 指标添加到您希望分析的金融工具的图表上。 设置: 根据您的交易策略调整指标参数。 趋势分析: 观察 Follow Line 线条以确定当前趋势方向。 交易机会: Follow Line 在趋势市场中特别有用。例如,在突破情境中,当价格超过重要的阻力或支撑位时,Follow Line 可以确认走势的有效性。这使交易者能够更加自信地把握价格波动的机会。

We have combined all of our beloved indicators the likes of: Key level order block , Key level supply and demand , Key level liquidity grab and Key level wedge into one single indicator and dashboard.
Whats new Dashboard : There is an easy access dashboard for all your needs. Multi-timeframe button : There is now a multi-timeframe option for Order Blocks and Supply and demand zones, making it easy to see higher timeframe zones easily on the current timeframe by just clicking the desired timefr

Welcome to the world of SMC (Smart Money Concepts) Trading, where we empower traders with the tools and knowledge to make smarter trading decisions. Our latest addition to our suite of trading tools is the SMC Trading Pro indicator, version 1.0. Key Features: Major Market Structure Identification with BODY break. Order Block must be in Major Swing ( not Small Swing ). Order Block with Fair Value Gap Detection. Order Block in Discount | Premium zone. Filter for only Bullish, Bearish or All Order

The BB Reversal Arrows technical trading system has been developed to predict reverse points for making retail decisions.
The current market situation is analyzed by the indicator and structured for several criteria: the expectation of reversal moments, potential turning points, purchase and sale signals.
The indicator does not contain excess information, has a visual understandable interface, allowing traders to make reasonable decisions.
All arrows appear to close the candle, without redr

Professional Histogram (PH) 是一种高效可靠的外汇、差价合约和二元期权交易工具。
PH 易于使用和配置,适合初学者和经验丰富的交易者。
与大多数指标不同,Professional Histogram 发现更长的趋势并提供更少的错误信号。
当出现买入或卖出信号时,会触发警报,让您及时开仓,避免一直坐在电脑前。
交易技巧 当直方图改变颜色时开仓。 请参阅屏幕截图 1 上的示例交易。
该指标最适合在 M15-H4 上交易。
特征 适合剥头皮和长线交易。 向电子邮件和移动设备发送信号。 易于使用和配置。 它既可以作为独立工具使用,也可以与其他指标结合使用。 无需重绘。 没有滞后。
参数 Period - 负责计算指标的平均周期的关键参数。 Filter - 过滤周期。 Alert - 启用/禁用警报。 Email - 启用/禁用电子邮件。 Push - 启用/禁用向手机发送消息。 clrUPPER - 正直方图颜色。 clrLOWER - 负直方图颜色。 Width - 线宽。 祝您交易顺利!
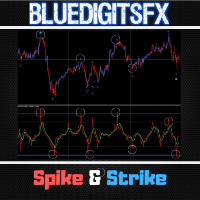
MT5 Version Available Here: https://www.mql5.com/en/market/product/50255
Telegram Channel & Group : https://t.me/bluedigitsfx
V.I.P Group Access: Send Payment Proof to our Inbox
Recommended Broker: https://eb4.app/BDFXOsprey
* Breakthrough Solution For Reversal Trading And Filtering With All Important Features Built Inside One Tool! BlueDigitsFx Spike And Strike Reversal is a mixed oscillator that mixes the readings of a number of indicators, which makes it potential to preci
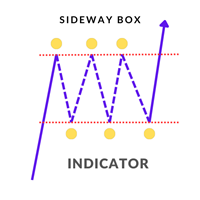
Sideway Box Indicator The Sideway Box Indicator is an advanced trading tool designed to help traders identify and capitalize on sideways market conditions. This powerful indicator detects periods when the market is in a sideways (ranging) phase, providing traders with clear visual cues. Key Features: Sideways Market Detection : The Sideway Box Indicator accurately identifies sideways market conditions, allowing traders to recognize when the price is consolidating within a specific range. Buy/Sel
Binary Trader Master 是一个基于箭头的指标,可预测蜡烛的收盘价。它仅在一根蜡烛内进行分析。当蜡烛打开时,需要一些时间来进行分析并预测蜡烛的收盘价。然后它产生一个信号。该指标还允许您应用可用于分析的时间限制,这意味着您实际上可以告诉指标允许在蜡烛内进行分析的时间。该指标监控蜡烛中的特殊交易量模式。该分析实际上预测了当前 (0) 蜡烛的收盘价。由于此类蜡烛通常具有强劲的成交量,因此这些信号也具有良好的获利潜力,也可用于外汇交易。二元和外汇交易者都可以从该指标中受益。 由于指标与单个蜡烛的主体一起使用,因此指标仅在实时或视觉策略测试模式下提供信号! 信号不要重绘! 购买后请联系我!我会为您提供交易说明,免费赠送您丰厚的红利!
Magic Channel is a channel indicator for the MetaTrader 4 terminal. This indicator allows finding the most probable trend reversal points. Unlike most channel indicators, Magic Channel does not redraw. The alert system (alerts, email and push notifications) will help you to simultaneously monitor multiple trading instruments. Attach the indicator to a chart, and the alert will trigger once a signal emerges. With our alerting system, you will never miss a single position opening signal! You can t

该指标根据 ZigZag 指标、交易时段、分形或蜡烛(包括非标准时间范围:年、6 个月、4 个月、3 个月、2 个月)自动绘制斐波那契水平(自动斐波那契回撤)。 您可以选择任何更高的时间范围进行斐波纳奇计算。 每次当前柱关闭时都会重新绘制级别。 当超过指定级别时可以启用警报。
您还可以分析历史水平。 为此,需要在“过去的斐波纳奇数”参数中指定斐波纳奇位的数量。
参数
Calculate Fibo according to — 根据斐波那契搜索模式计算斐波那契: Candles (High-Low) — 根据最高价-最低价构建斐波那契; Candles (Close-Close) — 基于收盘价-收盘价构建斐波那契; ZigZags — 通过 ZigZag 点构建斐波那契; Sessions — 通过交易会话构建斐波那契; Fractals — 通过分形点构建斐波那契。 Minimum fibo size, points (0-any) — 最小斐波那契尺寸,以点为单位。 如果斐波那契尺寸小于此大小,则忽略它。 TF for Candle — 用于构建斐波那契水平的

QM (Quasimodo) Pattern is based on Read The Market(RTM) concepts. The purpose of this model is to face the big players of the market (financial institutions and banks), As you know in financial markets, big traders try to fool small traders, but RTM prevent traders from getting trapped. This style is formed in terms of price candles and presented according to market supply and demand areas and no price oscillator is used in it. RTM concepts are very suitable for all kinds of investments, includi

Key Breakout and Jump/Fall levels. No lagging. No repaint. Trend line is useful for detecting pattern, which is intended for the triangle pattern, Support & Resistance lines, and as a breakout up or down line. The trend lines are formed first before the price of the pair reach it. So it does not repaint. Each line has a description, such as Support, Resistance, Current-Support as key breakout down, and Current-Resistance as a key breakout up. Each broke out line turns into a new support or re

after getting indic ator cont act me for Bonus E a. Non Repaint TMA channel with special conditioned arrows on price cross of channel lines plus market Volatility factor, which makes product much more accurate than any usual tma channel indicators. It is proven to be profitable with Ea built based on it which you will get as a BONUS in case of indicator purchase. Good luck.

PAAIOS 指 的 是 价格 一体化 解决。 而 这 正 是 该 指标 目的 它 应该 给 你 一 个 来 果断 地 改善 的 交易 可以 时间 框架 中 显示 趋势 "线、需求和供应区。
特点 * 检测多时间框架的供应和需求区 * 探测并显示多时间框架的趋势线 * 探测多个时间段的趋势行为--你可以一目了然地了解全貌 * 如果一个区域/趋势线接近价格,就会提醒你(屏幕、通知、邮件)。 * 使用智能算法,只计算强势的供应和需求区。
供应和需求 - 它是如何工作的 PAAIOS使用一个内部的人字形函数来计算多时间框架的人字形来获得波动。这没有什么特别的。但是PAAIOS测量的是所有的波动,只考虑真正显著的波动开始的区域。所以你可以从多个时间框架中得到真正强大的买方和卖方区域。
趋势线 - 它是如何工作的 Paaios 也 内部 zigzag 来 计算 趋势线。 这 什么 特别 的。 但是 , 如果 使用 较 高 时间 段 的 趋势线 并 供求 关系 结合 , 你 会 得到 真正 强势 的 指示 在 在 价格 价格 价格 价格 价格 价格 价格 价格 价格 价格 价格价格 价
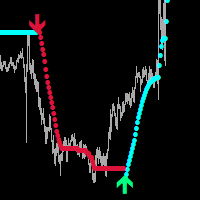
Global Parabolic MT4
Indicator for scalping on M1-M5.
A very good indicator for your trading system, it can be used as a standalone
trading system, I recommend using it together with - System Trend Pro
The indicator does not repaint and does not change its data.
Settings:
Change the FILTER parameter for accurate market entries.
Any questions? Need help?, I am always happy to help, write me in private messages or
In telegram
This indicator is unstoppable when combined with our other indicator called Market Analysis . After purchase, send us a message and you could get it for FREE as a BONUS! SPECIAL OFFER: $39 for this WEEK only! Original price is: $80
Trend Swing is a professional indicator that is developed from scratch by our in-house development team. This indicator is very sophisticated because you can see the entry price levels with buy and sell signals that are given in real-time!
It automati

这是最赚钱的指标。它的表现非常出色。无论市场上有什么兴趣,你都能看到。
几乎在所有情况下,它都只会给你一个长期的市场观点,但不要被愚弄,以为它是受事件约束的。不是这样的。它能找到市场上最大的利益所在,并将其展示给你。别忘了,最大的资金(利益)每天都不会在市场上出现。这是您没有遇到过的情况。月租金可能会给您一到两个信号,仅此而已。但当我们谈论大资金时,他们就是这样行事的。 如果您想了解更多,请点击这里。
这是最赚钱的指标。它的表现非常出色。无论市场上有什么兴趣,你都能看到。
几乎在所有情况下,它都只会给你一个长期的市场观点,但不要被愚弄,以为它是受事件约束的。不是这样的。它能找到市场上最大的利益所在,并将其展示给你。别忘了,最大的资金(利益)每天都不会在市场上出现。这是您没有遇到过的情况。月租金可能会给您一到两个信号,仅此而已。但当我们谈论大资金时,他们就是这样行事的。 如果您想了解更多,请点击这里。
Call/Put Ratio is one of the most well-known indicators of the market sentiment. The indicator has been developed by Martin Zweig. It is based on real volumes of the CBOE option market. As we know, a Call option gives its owner the right to buy the underlying asset at a predetermined price. A Put option gives the right to sell it. Thus, increasing volumes for Call options indicate the increasing demand. The growth of Put option volumes shows that supply starts exceeding demand. If we divide the
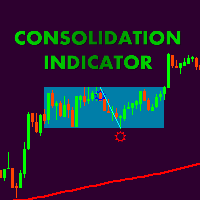
Сonsolidation box indicator with possibility of flexible settings according to the traiders requipments. Also, it is possible to embed indicatior in EA. Thank Alexey Mavrin for realization of technical task. According to the classic technical analysis the price is in motion without a clear direction for almost 70% of the market time and methods of getting profit from flat should be in the arsenal of any trader. Price consolidation- are periods of market equilibrium when supply and demand are app
NO REPAINT ADVANCED CHART PATTERN INDICATOR
By definition, a price ( chart) pattern is a recognizable configuration of price movement that is identified using a series of trendlines and/or curves. When a price pattern signals a change in trend direction, it is known as a reversal pattern; a continuation pattern occurs when the trend continues in its existing direction following a brief pause. Advanced Chart Pattern Tracker is designed to find the MOST ACCURATE patterns. A special script is

Did You Have A Profitable Trade But Suddenly Reversed? In a solid strategy, exiting a trade is equally important as entering.
Exit EDGE helps maximize your current trade profit and avoid turning winning trades to losers.
Never Miss An Exit Signal Again
Monitor all pairs and timeframes in just 1 chart www.mql5.com/en/blogs/post/726558
How To Trade You can close your open trades as soon as you receive a signal
Close your Buy orders if you receive an Exit Buy Signal. Close your Sell orde
MetaTrader市场是独有的自动交易和技术指标商店。
阅读MQL5.community用户备忘更多地了解我们提供给交易者的独特的服务:复制交易信号,自由职业者开发的自定义应用程序,通过支付系统完成的自动付款和MQL5云网络。
您错过了交易机会:
- 免费交易应用程序
- 8,000+信号可供复制
- 探索金融市场的经济新闻
注册
登录