适用于MetaTrader 4的付费技术指标 - 3
This LEGIT Indicator Can Accurately Predict the Outcome of One Bar.
Imagine adding more filters to further increase your probability!
Unlike other products, Binary Options PRO can analyze past signals giving you the statistical edge.
How Increase Your Probability
Information revealed here www.mql5.com/en/blogs/post/727038 NOTE: The selection of a Good Broker is important for the overall success in trading Binary Options.
Benefits You Get
Unique algorithm that anticipates price weaknes

介绍 Quantum Heiken Ashi PRO 图表 Heiken Ashi 蜡烛旨在提供对市场趋势的清晰洞察,以其过滤噪音和消除虚假信号的能力而闻名。告别令人困惑的价格波动,迎接更流畅、更可靠的图表表示。 Quantum Heiken Ashi PRO 的真正独特之处在于其创新公式,它将传统烛台数据转换为易于阅读的彩色条。红色和绿色条分别优雅地突出了看跌和看涨趋势,让您能够以非凡的精度发现潜在的进入和退出点。
量子 EA 通道: 点击这里
MT5版本: 点击这里
这一卓越的指标具有以下几个关键优势: 增强清晰度:通过平滑价格波动,Heiken Ashi 金条可以更清晰地反映市场趋势,使您更容易识别有利的交易机会。 减少噪音:告别经常导致错误信号的不稳定价格变动。 Quantum Heiken Ashi 指标可过滤噪音,使您能够做出更明智的交易决策 无缝集成:Heiken Ashi 指标专为 MetaTrader 开发,可无缝集成到您的交易平台中。它用户友好、高度可定制,并且与您的其他交易指标和过滤器兼容 无论您是寻求新优势的经验

You can visually backtest Elliot Wave Impulse to see how it behaved in the past!
Manual guide: Click here Starting price of $59 for the first 25 copies ( 1 left)! -- Next price is $120 .
This indicator is unstoppable when combined with our other indicator called Katana . After purchase, send us a message and you could get it for FREE as a BONUS! The Elliot Wave Impulse is a pattern identified in the Elliott Wave Theory, a form of technical analysis used to a

The indicator allows you to trade binary options. the indicator indicator works on any currency pair. Trading time is limited only to 10 minutes from 17:55 to 18:05 that is the MT4 broker time that i use. you should use The recommended time frame is М1 Chart and the expiration time is 2 minutes. the current average winning ratio from 2017 to 2021 - December is 72% ,This indicator gives high winning ratio with over 6 years of back testing you can check that by your self by enabling the built i

这是一个交易时段指标,可以显示四个交易时段的所有级别(开盘价-最高价-最低价-收盘价)。 该指标还可以预测会话级别。 会话可以用线条或矩形(空的或填充的)绘制,线条可以延伸到下一个会话。 您可以通过按热键(默认为“1”、“2”、“3”、“4”)轻松隐藏/显示每个会话。
您可以看到 ASR(平均会话范围)线(默认热键“A”) 。 这与 ADR 计算类似,只是它是根据最后一个 X 交易时段计算的,这使您可以看到当前(和之前)交易时段的潜在范围(今天价格可以移动多远)。 平均值的计算方式为之前会话的总和除以会话数(参数“ASR 周期(计算平均值的会话数)”),每个会话都有自己的 ASR 值。
该指标计算并绘制未来的会话及其大小。 正确识别报价历史记录中的漏洞。 它还可以在每个会话开始时绘制垂直分隔符。
指标自动确定图表的配色方案。
当价格触及会话水平或价格突破已关闭会话指定距离时,它还会发送警报。 可以禁用每个会话的警报。
参数“如果其他会话启动则停止会话”(热键“S”)允许您停止过时的会话,并在新会话中断时接收警报。
该指标可以绘制枢轴水平并就其发送警报。 这些级
趋势图直方图是一种基于使用两个移动平均线和多个振荡指标的算法的指标。 由于其颜色代码,它可以让您快速识别趋势并利用最大的市场冲动。
浅色表示趋势,深色表示冲动,灰色表示您不应该进入市场。 结合您的其他指标,它将成为您决策过程中非常好的盟友。
MT5版本在这里。
输入参数:
- 第 1 阶段(快速时期)
- 第 2 期(缓慢期)
- 振荡器周期
您可以启用两种类型的警报:
- 看跌/看涨警报(当市场趋势发生变化时)。
- 买入/卖出警报(当有强烈冲动时)。
警报的文本是完全可定制的,想放什么就放什么!
警报可通过弹出、电子邮件和推送通知方式提供。
想要查看其他免费 SPARTACUS 指标, 请点击此处
SPARTACUS2024 Improuve your trading - Be stronger on the Market!

ICT Silver Bullet
If you are searching for a reliable indicator to trade the ICT Silver Bullet concept, or ICT concepts, Smart Money Concepts, or SMC, this indicator will respond to your need! This indicator will help you identify the following: FVG - fair value gaps Market structure: BOS and CHOCH. It is based on ZIGZAG as it is the most subjective way to do it. ICT Silver Bullet windows and related notifications when it starts and when an FVG appears Swing High and low that are potential b

QM (Quasimodo) Pattern is based on Read The Market(RTM) concepts. The purpose of this model is to face the big players of the market (financial institutions and banks), As you know in financial markets, big traders try to fool small traders, but RTM prevent traders from getting trapped. This style is formed in terms of price candles and presented according to market supply and demand areas and no price oscillator is used in it. RTM concepts are very suitable for all kinds of investments, includi

Order Blocks are supply or demand zones in which big traders can find the comfort of placing large buy and sell orders and completing a big, very big transaction. Order blocks are a unique trading strategy that helps traders find a direction in the market. Usually, it allows traders to find out what financial institutions are planning to do in a particular market and better indicate the next price movement.

System Trend Pro - This is the best trend trading indicator!!!
The indicator no repaint!!! The indicator has MTF mode, which adds confidence to trading on the trend ( no repaint ). How to trade? Everything is very simple, we wait for the first signal (big arrow), then wait for the second signal (small arrow) and enter the market in the direction of the arrow.
(See screens 1 and 2.) Exit on the opposite signal or take 20-30 pips, close half of it, and keep the rest until the oppo

The Missing Edge You Need To Catch Breakouts Like A Pro. Follow a step-by-step system that detects the most powerful breakouts!
Discover market patterns that generate massive rewards based on a proven and tested strategy.
Unlock Your Serious Edge
Important information here www.mql5.com/en/blogs/post/723208
The Reliable Expert Advisor Version
Automate Breakout EDGE signals using "EA Breakout EDGE" Click Here Have access to the game changing strategy that will take your trading to the n
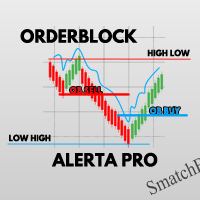
訂單塊專業警報
OrderBlock ALERTA PRO 是確定金融市場最佳切入點的權威工具。有了它,您將找到訂單的理想平衡點,檢測突破看漲或看跌結構時流動性何時開始增加。直接在您的 Meta Trader 上接收推播通知,讓您隨時了解狀況。
此外,OrderBlock ALERTA PRO 可以識別高低 (HL) 和低高 (LH) 區域,為您提供準確的價格,以了解市場何時會出現趨勢反轉。您掌握必要的精確度,並充滿信心地進入和退出市場。
OrderBlock ALERTA PRO 也執行吞沒標記,區域填滿為實心紅色或藍色,表示延續下降趨勢或上升趨勢的巨大流動性機會。
此指標對於識別所有外匯金融市場對的進入點至關重要,可將您的交易策略提升到一個新的水平。
如果您有任何疑問,請隨時與我們聯繫。
斯瑪奇BR
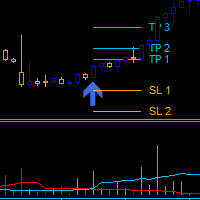
Dark Power is an Indicator for intraday trading. This Indicator is based on Trend Following strategy, also adopting the use of an histogram to determine the right power . We can enter in good price with this Indicator, in order to follow the strong trend on the current instrument. The histogram is calculated based on the size of the bars and two moving averages calculated on the histogram determine the direction of the signal
Key benefits
Easily visible take profit/stop loss lines Int

Was: $249 Now: $99 Market Profile defines a number of day types that can help the trader to determine market behaviour. A key feature is the Value Area, representing the range of price action where 70% of trading took place. Understanding the Value Area can give traders valuable insight into market direction and establish the higher odds trade. It is an excellent addition to any system you may be using. Blahtech Limited presents their Market Profile indicator for the MetaTrader community. Ins

SMT (Smart Money Technique) Divergence refers to the price divergence between correlated assets or their relationship to inversely correlated assets. By analyzing SMT Divergence, traders can gain insights into the market's institutional structure and identify whether smart money is accumulating or distributing assets. Every price fluctuation should be confirmed by market symmetry, and any price asymmetry indicates an SMT Divergence, suggesting a potential trend reversal. MT5 Version - https:/

HURRY! The offer price of $89 is ACTIVE ONLY for next 4 PURCHASES, after which the price will increase to $129. William Delbert Gann, commonly known as W.D. Gann, was an exceptional market analyst renowned for his unique trading style in the early 20th century. His trading techniques were based on a blend of mathematics, geometry, astrology, and ancient mathematics. Gann believed that stock market movements followed specific patterns and cycles, rather than being random. His methodologies, cel

このインディケータはボリンジャーバンドを裁量およびEAで実際に利用してきた私自身の経験から、より手軽に、かつ効果的に活用できるよう作成された裁量トレード用サインツールです。 ブレイクアウトでの順張り、リバウンドでの逆張りの両面で利用でき、各種のフィルター機能でより精度の高いサインを発信します 勝敗判定機能により、このインディケータの直近の相場環境に対する有効性を確認できます 全通貨ペア、全タイムフレームで利用できます。リペイントはしません
設定項目は以下の通りです。 Bollinger Bands Period
Bollinger Bands Deviation
Bollinger Bands Shift
Entry Mode ...ボリンジャーバンドにタッチしてからのBreakout(順張り), Rebound(逆張り)のどちらかを指定 Plus Filter ...独自アルゴリズムによるフィルターでシグナルの精度を高めます(Reboundモード専用) Trend Filter ...下で設定する移動平均のトレンド方向でのシグナルに限定します Moving Aver

One of the most powerful and important ICT concepts is the Power of 3. It explains the IPDA (Interbank Price Delivery Algorithm) phases. PO3 simply means there are 3 things that the market maker's algorithm do with price:
Accumulation, Manipulation and Distribution
ICT tells us how its important to identify the weekly candle expansion and then try to enter above or below the daily open, in the direction of the weekly expansion.
This handy indicator here helps you keep track of the weekly

你想成为一个持续盈利的五星级外汇交易商吗? 1. 阅读我们简单的 交易系统 的基本描述 以及 它在2020年的主要策略更新 2. 发送你的购买截图,以获得我们独家交易聊天的个人邀请
Lighthouse 是一个惊人的精确和可靠的支撑和阻力指标。
它显示最重要的交易水平,并根据其相关性绘制。
如果一个水平被明显打破,它将改变其作用和颜色。支撑位变成阻力位,反之亦然。 主要特点 自动调整到基础时间框架 只显示重要的支撑和阻力水平 如果一个水平被明显突破,立即作出图形反应 较厚的SR水平比较薄的水平更重要
一般设置 分析模式: 在三种不同的扫描模式(日内、中度和高度时间框架)中选择,或使用默认设置的自动调整。
自动模式根据基础图表时间框架调整使用的分析模式。 敏感模式。敏感模式可以识别更多的支持和阻力水平。如果您是一个日内交易员,我们建议使用它。将此设置为 false ,如果您想减少绘制的SR水平的数量。 SR距离(点)。这个可改变的数值是内置支撑和阻力位距离检查的基础。它测量当前价格与下一个Lighthouse水平之间的距离。如果当前价格与下一级别的距离超过5个点,你将

仪表盘的意图是提供配置资产的日、周、月范围的快速概览。在 "单一资产模式 "下,仪表板会在图表中直接显示可能的反转点,从而使统计数据可以直接交易。如果超过了配置的阈值,仪表盘可以发送屏幕警报,通知(到手机MT4)或电子邮件。
使用这些信息的方式有多种。一种方法是,已经完成近100%日均运动的资产显示出逆转的趋势。另一种方法是观察资产,它的波动率与平均水平相比非常低。现在的挑战是如何从这个低波动性中交易突破。
这只是两种可能的策略,对于这些策略,仪表盘可以成为一个重要的辅助工具。发现各种可能性!
关于控件的完整描述,请观看我的博客文章( https://www.mql5.com/en/blogs/post/732999 )。
注意:这个指标不能在策略测试器中使用。所以这里来自市场的演示版本不能使用。请使用该指标的免费版本进行测试: https://www.mql5.com/de/market/product/33913
这是ADR-Dashboard的MT4版本。如果你想在MT5上使用,请到 https://www.mql5.com/en/market/produc

商品通道指数 (CCI) 指标的多货币和多时间框架修改。 您可以在参数中指定任何所需的货币和时间范围。 此外,该面板还可以在跨越超买和超卖水平时发送通知。 通过单击带有句点的单元格,将打开该符号和句点。 这是 MTF 扫描仪。
默认情况下,从图表中隐藏仪表板的键是“D”。
参数 CCI Period — 平均周期。 CCI Applied price — 价格类型。 Clear the chart at startup — 启动时清除图表。 Set of Pairs — 符号集 — Market Watch — 来自“市场观察”的货币对; — Specified manually — 在参数“Pairs”中手动指定对。 — Current pair — 当前对。 Pairs (separated by a space or semicolon) — 由空格或分号分隔的符号列表。 货币名称的书写方式应与经纪商的名称完全相同,并保留大小写和前缀/后缀。 Time Frames (separated by a space or semicolon) — 由空格或分号分隔的时
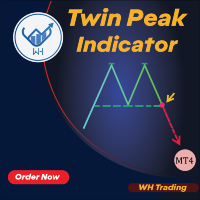
欢迎使用双峰指标 MT4 --(双顶/双底)-- 双顶底指标是一种技术分析工具,旨在识别市场中潜在的反转模式。
它确定了价格连续出现两个几乎相等高度的波峰或波谷,随后价格向相反方向移动的区域。
这种模式表明市场正在失去动力,可能已准备好趋势逆转。
特征:
自动图表注释:指标自动在图表上标记双顶底形态 易于使用:该指标用户友好,可以轻松应用于 MT5 平台中的任何图表。 可定制:指标具有可定制的设置。 警报系统。 适用于任何乐器。 该指标可与其他技术分析工具结合使用,以确定趋势方向和反转形态的潜在强度。 总的来说,双顶和双底指标是寻求识别市场潜在趋势逆转的交易者的强大工具。
其可定制的设置、警报和自动图表注释使其易于使用,
而其多时间框架分析和趋势确认功能为交易者提供了对潜在交易机会的宝贵见解。
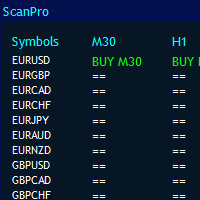
MT4 Universal Panel pro 专为所有指标和时间框架设计,包括 ex4 文件。
它可以根据您的计算机功率和最多 10 个时间范围扫描无限对。面板的大小会自动排列。
您可以通过缓冲区调用任何指标。
它适用于所有默认和自定义指标。您可以简单地将它用于 heikan ashi、rsi、抛物线、砖形图、分形、支撑阻力、供应需求、背离、高低移动平均线。
它可以从一个窗口操作所有货币。如果您对设置有疑问,请联系。
这是 mt4 仪表板,它适用于任何一对。所有你必须输入对名称如下。它将调用任何外汇指标并检查该信号条。
IE。如果您想要小组工作并仅扫描 3 对和多个时间范围,则输入如下
符号 : EURUSD,GBPUSD,USDJPY
时间框架:30、60、240
时间范围的输入:
M1 = 1
M5 = 5
M15 = 15
M30 = 30
H1 = 60
H4 = 240
D1 = 1440
每周 = 10080
每月 = 43200
为不同的符号名称添加了后缀和前缀。
Binary Trader Master 是一个基于箭头的指标,可预测蜡烛的收盘价。它仅在一根蜡烛内进行分析。当蜡烛打开时,需要一些时间来进行分析并预测蜡烛的收盘价。然后它产生一个信号。该指标还允许您应用可用于分析的时间限制,这意味着您实际上可以告诉指标允许在蜡烛内进行分析的时间。该指标监控蜡烛中的特殊交易量模式。该分析实际上预测了当前 (0) 蜡烛的收盘价。由于此类蜡烛通常具有强劲的成交量,因此这些信号也具有良好的获利潜力,也可用于外汇交易。二元和外汇交易者都可以从该指标中受益。 由于指标与单个蜡烛的主体一起使用,因此指标仅在实时或视觉策略测试模式下提供信号! 信号不要重绘! 购买后请联系我!我会为您提供交易说明,免费赠送您丰厚的红利!

REMINDER: Early buyers hot price discount: Price subject to rise after first 20 copies. Starting price $65 and final price will be $1275. Secure your discounted copy Now!
Smart Money Analyser Indicator User Manual
1. Introduction Welcome to the Smart Money Analyser Indicator This powerful tool provides traders with comprehensive market analysis by combining various technical indicators to generate actionable trading signals. Designed to be user-friendly, this indicator helps traders of a
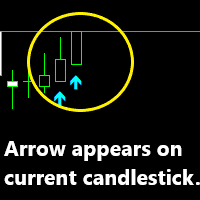
Advanced artificial intelligence indicator that is 100% non-repaint and appears on current candlestick. The indicator is based on arrows which serve as your entry points. Buy arrow is your buy signal and orange arrow are your sell signal as more arrows appear the stronger the trend and you can add more entries. The indicator works on all timeframe from the one-minute timeframe to the monthly timeframe. The AI Non-repaint indicator works on all forex pairs.
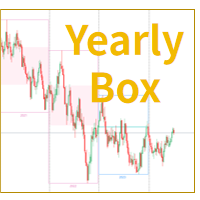
MT4年线盒子指标 MetaTrader 4平台上的“年线盒子”指标是一款看盘分析工具,将一年的价格走势直观地显示在一个矩形框内。该指标通过框定价格范围并着色背景来突出展示一年的开盘价和收盘价。交易者可以一目了然地 识别和分析年度价格波动 ,使用年线盒子指标清晰地了解市场中的年度趋势和模式。该指标提供简洁直观的年度数据可视化,帮助交易者基于历史价格走势做出明智的决策。无论你是祼K交易员,还是趋势交易员,“MT4年线盒子指标”都是一个超级有用的助手。
可以在货币对、加密货币、指数、黄金原油等多个产品上显示。 可以在各个周期下自定义显示。 可以自定义年线框、年实体的阳柱、阴柱颜色。 每个年份下方,有对应的年份数字显示。 通过对比年K线,可以一目了然的分析多空趋势。
移动平均线扫描仪是一款多时间范围扫描仪,非常适合在不更改图表的情况下一目了然地查看多个时间范围内的趋势。 它最多可以在 9 个时间单位内使用您选择的 4 条移动平均线。 它是完全可配置的,只需“拖放”即可将其移动到图表上的任何位置。 移动平均线可以配置为 4 种不同的计算方法。 您还可以根据移动平均数和周期数设置警报。
MT5版本在这里。
输入参数: 筛选器布局: 允许您调整图表上显示的扫描仪的所需大小以及显示文本的大小。 移动平均线: 您可以配置 4 个不同的移动平均周期和 4 种计算方法:简单/指数/平滑和线性加权。 警报 : 要设置警报,您所要做的就是选择所需的时间范围数量(看涨/看跌)以及选择触发警报的移动平均线。 可通过弹出/推送通知和邮件发出警报。 警报文本是完全可定制的。
SPARTACUS 2024

SNR LEVEL INDICATOR Accurate Snr level indicator will only display Fresh Levels that are close to the Current Market Price. This indicator is very accurate in mapping Support & resistance levels. there is an alert feature when the price TOUCHES the SNR LEVEL, WHEN CLOSE CANDLE BREAK/REJECT SNR LEVEL.
INDICATOR MARKING :
- SUPPORT LEVEL = V SHAPE - RESISTANCE LEVEL = APEX LEVEL - GAP RESISTANCE & GAP SUPPORT = OPEN CLOSE CANDLE - SUPPORT BECAME RESISTANCE & RESISTANCE BECAME SUPPORT INDICATOR
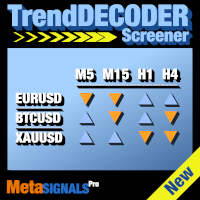
获取多种资产和多个时间单位的 TrendDECODER 信号 | 确定最佳入场时间单位 | 最大限度地提高利润和交易成功率 无重绘,无延迟指标和筛选器 - 理想的手动和自动交易 - 适用于所有资产和所有时间单位。 49美元 前50份 - 然后 99美元 购买后 请留下评论或评价 ,我们将送您价值99美元的额外指标。
这是什么?
这个筛选器是我们评价最高的 TrendDECODER 的补充工具。 它允许您: 获取 您 喜欢的资产在所有相关时间框架上的当前TrendUP和TrendDOWN信号 立即看到 最有利的时间框架 配置以获得盈利的趋势跟踪或摆动交易。
这些最有利的时间框架配置是什么?
首先,确保您设置了多时间框架图表:下级/主要/上级时间单位 其次,选择资产,其中 主要时间框架与上级时间框架的移动方向相同 。
适用于哪些资产?
这正是关键所在。 您 将选择并关注对 您 相关的资产。 特别提示: TrendDECODER筛选器也可以是检查关联资产当前是否分歧或表现正常(例如黄金和美元)的非常合成的方法。
具体如何工作以及使用

趋势线是外汇交易中最重要的技术分析工具。不幸的是,大多数交易者没有正确绘制它们。自动趋势线指标是专业交易者的专业工具,可帮助您可视化市场的趋势运动。
有两种类型的趋势线看涨趋势线和看跌趋势线。
在上升趋势中,外汇趋势线是通过价格变动的最低摆动点绘制的。
连接至少两个“最低点”将创建一条趋势线。
在下跌趋势中,趋势线是通过价格走势的最高摆动点绘制的。
连接至少两个“最高点”将创建一条趋势线。
趋势线何时突破?
当看跌蜡烛收于看涨趋势线下方并且蜡烛的高点在趋势线上方时,看涨趋势线会被打破。
当看涨蜡烛收于看跌趋势线上方并且蜡烛的低点低于趋势线时,看跌趋势线会被打破。
趋势线何时删除?
当一根完整的蜡烛在看涨趋势线下方形成时,看涨趋势线将被删除。
当完整的蜡烛在看跌趋势线上方形成时,看跌趋势线将被删除。
您可以从输入参数更改看涨和看跌趋势线的颜色和宽度。

NextCandlePredictor 指标 NextCandlePredictor 是一种带有警报的信号指标,不会重绘,不会改变颜色,不会移动,不会消失且没有延迟。它将帮助您识别任何时间框架内的下一个或即将到来的蜡烛的方向。高度推荐用于纽约、伦敦或甚至两者重叠等高波动市场。 主要特征: 时间框架的多功能性: 提供在任何时间框架内快速准确的信号,从 M1 到 H1 及更长时间。 清晰的买入/卖出信号: 使用 ADX 的 DI+ 和 DI- 线生成清晰的买入和卖出信号,确保您做出最佳的交易决策。 直观的可视化: 信号直接显示在图表上,绿色(买入)和红色(卖出)箭头,允许快速和轻松的读取。 可自定义的设置: 根据您的偏好和交易策略调整分析的柱数和警报选项。请根据您希望使用的 TF 查看下面的建议表。 即时和蜡烛收盘时的可选警报: 默认情况下,警报会在满足 ADX 条件的同一蜡烛上发出,确保信号的及时性。您还可以选择在当前蜡烛收盘时接收警报以获得更多确认。 快速性能: 设计为高效运行,理想用于高频操作和快速决策。 不重绘: 一旦信号发出,它将固定在当前蜡烛上,不会移动、改变颜色或消失。 无延

多货币和多框架买卖提醒。 自动追踪止损和风险奖励止盈! 该指标扫描并分析市场,让您无所事事! 在一张图表上交易您的所有货币!
购买后请留言联系我,我会给您发送交易助理EA。
该指标使用多个振荡器和附加的过滤器来找到最佳的已确认进入点,因此您无需担心! 它会提醒您并为您选择观察的所有时间范围和货币绘制一个按钮。 只需按下按钮即可转到图表并打开交易!
该指标还为所有基础货币和市场观察货币绘制强度面板(可在设置中调整)。这将向您显示所有货币对和选择的更高时间范围。
在指标窗口中:带有趋势过滤器的特殊 MACD 直方图和图表货币的多时间框架趋势面板!
它提供所有货币和时间范围的交易警报,只需按下按钮即可转到图表!
展示:
绿色箭头:买入信号
红色箭头:卖出信号
出现买入或卖出信号后,只需按 EA 上的 EASYTRADE 按钮,它就会为您提供自动计算的手数、止损和止盈!
检查指示器窗口中的过滤器,对于多头交易,它必须为绿色,对于空头交易,它必须为橙色!
专家顾问的设置: https://www.mql5.com/en/blogs/post/

当然可以!以下是您提供的文本的中文翻译: 引入 MT4 天文指标:您的终极天体交易伙伴 您准备好将交易体验提升到天文高度了吗?不用再寻找,就在我们的革命性 MT4 天文指标中。这个创新工具超越了传统的交易指标,利用复杂的算法提供无与伦比的天文洞察力和精确计算。 指尖上的宇宙信息: 瞻仰一个详尽的面板,展示了一宝藏般的天文数据。了解行星的地理/太阳心坐标,太阳/地球距离,亮度,伸长度,星座,黄道和赤道坐标,甚至是水平坐标——每个细节都经过精心计算并呈现得美轮美奂。指标生成的垂直线对应于时间值,为您的交易旅程提供了宇宙的视角。 行星线条与关系: 在您的图表上欣赏行星线条的魔力,具有可自定义的比例和角度。通过直观的控制面板轻松切换每个行星线条的可见性。通过连结、六分、四分、三分、对冲和逆行等指标,发现行星关系的艺术。在您选择的时间范围内探索这些宇宙构造,使您能够识别重要的交易机会。 揭示甘恩的智慧: 通过受甘恩启发的平方垂直线揭示潜在的反转时机。这种创新修改将甘恩历经考验的原则带入现实,帮助您提前了解市场的转向和趋势。 月亮引导: 在您的图表上优雅地导航月相,因为新月和满月点缀其间。月亮周期

RSI Divergence Full +10 other divergence indicators
Contact me after payment to send you the User-Manual PDF File. Download the MT5 version here. Also you can download the >>> Hybrid Trading EA <<< that is designed and implemented based on RSI Divergence Indicator. RSI is a pretty useful indicator in itself but it's even more effective when you trade divergence patterns with that. Because the divergence signal of the RSI indicator is one of the most powerful signals among the indicators. D

该仪表盘可根据您对所选符号的交易策略,以剥头皮和长期模式在图表上发现并显示供需区。此外,仪表盘的扫描模式可帮助您一目了然地检查所有需要的符号,不错过任何合适的仓位/ MT5 版本
免费指标: Basic Supply Demand
功能 允许您查看多个货币对的交易机会,为您提供所有货币对的清晰简明视图,并根据其与供需区的接近程度进行排序 可定制设置,从颜色到检测参数,满足您的特定需求
主要输入 Indicator mode : 选择指标模式或具有新功能的面板模式 Symbols : 从 "28 种主要货币对 "或 "选定符号 "中进行选择 Selected Symbols : 您希望监控的符号,用逗号分隔("EURUSD,GBPUSD,XAUUSD")。如果您的经纪商对货币对有后缀或前缀,您必须在以下两个参数中添加(货币对前缀或货币对后缀) Trading Style : 选择剥头皮或长期模式 Allowed Deviation : 该参数允许修改需求或供应区域的精确度(数值越小,精确度越高) Zone thickness : 通过该参数可以修改需求和供应
The Controversial 5-Step System That Professional Traders Use To Unlock Trading Success!
Reversal Pro effectively combines price action, ideal location and reliable statistics in one smart algorithm. Understanding the market in this unique perspective allows you to recognize reversals professionally.
Discover The Secret Of Professional Traders
Get instant access www.mql5.com/en/blogs/post/716077 Copy & Paste what professional traders are doing right now!
How To Trade Step 1: Trade Setu

Correct market entries and exits are essential for any Forex trader. MasterArrow indicator addresses this issue. It has no redundant elements and draws only buy/sell arrows. The up arrow is a BUY signal, while the down arrow is a SELL one. The indicator is simple to configure. Change the Strength parameter to configure the signals frequency. The product is based on standard indicators (MA, RSI, ATR, etc.). But it also features the custom algorithm allowing to combine them into a single tool and
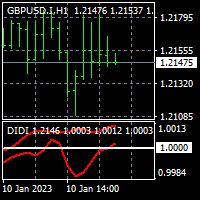
To get access to MT5 version please click here . - This is the exact conversion from TradingView: "Didi Index" by " everget ". - This is a popular version of DIDI index on tradingview. - This is a light-load processing and non-repaint indicator. - Buffer is available for the lines on chart and arrows on chart. - You can message in private chat for further changes you need. Thanks for downloading

Volatility Vision: Essential for Forex and Stock Markets
发现Volatility Vision:您的交易革命 完美适合初学者和专业交易者 简单入门指南: 通过我们的 用户手册 ,学习如何有效使用它。
Volatility Vision 指标是一个强大的工具,可以在您的图表上精确描绘波动率水平。这个多功能工具是整合到您的交易策略中必不可少的,兼容所有货币对和股票市场。 利用 波动率阈值 ,自信地管理您在一周内的交易。 Volatility Vision的优势 增强准确性: 显著减少了常见于随机振荡器的误报。 早期信号: 比RSI更早捕捉交易信号,帮助您抓住错失的机会。 市场领先: 在MACD响应之前提供前瞻性见解。 可靠性: 避免了CCI常见的误信号陷阱。 轻松配置 输入ATR值以开始(默认值为15)。所有级别都是固定的,以保持一致的分析;切换时间框架以刷新数据。 指标指南 蓝线: 每日波动率。 红线: 每周波动率。 橙线: 每月波动率。 将Volatility Vision与传统的ATR结合使用,以获得更多战略机会。今天就

Market Structure Patterns is an indicator based on smart money concepts that displays SMC/ICT elements that can take your trading decisions to the next level. Take advantage of the alerts , push notifications and email messages to keep informed from when an element is formed on the chart, the price crosses a level and/or enters in a box/zone. Developers can access the values of the elements of the indicator using the global variables what allows the automation of trading
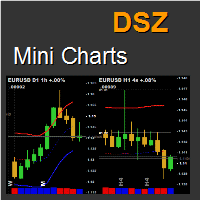
This indicator displays a bar chart for any time period and symbol. It allows to implement "top-down" investment approach. Charts have many features including unique statistical bands, rounded numbers, pivots, the elapsed time count, information about orders, change chart by clicking, saving and loading graphic objects and many others.
Key Futures Up to 9 chart per row. Unlimited number of instances. Symbol and timeframe freely adjustable for every chart. Moving Averages that have a unique met

获取下一个反转走势信号 | 优化收益率统计 | 获取价格将测试的区域 非重绘、非延迟指标 - 手动和自动交易的理想选择 - 适用于所有资产和所有时间单位 限时优惠 >> 50% OFF 购买后, 请联系我的频道 获取推荐设置
剥了头皮就跑!
有了BladeSCALPER,你将在那些更可预测的M&W走势中分得一杯羹
只要把它插在你最喜欢的资产上,抓住那几个点,然后从人群中跑开。
为了什么?
你将发现的最可预测的模式是 "双顶 "和 "双底",通常被称为 "M "和 "W",因为这个字母明确表示了这些运动。
BladeSCALPER是一个新思路的集合,使其剥头皮更容易、更简单。
有了ScalpUP/ScalpDOWN信号--你就会得到下一个可能的移动信号 使用PowerZONE - 立即获得价格可能走向的区域 使用RewardBOX - 根据PowerZONES设置TP1/TP2/TP3。 使用StatsPANEL - 检查一段时间内M/W模式的收益率 使用MovingAverageFILT

Two Period RSI + Alerts compares long-term and short-term RSI lines, and plots a fill between them for improved visualization. Fill is colored differently according to an uptrend (short period RSI above long period RSI) or a downtrend (short period RSI below long period RSI). Short-term RSI crossing long-term RSI adds a more robust trend confirmation signal than using single period RSI alone. This is a tool to help visualize and confirm RSI trends. We hope you enjoy!
Alerts Email, message, and

"HOW TO TRADE ANY CURRENCY PAIR WITH UNUSUAL PRECISION & PROFITABILITY!"
Buy Forex Trend Commander Indicator And You Will Get Trends Reversing PRO Indicator for FREE !
It's no secret that most traders reset their accounts. However, there are exceptions... Awesome exceptions! Successful traders "make money" every month. You really only need two things: good indicator for sure and proper money management. One indicator to work with Trending, Sideways and Volatile Markets. Proper money mana

THE ONLY CURRENCY STRENGTH INDICATOR THAT IS BASED ON PRICE ACTION. DESIGNED FOR TREND, MOMENTUM & REVERSAL TRADERS
This indicator reads price action to confirm trend and strength . Advanced multi-currency and multi-time frame indicator that shows you simply by looking at one chart, every currency pair that is trending and the strongest and weakest currencies driving those trends.
For full details on how to use this indicator, and also how to get a FREE chart tool, please see user manual HER

** All Symbols x All Timeframes scan just by pressing scanner button ** *** Contact me after the purchase to send you instructions and add you in "Trend Reversal group" for sharing or seeing experiences with other users. Introduction: Trendlines are the most famous technical analysis in trading . Trend lines continually form on the charts of markets across all the different timeframes providing huge opportunities for traders to jump in and profit on the action. In the other hand, The tr

Vega indicator
The indicator is created for M1.
Rare and safe signals.
Success!
Notă Dacă indicatorul nu este afișat, adăugați indicatorul TMA+CG mladen NRP în folderul Indicatori.
Îl puteți descărca de pe linkul https://forex-station.com/app.php/attach/file/3311524
Dar lăsați-l să fie la prima descărcare.
Apoi atașați indicatorul Vega la diagramă.
IMPORTANT! Verificați mai întâi indicatorul sau expertul pe un cont DEMO, înainte de a-l cumpăra! Analizați-l bine!
Închiriați-l

Was: $299 Now: $99 Supply Demand uses previous price action to identify potential imbalances between buyers and sellers. The key is to identify the better odds zones, not just the untouched ones. Blahtech Supply Demand indicator delivers functionality previously unavailable on any trading platform. This 4-in-1 indicator not only highlights the higher probability zones using a multi-criteria strength engine, but also combines it with multi-timeframe trend analysis, previously confirmed swings

The Supply and Demand with Swap zones MTF indicator is a powerful tool for technical analysis that has been modified and enhanced to provide traders with even more valuable information. This tool is based on the rule of supply and demand and allows traders to analyze a chart on three different timeframes at once, providing a more comprehensive view of the market. One of the key features of this indicator is the so-called swap zones, which are areas that have been broken through by the price but

It is based on Multiple EMA indicators. The idea is that how to display multiple Exponential Moving Averages on the chart easily without placing them one by one. It has also BLUE-RED trend lips to define UPTREND and DOWNTREND whichas BLUE is UPTREND and RED is DOWNTREND.You can change the colors by going to Indicator properties --- colors. There are 2 external setting. They are Period and Shift. When you change them (period and or shift ) then all will automatically adjust. For any currency pair
This indicator is unstoppable when combined with our other indicator called Market Analysis . After purchase, send us a message and you could get it for FREE as a BONUS! SPECIAL OFFER: $39 for this WEEK only! Original price is: $80
Trend Swing is a professional indicator that is developed from scratch by our in-house development team. This indicator is very sophisticated because you can see the entry price levels with buy and sell signals that are given in real-time!
It automati

随机振荡器的多货币和多时间框架修改。 您可以在参数中指定任何所需的货币和时间范围。 该面板显示当前值和线的交点 - 信号线和主线(随机交叉)。 此外,该指标还可以在跨越超买和超卖水平时发送通知。 通过单击带有句点的单元格,将打开该符号和句点。 这是 MTF 扫描仪。 与货币强度计类似,仪表板可以自动选择包含指定货币的货币对,或以该货币为基础货币的货币对。该指标在“货币对集合”中指定的所有货币对中搜索货币;其他货币对将被忽略。并根据这些货币对计算该货币的总随机指标。您可以看到该货币的强弱程度。
默认情况下,从图表中隐藏仪表板的键是“D”。
参数 %K Period — K 线的周期。 %D Period — D 线的周期。 Slowing — 放慢; Method — 平均法; Price field — 价格类型。 Line of indicator — 线索引。 Clear the chart at startup — 启动时清除图表。 Set of Pairs — 符号集: — Market Watch — 来自“市场观察”的配对。 — Specified man

介绍 Advanced SR 指标。这是一个帮助您在图表上确定最重要的关键级别的指标。
您的问题:
您不确定如何准确地确定重要的价格区域。 您正在绘制供需区或支撑阻力区,就像其他99%的交易员一样。 您认为您绘制的供需和支撑阻力区没有效果。 您对入场和出场点的安全性感到不确定。 Advanced SR 将解决所有这些问题。该指标采用了利用交易量来确定关键级别和重要价格区域的算法,这些区域是大市场参与者进行重要交易的地方,您可以快速地确定重要的价格区域。只需仅仅依靠这些关键级别,您就可以轻松地制定自己的交易策略。
***购买此指标,即可获赠80%胜率的高级扩展策略。请通过私信与我联系!***
Advanced SR 指标将在价格接近关键级别时提供警报,让您随时准备好在该位置进行交易。它适用于新手交易者和专业交易者。
支持渠道: 点击这里 MT5 版本: 点击这里
推荐的扩展设置:
IndicatorName = "Advanced S&R"; Comment_1 = "=========指标设置==========="; Timeframe = H1; SR
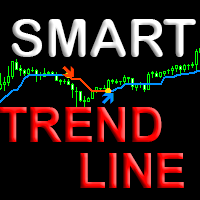
Indicator with an innovative algorithm for determining the direction of the trend. Shows the best results for determining the trend on any currency pairs, stocks, cryptocurrency without redrawing the result. It will help you immediately determine the profitability of the current pair and timeframe. Uses Price action patterns in conjunction with the author's unique algorithm. Suitable for both beginners and professionals for all types of trading. How to choose a profitable timeframe and optimize

Simple trend is a professional version of the trend indicator and entry points. It uses Price action and a unique filtering algorithm to determine the trend. Shows the change in the direction of price movement on any currency pairs, without redrawing the result. Suitable for determining entry points for scalping and swing, as well as for intraday, medium-term trading. Features Marks trend reversal locations and directions. Suitable for all types of trading, in any markets. Allows you to enter

Contact me after payment to send you the User-Manual PDF File. ADVANCE PRICE ACTION TRADING CONCEPT. To test the indicator, you can download the demo version on my product list. it’s free (only shows patterns that have occurred in the past of the market). Quasimodo is a reversal trading pattern that appears at the end of an uptrend. As a price formation, the Quasimodo pattern is depicted by three peaks and two valleys, where: First, the middle peak is the highest, while the outside two peaks


节省时间,通过Sweet VWAP Aux做出更明智的决策 如果您还没有下载我们的 Metatrader 4免费VWAP指标 ,请立即下载并尝试其惊人的VWAP定位功能。然后回到这里,了解Sweet VWAP Aux - 您的Sweet VWAP指标的完美扩展。 通过只需点击一次,Sweet VWAP使您能够固定VWAP指标在您选择的位置上,从而节省时间并消除手动配置的需求。此外,该指标提供有关大型机构进行操作和定位订单的重要点的有价值信息,使您能够做出更明智的决策并制定自己的交易策略。 不要再浪费时间手动配置您的锚定VWAP。现在购买Sweet VWAP Aux指标,将您的市场分析提升到新的水平。这是任何希望在金融市场上获得成功的严肃交易者的有价值投资。 立即下载免费的Sweet VWAP,尝试其在您图表上不同定位点的VWAP可视化功能。然后回到这里,确保您的Sweet VWAP Aux,将您的交易带入新的水平。抓住这个独特的机会,成为成功交易者的一员。 限制 当您在同一图表上使用EA单击插入新的锚定VWAP时,出于安全原因,EA将被暂时禁用,您需要稍后手动启用它。 了解更多关于我们

FxBears Powers 致力于所有外汇对、金属、商品、期货、指数、能源、加密货币以及所有……以及从 M1 到 MN 的所有时间范围.........。
它基于供需和一些内部指标,它为您提供了一个非常强大的切入点,大部分时间为 0,您可以在测试中验证这一点..............。
它会立即在您的手机平台上向您发送信号,包括货币对名称、时间、时间范围、买入或卖出, 入场点、SL 和 TP....。
它在图表上为您提供卖出或买入箭头和 3 条线:TP、SL、入场点。 带有声音的即时通知。 输入没有复杂性,对于初学者和专业人士来说非常简单。 不重绘,不重绘。 使用此指标不再有损失,多年前对其进行测试,看看某一天的结果是否有损失......。

Step into the realm of Forex trading with confidence and precision using XQ, a cutting-edge Forex indicator designed to elevate your trading game to unprecedented heights. Whether you're a seasoned trader or just stepping into the world of currency exchange, XQ Forex Indicator empowers you with the insights and signals needed to make informed trading decisions. The signal conditions are a combination of three indicators, and XQ Forex Indicator only display medium and long-term trends . The

"The Squeeze indicator attempts to identify periods of consolidation in a market. In general the market is either in a period of quiet consolidation or vertical price discovery. By identifying these calm periods, we have a better opportunity of getting into trades with the potential for larger moves. Once a market enters into a "squeeze," we watch the overall market momentum to help forecast the market direction and await a release of market energy." Modified TTM Squeeze Indicator is a modifica

50% off. Original price: $60 Triangle Finder is a multi symbol multi timeframe dashboard that monitors and finds symmetrical triangle pattern in 28 symbols and 9 timeframes with a deep scan feature to scan all market watch symbols (up to 1000 instruments!).
Download Demo here (Scans only M1 and M5) Settings description here MT5 version here
Triangle Finder features: Realtime monitoring of 28 customizable instruments and 9 timeframes at the same time. Deep scan mode to scan all market w

The balance of supply and demand is a simple and effective market analysis method. The supply and demand diagram can show you in advance, even before the trend reversal, where the supply ends and the demand is already emerging, where the demand ends and the supply is emerging, while substantially increasing the probability of making a deal in the right direction and with a high profit factor.
Indicator Signals The indicator uses the price/volume values to generate signals: ED – excess demand.

BPS BoS - Break of Structure
BoS - Fractal mode , MTF
BoS - Zigzag mode , MTF
Show HH and LL
Alerts - Popup , Push notification and eMail Option to create screenshot on alert Enable / Disable Indicator with a button on chart to select options
Choose corner of button location
It is not a system but a indicator to help identify break of structure points
MT5 version here : https://www.mql5.com/en/market/product/84734?source=Site+Profile+Seller
Other Indicators : https://www.mql5.

支撑和阻力筛选器是 MetaTrader 的一个级别指标,它在一个指标内提供多种工具。 可用的工具有: 1. 市场结构筛选器。 2. 看涨回调区。 3. 看跌回调区。 4.每日枢轴点 5.每周枢轴点 6. 每月枢轴点 7. 基于谐波形态和成交量的强大支撑和阻力。 8. 银行级区域。 限时优惠:HV 支撑和阻力指示器仅售 50 美元且终生可用。 (原价 125$)
您想尝试不受 Metatrader Backtester 限制的指标吗? 单击此处下载演示版本。
主要特点
基于谐波和音量算法的强大支撑和阻力区域。 基于谐波和成交量算法的看涨和看跌回调区域。 市场结构筛选器 每日、每周和每月的枢轴点。
文档
所有支持和阻力筛选器文档(说明)和策略详细信息均可在我们 MQL5 博客的这篇文章中找到: 单击此处。
接触 如果您有任何问题或需要帮助,请通过私信联系我。
作者
SAYADI ACHREF,金融科技软件工程师,Finansya 创始人。
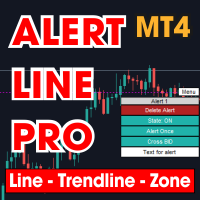
This is MT4 version , MT5 on this link : Alert Line Pro MT5 Alert line pro allows to make alert when price cross these objects: Horizontal lines Trendline Price Zone (Rectangle) Alert when close current bar (have new bar) When the price crosses the alert lines, the software will sound an alarm and send a notification to the MetaTrader 4 mobile application. You need to settings your MetaQuotes ID of MT4 apps to MetaTrader4 software to get notification to the mobile phone. Sound files must be

Cyclical indicator for trading and predicting the direction of the market. Shows the cyclical behavior of the price in the form of an oscillator.
Gives signals for opening deals when rebounding from the upper and lower boundaries of the oscillator. In the form of a histogram, it shows the smoothed strength of the trend.
Will complement any trading strategy, from scalping to intraday. The indicator does not redraw. Suitable for use on all symbols/instruments. Suitable time frames for short-term

There is No use in the Testing Demo. You will understand nothing from running flashing numbers. It is a Dashboard. Just try to understand idea, get it and I will help in everything further. Symbols must be separated by commas (,) and entered into the parameters exactly as displayed by your broker to ensure they are recognized in the dashboard. These symbols will be used for analysis by the indicator.
With one click open any pair any timeframe directly from dashboard The MA Speedometer Dashboar

The market price usually falls between the borders of the channel .
If the price is out of range , it is a trading signal or trading opportunity .
Basically, Fit Channel can be used to help determine overbought and oversold conditions in the market. When the market price is close to the upper limit, the market is considered overbought (sell zone). Conversely, when the market price is close to the bottom range, the market is considered oversold (buy zone).
However, the research can b
您知道为什么MetaTrader市场是出售交易策略和技术指标的最佳场所吗?不需要广告或软件保护,没有支付的麻烦。一切都在MetaTrader市场提供。
您错过了交易机会:
- 免费交易应用程序
- 8,000+信号可供复制
- 探索金融市场的经济新闻
注册
登录