适用于MetaTrader 4的付费技术指标 - 107

The Avia indicator analyzes the chart as a mathematical function with X-time and Y-price axes. Time is represented in bars and price in pips. The purpose of this indicator is to give the trader a signal to act at the moment when the function forms a recoilless movement in one direction over a certain period of time. Here are the main characteristics and settings of this indicator:
Peculiarities: Non-rebound movement : The Avia indicator looks for moments when the price moves in one direction

The " Vertical Levels " indicator for the Forex market is a tool for displaying vertical levels on a price chart. These levels can be useful for a trader, as they help identify significant points in price movement and potential reversal or trend continuation zones.
Peculiarities:
Vertical Levels: The "Vertical Levels" indicator allows you to display vertical lines on the chart, indicating certain levels. These levels can be adjusted using input parameters. Setting options: Length : Length o

Retracement Reversal and Support and Resistance Pro (for non pro version Click here ) is based on a formula used by Proprietary trading firms and other big institutions on WallStreet including on my Company and used by my traders here in the capital of the world. This indicator will create Red and Green arrows on a possible mayor Retracement level, Reversal Level and future Support and Resistance levels and Yellow arrows on a possible m i nor Retracement level, Reversal Level and future Suppo

Our support and resistance levels help to determine the reversal of the market price, fully track the trend, and also fix the profits in a timely manner. Support and resistance levels can also determine trading ranges. When you hover your mouse over the upper right corner of a level, a hint with a description of the level pops up. To avoid cluttering the chart, levels disappear after breaking through.
Input parameters: WPR_Period = WPR period UpLevel = WPR top l
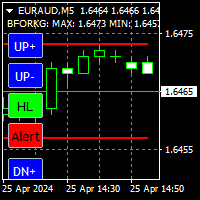
Very useful indicator, you won't be able to be without it. Essential for scalping. It shows rebound levels, top and bottom, forming a fork that surrounds the price. Each level has two blue controls associated to change it, has one green control for rebound mode: High/Low or Open/Close, and has a red breakage alert control. The values of each level, and the distance between levels in pips, are shown at the top left. Features: -T wo independent modes of operation: High/Low, Open/Close. -When on
The indicator for Forex and Binary Options trading is based on the standard Mt4 Simple Moving Average indicator. But the difference from the standard indicator is that its lines are repainted in different colors depending on the state of the trend. If the color is green, then the trend is to buy. If it's red, then it's for sale. During a trend phase change, an audio alert appears along with a buffer on the chart in the middle of the lines. Thus, it is possible to determine the state of the trend

UPDATED VERSION INCORPERATES FIBONACCI FOR BETTER LEVELS AI Powered Price Clustering" is a custom indicator that integrates k means and Fibonacci. This powerful tool provides traders with valuable insights into price clustering patterns, facilitating more informed trading decisions. How it works: With "AI Powered Price Clustering," traders gain access to: A K means algorithm for precise analysis of price clustering patterns. Identification of key Fibonacci levels and centroids for enhanced tech
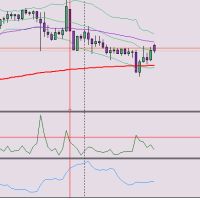

The Practitioner indicator is based on a unique algorithm for analyzing price behavior and presents the result of this complex work in the form of lines. One of the advantages of this indicator is that it automatically changes the color of the line according to the current direction of the price movement.
It is important to note that the indicator has an option to enable alerts when the line color changes. This gives the trader the opportunity to quickly respond to changes and identify new tr

Indicator Name: TrendMaster Description: TrendMaster is a powerful NONREPAINT Trading indicator designed to identify and capitalize on market trends with high accuracy. By analyzing a combination of technical indicators including Relative Strength Index (RSI), Stochastic Oscillator, and Average Directional Index (ADX), TrendMaster provides clear buy and sell signals, helping traders navigate both bullish and bearish market conditions. The indicator's advanced algorithm filters out noise and fals

The EntryHub system by MQ4.org is designed for Forex trading and is available as an indicator for the popular MetaTrader 4 (MT4) platform. Let’s delve into its details: Forex Entry Point System : The Forex Entry Point System is an MT4 indicator that assists traders in identifying potential entry points for their trades. It provides signals based on specific market conditions, helping traders make informed decisions. While it’s essential to note that no indicator is fo

The RSI Advanced tool will help traders capture trends and optimal entry points by:
- Enter a Buy order when the green line crosses the yellow line. Provided that the yellow line is near line 32 or 20 - Enter a Sell order when the green line crosses the yellow line. Provided that the yellow line is near line 68 or 80
Additionally, you can combine it with the convergence divergence that occurs at the green line. **When you purchase the Mastering the RSI MT4 or Mastering the RSI MT5 indicator

SmartSignal Sniper:您的终极交易伴侣 发掘精准交易的力量,使用SmartSignal Sniper。这款先进的工具旨在提供准确的买入和卖出信号,让所有级别的交易者在金融市场上自信而清晰地操作。 主要特点: 精准度高: SmartSignal Sniper利用先进的算法提供精准的买入和卖出信号,帮助交易者识别市场上的利润机会。 执行速度快: 通过实时信号生成,SmartSignal Sniper立即提醒您潜在的交易机会,为您提供了竞争优势,帮助您做出明智的决策。 可定制参数: 使用可定制参数调整SmartSignal Sniper以适应您的交易偏好,让您适应各种市场条件和交易风格。 用户友好界面: 设计简单易用,SmartSignal Sniper拥有直观的界面,使得交易对于各个级别的交易者都变得轻松高效。 为什么选择SmartSignal Sniper? 明智决策: 使用SmartSignal Sniper最大程度地发挥您交易策略的潜力,为您提供有价值的市场见解,而不是保证利润。 节省时间: 摆脱手动分析的烦恼。通过SmartSignal Sniper,优化您的交易流
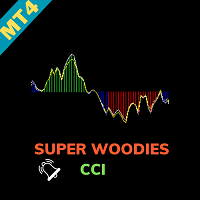
Super Woodies CCI Indicator - Enhance Your Trading Precision Step into the realm of precision trading with the "Super Woodies CCI Indicator" for MetaTrader 4. This advanced tool, inspired by Woodie's CCI, is designed to provide you with clear insights into market trends, enabling you to make well-informed trading decisions. Basic Details : Indicator Type : Super Woodies CCI Indicator Key Metrics : Real-time CCI (Commodity Channel Index) analysis for price trends. Customization : Fully customizab

Adaptive Market Dynamics Indicator (AMDI) is an innovative tool for traders across all financial markets. This indicator is designed to provide traders with a deep understanding of market dynamics and adaptive trading signals based on current market conditions. Key Features and Benefits: Adaptive Analytics : AMDI can automatically adapt to changing market conditions, allowing traders to effectively adjust their strategies in real-time. Multifactor Analysis : The indicator offers a comprehensiv

OVERVIEW
K-means is a clustering algorithm commonly used in machine learning to group data points into distinct clusters based on their similarities. While K-means is not typically used directly for identifying support and resistance levels in financial markets, it can serve as a tool in a broader analysis approach.
Support and resistance levels are price levels in financial markets where the price tends to react or reverse. Support is a level where the price tends to stop falling
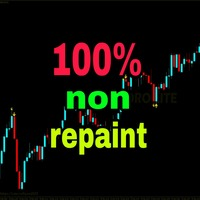
'Zoro LITE' is a reversal strategy based MT4 indicator with advance pre-alert system. Its an 100% non repaint indicator with an average accuracy of about 70-95% in a ranging market. --------------------------------------------------------- Features: Neural Network based Advance price action algorithms Pre-alert (get ready) signals Non-delay indications 24/7 signals OTC markets supported Auto-trading supported 100% Non repaint 100% No lag No recalculating Lifetime license -----------------------
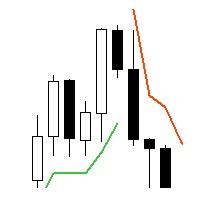
Supertrend - невероятно мощный и универсальный индикатор, предназначенный для помощи трейдерам в определении текущего тренда на конкретном торговом инструменте. С помощью двух встроенных индикаторов, Average True Range и Standard Deviation, трейдеры могут выбрать наиболее подходящий индикатор для своей стратегии торговли. Пользователи также могут настроить период этих индикаторов и выбрать цену (Close, High, Low, Open, Weighted), к которой он должен быть применен, с Typical price в качестве опци

Trop is a trend indicator that has several important advantages. It helps to pinpoint both new and existing trends in the market. One of its key advantages is its quick adjustment and responsiveness to changes in schedule. The effectiveness of the indicator depends on the set CalcBars period. The longer this period, the smoother the indicator displays the trend line. On the other hand, as the period decreases, the indicator takes into account more market noise, which can be useful in generating

In the world of trading, one of the main concerns is finding a reliable trading system. Meet the TrendEdge Channel indicator - your reliable companion in this search. Developed based on complex mathematical calculations, this indicator predicts the most likely short-term price movements.
TrendEdge Channel is designed specifically to identify trends in price movements. Thanks to it, you can quickly determine not only the direction of the trend, but also the levels of interaction between buyers

The TrendScope Pro indicator views the chart as a function with the X-axis representing time and the Y-axis representing price, expressed in bars and pips respectively. The main objective of the indicator is to provide users with signals for actions when the function forms continuous movement in one direction over a specific period of time. The indicator parameters need to be adjusted individually for each currency pair, as the price function varies for different pairs.
The indicator provides

Spread Pulse 指标是一种有效的工具,可为交易者提供有关图表上当前点差的信息。 点差是一种工具的买入价和卖出价之间的差额。
该指标以图表上显示的文本形式呈现。 这使得交易者可以轻松跟踪当前的点差。
Spread Pulse 指标的主要优点之一是其颜色可视化。 根据跨页大小,文本颜色会发生变化。 默认情况下,当点差较小时,文本将为绿色,这意味着点差较低,交易可能会更有利可图。 然而,当点差变高时,指示文字会自动变为红色。
此外,用户还可以自定义与高差和低差相关的颜色。 您还可以更改字体大小以使信息更易于阅读。
Spread Pulse 指标对于任何交易者来说都是理想的选择,无论经验水平和交易策略如何。 它可以快速、轻松地访问有关当前点差的信息,帮助交易者做出明智的决策并改善交易结果。
如果您发现该指标有用,请留下评论。 您的意见对我们非常重要,将帮助我们使指标变得更好。
选项 Spread size - 确定文本颜色的展开大小。 如果跨度大于跨度大小值,则文本为红色(默认情况下)。 当价差较高时,颜色为绿色。 High spread - 价
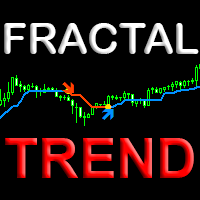
The Fractal Trend indicator visually displays trend changes in price fractals based on the Price Action (PA) principle. The unique algorithm uses the fractal principle of determining a trend change and a new proprietary method of filtering fractals, which gives an advantage in relation to other similar indicators based on MA moving averages. This new approach to trend determination helps to determine with high confidence the trend change points on any financial instrument and on any time frame

The SignalSailor indicator is your reliable assistant in Forex for quick market analysis. It not only reflects the current market condition but also provides valuable signals about the best times to open trades. Market conditions are constantly changing, and to stay ahead, a trader needs to quickly adapt their strategies. This is precisely why the Klaus indicator was created - it will help you accurately determine the direction of the trend on the price chart.
SignalSailor is an indispensable

The TrendTide indicator provides accurate signals about potential market reversals. Its primary purpose is to generate signals for entering and exiting trades. Determining the current market trend is a critically important aspect for traders. The intelligent algorithm of TrendTide efficiently identifies trends, filters market noise, and creates precise entry and exit signals.
This indicator represents an advanced algorithm for visualizing the market trend. It is designed to identify both long

The Market Sentiment Meter indicator calculates the saturation levels of the price chart. A signal to exit the oversold zone indicates a buying opportunity, and a signal to exit the overbought zone indicates a selling opportunity. Typically, for this indicator you need to set relative values for the overbought (Top) and oversold (Bottom) levels.
Often a good trend can be seen visually on the price chart. However, an experienced trader must clearly understand the current distribution of forces

USDLFX is a currency index of US dollar formulated by LiteForex broker. It is an attempt to create an indicator for USD currency power. The idea has been further extended to other major Forex currencies. These indices are not available on other brokers. There are other currencies AUD CAD EUR CHF GBP NZD JPY Thanks to this indicator, you have an objective view of the selected currency

TrendTrack indicator: Stay on trend easily!
The TrendTrack indicator is designed to analyze price behavior in the Forex market, helping the trader to quickly spot temporary weaknesses or obvious changes in trend direction. Entering the market is only the first step, but maintaining a position is more difficult. With TrendTrack, staying on trend becomes easy!
Peculiarities:
Trend Analysis: The indicator analyzes historical data, providing signals to the trader. The arrow format of the indi

The Trendline Trader indicator is designed to reliably track market trends, ignoring sharp fluctuations and noise in the market. This indicator is suitable for trading on both short and long time intervals due to its ability to filter out sudden price spikes and corrections. It is based on the iLow, iHigh, iMA and iATR indicators, which makes it particularly reliable.
Parameters for setting up the indicator: Length: period for channel calculation and noise filtering. Star: period for determin

History VT Информационный индикатор. Показывает на графике, сразу после открытия сделки, стрелку именно на той японской свече, где позиция открыта.
То есть там, где появилась штрихпунктирная линия открытой сделки, в терминале.
Далее, после открытия сделки, как обычно, трейдер ставит SL и TP и ждёт итога своего выбора направления движения.
После того как сделка закрылась, по « sl » или « tp » или «вручную», индикатор отображает на графике уровни и текстовые сноски параметров сделки.
С

Introduction
One of the patterns in "RTM" is the "QM" pattern, also known as "Quasimodo". Its name is derived from the appearance of "Hunchback of Notre-Dame" from Victor Hugo's novel. It is a type of "Head and Shoulders" pattern.
Formation Method
Upward Trend
In an upward trend, the left shoulder is formed, and the price creates a new peak higher than the left shoulder peak . After a decline, it manages to break the previous low and move upward again. We expect the pric
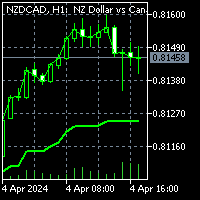
To get access to MT5 version please click here . This is the exact conversion from TradingView: "G-Channel Trend Detection" by "jaggedsoft". This is a light-load processing and non-repaint indicator. You can message in private chat for further changes you need. All input options are available. Buffers are available for processing within EAs. Highlight option is omitted as does not show good in Metatrader.

Forex Gump Advanced 是一種基於一個指標的現成交易策略。 Forex Gump Advanced 是一個向交易者顯示何時開倉、開倉方向以及何時平倉的指標。 Forex Gump Advanced 在圖表上以清晰的形式顯示所有必要的資訊。此指標適用於所有時間範圍和所有貨幣對。
此指標的優點: 完全準備好的交易系統 不重繪 在 95% 的情況下,價格朝著訊號的方向發展。 5% 的訊號不起作用並虧損平倉。
指標設定: period_analysis = 指標週期 bars = 將顯示指標的柱數 Thickness_of_thick_line - 粗線的粗細 Thin_line_thickness = 細線厚度 Signal = 向 EMAIL 和 PUSH 發送訊號

APP System Signals 是专为金融市场上活跃交易者设计的复杂指标。它基于先进的技术分析提供精确的买入和卖出信号,使交易者能够做出明智的决策。该指标使用指数移动平均线(EMA)、简单移动平均线(SMA)和基础趋势的组合生成可靠的信号。参数完全可定制,允许交易者根据自己的交易策略调整指标。此外,该指标易于使用,对于所有经验水平的交易者来说都是一种必不可少的工具。无论您是初学者还是经验丰富的交易者,APP System Signals 都可以帮助您提高交易绩效,并在市场上做出更明智的决策。 这一指标的设计旨在满足交易者对市场的各种需求。它的灵活性使得交易者可以根据个人偏好和风险承受能力进行调整,从而更好地适应不同的市场条件。与此同时,APP System Signals 的可视化界面简单直观,使得即使是初学者也能轻松上手。这种简单性不仅提高了交易效率,还为交易者提供了更多的时间来分析市场并做出更明智的决策。 总的来说,APP System Signals 是一款功能强大且易于使用的交易工具,适用于所有类型的交易者。无论您是在寻找新的交易机会还是希望提高交易效率,这一指标都能够满
Based on unique formulas and calculations, this indicator analyses every price move on the chart then applies its unique formulas on them to indicate the currently dominant direction. This indicator works on all instruments but best with GOLD (XAUUSD). It can also work as an entry confirmation tool and can also serves highlighting the worthy and noticeable moves on the chart. The Oppo Signals Indicator can work alongside any other strategy and can also help traders devise their own strategies u

The indicator is based on the calculation of liquidity on the market and thus shows where the market can most likely turn.. It shows the places of liquidity where the price will reach sooner or later... The indicator can be set to several types of liquidity and therefore can display several levels on the graph.. It is a unique tool that can help you very well in your trading The indicator is suitable for currency pairs with the most liquidity (EURUSD/GBPUSD...)

Once upon a time, in the bustling streets of Gotham City, there lived a mysterious figure known only as the Joker. With his enigmatic grin and unpredictable nature, the Joker roamed the city's financial district, leaving chaos and uncertainty in his wake. One fateful day, a group of traders stumbled upon a peculiar artifact hidden deep within the dark alleys of Gotham. It was a cryptic indicator known as the "Joker Arrow," rumored to possess the power to predict market movements with uncanny acc

第一部分:特性 集成画线和波浪标记功能 画线过程中自动吸附(即自动搜索高/低) 同时绘制折线和斐波那契回调和 斐波那契扩展 计算区间跨度( 简称Qjt )的比率 通过单击连续删除对象 批量删除画线对象 显示/隐藏画线和波浪标记 快速将当前图表作为图片保存到本地某个文件夹 通过点击价格轴的特定区域或按热键W显示/隐藏主面板 按热键Q切换面板 自动隐藏主面板 通过点击 价格轴 的特定区域绘制价格检测范围 通过热键Z和X快速切换到上下周期
第二部分:绘图 (1) .画线类型 折线 Fibo 水平趋势线 区间线 时空网格 (2).设置线条颜色、样式和宽度 要设置线的颜色内置或样式和宽度,只需点击某些按钮 当按下第二行中间一个颜色按钮时,调出颜色选择面板设置自定义颜色 (3) .开始画线 如果你没有按下任何绘图类型按钮(HL/Rng/Net/Fibo),当你选择线条颜色按钮或线条样式按钮或线条宽度按钮时,它将默认绘制折线 当您正在绘制折线或区间线时,您可以按Fibo按钮,它将同时绘制 斐波那契回调和 斐波那契扩展 如果您想绘制可以精确定位 吸附 在最高价和最低价的画线,您可以在绘制时按下A
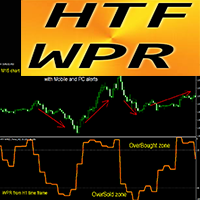
适用于 MT4 的强大外汇指标 HTF WPR 振荡器
使用适用于 MT4 的专业 HTF WPR 振荡器升级您的交易方法。 HTF 意味着 - 更高的时间范围 WPR 是倒卖的顶级振荡器之一 该指标非常适合具有来自超卖/买入区域的价格行为条目的多时间框架交易系统。 HTF WPR 指标允许您将较高时间范围的 WPR 附加到您当前的图表 --> 这是专业的交易方法 指示器内置移动和 PC 警报
// 这里提供更多优秀的 EA 交易和指标: https://www.mql5.com/en/users/def1380/seller // 也欢迎您加入盈利、稳定、可靠的信号 https://www.mql5.com/en/signals/1887493 它是仅在该 MQL5 网站上提供的原创产品。
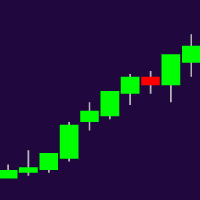
Higher Timeframe Chart Overlay will display higher timeframe candles, including the number of candles high/low you specify.
You no longer need to switch timeframes to check the candles. Everything can be shown in one chart. MT5 Version : https://www.mql5.com/en/market/product/115682 Almost everything can be change as you want. You can change/set:
- Choose different colors for the body and top/bottom wicks.
- Panel's height and width.
- The width of the body and wicks
- Change backgro

The indicator reveals key levels for gold.
The levels can be used for support and resistance, breakout, break and retest or most strategies.
The major levels can be used for intraday trades from one level to the next or reversals.
The mini levels can be used to scalp lower timeframes.
The color, line style and thickness can be adjusted as preferred.
Symbol: XAUUSD Timeframe: Major levels - M30 - H4 Mini Levels M15 - M1
The levels may enhance your current setup.

The indicator plots key levels automatically for EURUSD.
Major levels - H4,H1 Minor Levels - M30,M15 Mini Levels - M5,M1
To deactivate a level, just select color none.
It can be used to enhance your current strategy. (Please see screenshots)
The color, line style and thickness can be adjusted as preferred.
Symbol: EURUSD Timeframe: H4 and below
Enjoy! ------------------------------------------

TRADE THE BREAKOUTS like Gordon Gekko Gordon Gekko, the ruthless and iconic character from the movie "Wall Street," is renowned for his aggressive and opportunistic trading strategies. When it comes to trading breakouts, Gekko embodies the mindset of a savvy and relentless trader who seizes every opportunity to capitalize on market movements. In Gekko's trading playbook, spotting breakout opportunities is akin to identifying potential gold mines in the market. He meticulously scans the charts
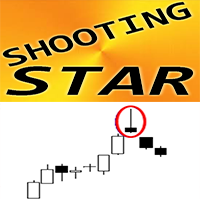
MT4 外汇指标“射击之星模式”
“流星模式”指标对于价格行为交易来说是非常强大的指标:无需重绘,无延迟; 指标检测到图表上的看跌流星形态:图表上的红色箭头信号(参见图片) 包括 PC、手机和电子邮件警报 “流星形态”指标非常适合与支撑/阻力位结合使用: https://www.mql5.com/en/market/product/100903
// 这里提供更多优秀的 EA 交易和指标: https://www.mql5.com/en/users/def1380/seller // 也欢迎您加入盈利、稳定、可靠的信号 https://www.mql5.com/en/signals/1887493 它是仅在该 MQL5 网站上提供的原创产品。
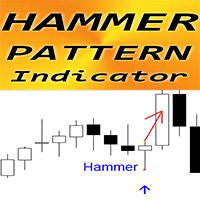
MT4 外汇指标“锤子形态”
“锤子形态”指标对于价格行为交易来说是非常强大的指标:无需重绘,无延迟; 指标检测图表上的看涨锤子形态:图表上的蓝色箭头信号(参见图片) 包括 PC、手机和电子邮件警报 “锤子形态”指标非常适合与支撑/阻力位结合使用: https://www.mql5.com/en/market/product/100903
// 这里提供更多优秀的 EA 交易和指标: https://www.mql5.com/en/users/def1380/seller // 也欢迎您加入盈利、稳定、可靠的信号 https://www.mql5.com/en/signals/1887493 它是仅在该 MQL5 网站上提供的原创产品。
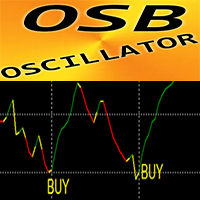
OSB 振荡器 - 是高级自定义指标、高效的价格行为辅助工具!
采用先进的新计算方法。 新一代振荡器 - 查看图片以了解如何使用它。 OSB 振荡器是一种辅助工具,用于查找价格行为、背离和超卖/超买信号的准确切入点 超卖值:低于30 超买值:超过70 即使是使用该指标的标准策略也有很多升级的机会。 它比标准振荡器更快、更准确。 指标设置非常简单。 它只有 1 个参数 - 灵敏度。
如何使用: 作为价格行为过滤器(见图) 作为主要趋势方向的入场信号(见图) 作为具有准确信号的背离指标(见图)
// 这里提供更多优秀的 EA 交易和指标: https://www.mql5.com/en/users/def1380/seller // 也欢迎您加入盈利、稳定、可靠的信号 https://www.mql5.com/en/signals/1887493 它是仅在该 MQL5 网站上提供的原创产品。

"Awesome Market Prediction" is a revolutionary indicator designed to provide accurate and sophisticated market predictions to traders. Developed with cutting-edge technology and intelligent algorithms, this indicator offers deep insights into future market movements. Key features of "Awesome Market Prediction" include: High Accuracy Predictions : Utilizing in-depth data analysis and advanced prediction techniques, this indicator delivers highly accurate estimates of market direction. Multiple Ma

泥瓦匠是一个工具,将使你成为一个专业的分析师! 使用倾斜通道确定波浪运动的方法定性地传达了任何工具运动的原理图,不仅显示了市场可能的逆转,而且还显示了进一步运动的目标!破坏了市场还活着的神话,清楚地显示了从一个范围到另一个范围的运动原理图! 一个专业的工具,适合中期与当前趋势的定义! 泥瓦匠是一个工具,将使你成为一个专业的分析师! 使用倾斜通道确定波浪运动的方法定性地传达了任何工具运动的原理图,不仅显示了市场可能的逆转,而且还显示了进一步运动的目标!破坏了市场还活着的神话,清楚地显示了从一个范围到另一个范围的运动原理图! 一个专业的工具,适合中期与当前趋势的定义!
泥瓦匠是一个工具,将使你成为一个专业的分析师! 使用倾斜通道确定波浪运动的方法定性地传达了任何工具运动的原理图,不仅显示了市场可能的逆转,而且还显示了进一步运动的目标!破坏了市场还活着的神话,清楚地显示了从一个范围到另一个范围的运动原理图!

The Trend_Scalper_Arrows_Entry&Exit trend indicator perfectly follows the trend, indicates entry search zones, indicates entry signals with arrows, and also indicates zones for fixing market orders with vertical lines. An excellent indicator for both beginners in Forex trading and professionals.
All lines, arrows, alerts can be disabled.
See all indicator parameters on the screenshot.

Channel indicator, written according to a strategy based on indicators: BollingerBands, Moving Average, RSI and TMA. The indicator embodies arrow signals for the trend, counter-trend, and also for fixing transactions. And also all possible alerts. The indicator is ideal for working together with a trend indicator for taking profits. All settings are on screenshots.
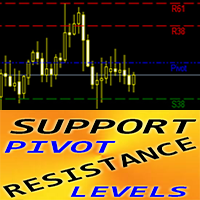
MT4 外汇指标“枢轴支撑阻力位日周月”
“枢轴 SR 水平 D_W_M”指标是价格行为交易的非常强大的辅助指标 该特定指标在计算中使用斐波那契数。 枢轴水平计算为前一交易期间市场表现的重要价格的平均值 枢轴水平本身代表最高阻力或支撑水平,具体取决于整体市场状况 指标“枢轴 SR 水平 D_W_M”向您显示最可能的反转水平,可以通过价格达到该水平。 R - 电平(红色) - 电阻 S - 级别(绿色) - 支持 每日、每周和每月之前的交易周期可在设置中进行计算 指标“枢轴水平 D_W_M ”非常适合通过价格行为模式规划您的止盈目标或价格反转。 如何使用指标: 1) 将指标附加到相应的图表上 2) 选择您需要的设置并按 OK 按钮 3) 点击MT4中的不同时间范围(H1、H4、D1、W1)以进行指标的初始正确计算。
// 这里提供更多优秀的 EA 交易和指标: https://www.mql5.com/en/users/def1380/seller // 也欢迎您加入盈利、稳定、可靠的信号 https://www.mql5.com/en/signals/1887493 它是仅在

Subscribe to the 'MA7 Trading' channel to receive notifications about new programs, updates and other information. Ask questions in the profile on the MQL5 .
Description of work
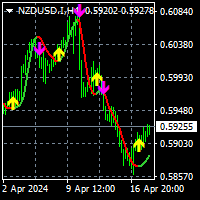
The 'MA7 Clover' indicator is based on candle shapes. Shows the 'Pin Bar' candle pattern. Detailed information about the 'MA7 Clover' indicator.
Indicator settings
General settings: Min body size ; Max body size ; Min nose size ; Max nose size .
Message settings: Send message to the terminal (Alert) – permission
To download MT5 version please click here .
- This is the exact conversion from TradingView: " PA-Adaptive Hull Parabolic " By "Loxx".
- This is a non-repaint and light processing load indicator
- You can message in private chat for further changes you need.
- All input options are available except candle coloring.
- Buffers are available for processing within EAs.
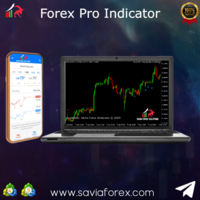
Savia Forex Pro Indicator The Savia Forex Solutions Forex Pro Indicator gives you highly accurate entries on all Forex/Currency pairs, Indices and Cryptocurrencies. The Forex Pro Indicator is dynamic and powerful and is optimized for all timeframes and ALL Currency pairs, Indices, Commodities, and Cryptocurrency pairs. Trade with improved confidence and maximize your success rate. Benefits Dynamic and Powerful. Forex Pro Indicator is fully optimized for all chart timeframes. Forex Pro Indicator

使用此交易工具,您可以同时扫描 15 个市场。
介绍新的交易指标 2024:
️ 仪表板多货币多时间框架随机。
我创建这个交易工具至少有两个原因:
首先,我厌倦了只观察一个市场。 其次,我不想失去进入另一个市场的时机。
这就是为什么我想同时了解其他市场状况。
因此,我需要一台可以同时扫描多个市场状况的扫描仪。
我经常寻找随机主线>(或<=)随机信号线从M1到H4(或只是M1到M30)的市场。
如果您同意我的分析,那么这就是您一直在寻找的交易指标。
不要错过市场状况满足上述要求的时刻。
这是一个随机扫描仪或仪表板,具有许多出色的功能:
可显示随机主线数据 可显示随机信号线数据 可以显示随机主线和信号线的位置(信号线上方主线或信号线下方主线) 可以显示随机主线和信号线的数据水平(看涨、看跌、趋势向上、趋势向下、超买但仍向上、超卖但仍向下) 可显示从M1到MN1的实时数据 可显示15种货币对的数据(多币种外汇/商品/加密货币/股票) 可定制参数 可定制颜色 OBOS 级别 漂亮的20仪表板配色方案 配备开/关货币对转换器 配备蜡烛高时间框架 配
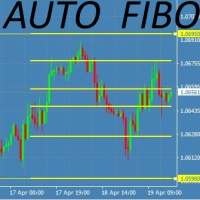
This Fibonacci Indicator is showing fibo retracement lines on chart for EA trading same as the default tool from Metatrader's menu, except this one is fully automatic and changes along with the chart (with modes B and C, then mode A is always fixed by set levels)
AND it also offers the line levels for the Expert Advisors to read (buffers) , so you can set your trades based on crossover\crossunder on those fibo lines.
You can choose from 3 modes for selecting the max HIGH and min LOW limit,
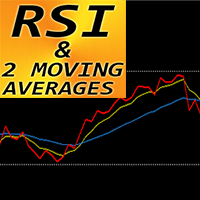
MT4 外汇指标“RSI 和 2 条移动平均线”
该指标非常适合动量交易系统。 “RSI 和 2 MAs”指标可让您查看 RSI 本身的快速和慢速移动平均线 指标提供了尽早看到趋势变化的机会 “RSI 和 2 MAs”可用于捕捉趋势方向的动能 通过参数设置该指标非常容易(见图) 指标可用于任何时间范围 ............................................................................................................. // 这里提供更多优秀的 EA 交易和指标: https://www.mql5.com/en/users/def1380/seller // 也欢迎您加入盈利、稳定、可靠的信号 https://www.mql5.com/en/signals/1887493 它是仅在该 MQL5 网站上提供的原创产品。

The Forex Correlation Indicator is a powerful tool designed to analyze and display the correlation between different major forex pairs in the market. This indicator helps traders identify relationships and trends between currency pairs, allowing for more informed trading decisions. Key Features: Displays correlation coefficients between pairs. Visualizes correlation strength through color-coded indicators. Customizable settings for timeframes and correlation calculations. User-friendly interfac
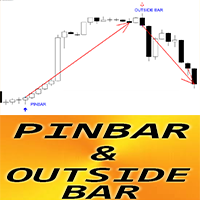
MT4 外汇指标“Pin Bar 和 Outside Bar 模式”
“Pin Bar & Outside Bar Patterns”指标对于价格行为交易非常强大 指标检测图表上的 Pin Bar 和 Outside Bar 形态: 看涨模式 - 图表上的蓝色箭头信号(参见图片) 看跌模式 - 图表上的红色箭头信号(见图) 无需重新喷漆; 没有延误; 带有 PC、手机和电子邮件警报 指标“Pin Bar & Outside Bar Patterns”非常适合与支撑/阻力位结合使用: https://www.mql5.com/en/market/product/100903
// 这里提供更多优秀的 EA 交易和指标: https://www.mql5.com/en/users/def1380/seller // 也欢迎您加入盈利、稳定、可靠的信号 https://www.mql5.com/en/signals/1887493 它是仅在该 MQL5 网站上提供的原创产品。

The Forex indicator TrendNavigator is a technical indicator. TrendNavigator is a tool that allows traders employing this strategy to better understand what is happening in the market and predict in which direction the price will continue to move. The indicator's values are calculated based on price movements of the currency pair or any other financial asset. Within the scope of technical analysis, the TrendNavigator indicator is used by traders to forecast future price values or the overall

The Trend Seeker indicator is perfectly suited for tracking long-term trends in the Forex market and can be used without restrictions on instruments or time intervals. This indicator allows attempting to forecast future values, but its main application lies in generating buy and sell signals. The AlphaTrend Seeker tracks market trends, disregarding sharp fluctuations and noise around the average price. It is based on the idea of technical analysis, asserting that the market has a cyclical n

我们的 Basic Support and Resistance 指示器是提高技术分析所需的解决方案。该指标允许您在图表/ MT5版本
功能
斐波那契水平的集成: 可以选择显示斐波那契水平以及支持和阻力水平,我们的指标使您对市场行为和可能的逆转区域有更深入的了解。
性能优化: 只能在每个栏的打开时更新扩展线,我们的指标可确保最佳性能,而无需牺牲支持和阻力级别的准确性。
输入 主设置 Timeframe: 通过此输入,您可以选择在图表上显示较高时间范围的支撑线和阻力线。 Support/Resistance Strength [Number of Bars]: 使用此输入,您可以确定支撑和电阻的强度。数量越高,支持/阻力越强。 Price mode: 此参数允许您选择哪种价格将用于计算支持和电阻水平。它可以是收盘价,最高价格,最低价格等。取决于您的策略和偏好,您可以选择最适合您需求的价格。 显示设置 Display Fibonacci levels: 此参数确定是否将显示斐波那契水平以及图表上的支持和电阻级别。斐波那契水平是技术分析中使用的关键水平,并使用斐波那契序

The "Trend Tandem" indicator is a trend analysis tool in financial markets that helps traders determine the direction of price movement.
Options:
RISK: Determines the level of risk taken into account in the trend analysis. The higher the value, the more aggressively volatility is taken into account. SSP (SSP Period): Defines the period of the moving average used to identify a trend. The higher the value, the smoother the trend signal will be. CountBars: Determines the number of bars on whic

The "Trend Api" indicator is an innovative tool for trend analysis in the Forex market. It has unique features and a wide range of settings that will help traders make informed decisions when trading.
This indicator is based on the analysis of the market trend and helps to identify the direction of price movement. It uses various mathematical algorithms and statistical methods to determine the strength and sustainability of a trend in the market.
One of the key features of the "Trend Api" i
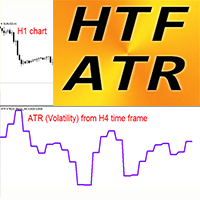
MT4 外汇波动率指标 HTF ATR
平均真实波动幅度本身是交易者最重要的指标之一 - 它显示市场波动性 HTF ATR 是用于技术分析的市场波动指标。 HTF 意味着 - 更高的时间范围 ATR 非常适合规划您的动态止盈/止损位置: 例如,最佳 SL 值位于 1.2-2.5 ATR 值之间 该指标是添加到任何交易系统的有用工具 HTF ATR 指标允许您将较高时间范围的 ATR 附加到当前图表 --> 这是专业的交易方法
// 这里提供更多优秀的 EA 交易和指标: https://www.mql5.com/en/users/def1380/seller // 也欢迎您加入盈利、稳定、可靠的信号 https://www.mql5.com/en/signals/1887493 它是仅在该 MQL5 网站上提供的原创产品。

MT4 的外汇指标“MA Speed”,无需重新绘制。
移动平均线的速度 - 是独特的趋势指标 该指标的计算基于物理学方程。 速度是移动平均线的一阶导数 MA 速度指标显示 MA 本身改变方向的速度 即使是标准策略,也有很多机会可以通过 MA Speed 进行升级。 适用于 SMA、EMA、SMMA 和 LWMA 建议在趋势策略中使用MA Speed,如果指标值<0:趋势向下; 如果指标值 > 0:趋势上升 时间范围 - 任意; 交易对 - 任何 指示器内置移动和 PC 警报。
参数(设置非常简单): 1)速度周期。 建议值为 3 到 7。当速度周期较低时,指示器的灵敏度增加,反之亦然。 2) MA周期(将计算该MA的速度) 3) MA方法:SMA、EMA、SMMA、LWMA 4)MA应用价格(7个选项)
// 这里提供更多优秀的 EA 交易和指标: https://www.mql5.com/en/users/def1380/seller // 也欢迎您加入盈利、稳定、可靠的信号 https://www.mql5.com/en/signals/1887493 它是仅在该
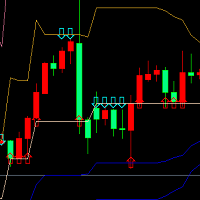
本指标是根据黄金分割理论,分别获取过去22(默认)根K线高低价,并通过黄金分割系数计算得出支撑、压力曲线。 当价格第一次向上靠近压力线,或者多次靠近压力线时,会出现向下的箭头符合,提示有压力,适宜做空sell; 当价格第一次向下靠近支撑线,或者多次靠近支撑线时,会出现向上的箭头符合,提示有支撑,适宜做多buy; 在数据窗口,会提示各条支撑、压力线的价格数值,出现的箭头符合数值为up、down。
这个指标,适合在所挂的图表里做短线,也即进场开仓后,持仓几根K线柱,然后可以平仓。做多的话,止损可以在支撑线下方,止盈在压力线附近。做空的话,止损可以在压力线上方,止盈在支撑线附近。
本指标涉及的黄金分割系数分别为0.382、0.618、1.618、2.168、4.236,计算得到对应的支撑压力线。 由于MT4的指标数量有限,本指标分成了2个EX4文件,第一个的黄金分割系数为0.382、0.618、1.618,第二个为2.168、4.236,第二个文件名为“Golden Ratio Support Pressure Indicator 2.168、4.236”,可免费下载和使用。
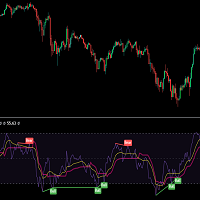
MOST is applied on this RSI moving average with an extra default option added VAR/VIDYA (Variable Index Dynamic Moving Average)
MOST added on RSI has a Moving Average of RSI and a trailing percent stop level of the Moving Average that can be adjusted by changing the length of the MA and %percent of the stop level.
BUY SIGNAL when the Moving Average Line crosses above the MOST Line
LONG CONDITION when the Moving Average is above the MOST
SELL SIGNAL when Moving Average Line crosses belo
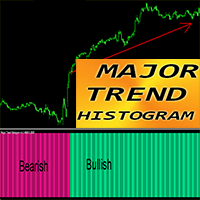
MT4 外汇指标“主要趋势直方图”
主要趋势直方图指标旨在捕捉真正的巨大趋势 指标有 2 种颜色:深粉色代表看跌趋势,春季绿色代表看涨趋势(颜色可以更改) 它可以检测开始阶段的趋势 - 比任何标准移动平均线交叉更有效 主要趋势柱状图可以与任何其他交易方法结合使用:价格行为、VSA、其他指标 指示器内置移动和 PC 警报 ............................................................................................................. // 这里提供更多优秀的 EA 交易和指标: https://www.mql5.com/en/users/def1380/seller // 也欢迎您加入盈利、稳定、可靠的信号 https://www.mql5.com/en/signals/1887493 它是仅在该 MQL5 网站上提供的原创产品。
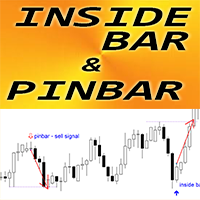
MT4 外汇指标“Inside Bar 和 PinBar 模式”
“Inside Bar & PinBar 模式”指标对于价格行为交易非常强大 指标检测图表上的 Inside Bar 和 PinBar 形态: 看涨模式 - 图表上的蓝色箭头信号(参见图片) 看跌模式 - 图表上的红色箭头信号(见图) 无需重新喷漆; 没有延误; Inside Bar 本身具有较高的 R/R 比率(奖励/风险) 带有 PC、手机和电子邮件警报 “Inside Bar & PinBar 模式”指标非常适合与支撑/阻力位结合使用: https://www.mql5.com/en/market/product/100903
// 这里提供更多优秀的 EA 交易和指标: https://www.mql5.com/en/users/def1380/seller // 也欢迎您加入盈利、稳定、可靠的信号 https://www.mql5.com/en/signals/1887493 它是仅在该 MQL5 网站上提供的原创产品。
您知道为什么MetaTrader市场是出售交易策略和技术指标的最佳场所吗?不需要广告或软件保护,没有支付的麻烦。一切都在MetaTrader市场提供。
您错过了交易机会:
- 免费交易应用程序
- 8,000+信号可供复制
- 探索金融市场的经济新闻
注册
登录