Indicadores técnicos de pago para MetaTrader 4 - 107

Introduction
One of the patterns in "RTM" is the "QM" pattern, also known as "Quasimodo". Its name is derived from the appearance of "Hunchback of Notre-Dame" from Victor Hugo's novel. It is a type of "Head and Shoulders" pattern.
Formation Method
Upward Trend
In an upward trend, the left shoulder is formed, and the price creates a new peak higher than the left shoulder peak . After a decline, it manages to break the previous low and move upward again. We expect the pric
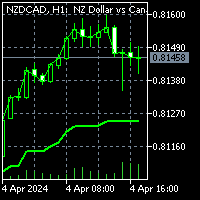
To get access to MT5 version please click here . This is the exact conversion from TradingView: "G-Channel Trend Detection" by "jaggedsoft". This is a light-load processing and non-repaint indicator. You can message in private chat for further changes you need. All input options are available. Buffers are available for processing within EAs. Highlight option is omitted as does not show good in Metatrader.

Advanced Currency Strength Indicator
The Advanced Divergence Currency Strength Indicator. Not only it breaks down all 28 forex currency pairs and calculates the strength of individual currencies across all timeframes , but, You'll be analyzing the WHOLE forex market in 1 window (In just 1 minute) . This indicator is very powerful because it reveals the true movements of the market. It is highly recommended to analyze charts knowing the performance of individual currencies or

Forex Gump Advanced es una estrategia comercial lista para usar basada en un indicador. Forex Gump Advanced es un indicador que muestra al operador cuándo abrir operaciones, en qué dirección abrir y cuándo cerrar. Forex Gump Advanced muestra toda la información necesaria de forma clara en el gráfico.
Ventajas del indicador: sistema de comercio completamente listo no vuelve a dibujar en el 95% de los casos el precio va en la dirección de la señal. El 5% de las señales no funcionan y cierran co

APP System Signals es un indicador sofisticado diseñado para traders activos en los mercados financieros. Proporciona señales precisas de compra y venta basadas en un análisis técnico avanzado, lo que permite a los traders tomar decisiones informadas. El indicador utiliza una combinación de medias móviles exponenciales (EMA), medias móviles simples (SMA) y tendencias subyacentes para generar señales fiables. Los parámetros son completamente personalizables, lo que permite a los traders adaptar
TeconLab Indicator User Guide Overview The TeconLab Indicator is a tool for MetaTrader 4 (MT4) users, fine-tuned to gather price information, including Date, Time, Open, High, Low, Close, and Volume, and update this data in real-time. Uniquely, this indicator autonomously refreshes the CSV file every minute or less, meaning there's no need for manual restarts—just activate it once, and it will continuously collect data as long as MT4 is running. It maintains the latest data according to the size
Based on unique formulas and calculations, this indicator analyses every price move on the chart then applies its unique formulas on them to indicate the currently dominant direction. This indicator works on all instruments but best with GOLD (XAUUSD). It can also work as an entry confirmation tool and can also serves highlighting the worthy and noticeable moves on the chart. The Oppo Signals Indicator can work alongside any other strategy and can also help traders devise their own strategies u

The indicator is based on the calculation of liquidity on the market and thus shows where the market can most likely turn.. It shows the places of liquidity where the price will reach sooner or later... The indicator can be set to several types of liquidity and therefore can display several levels on the graph.. It is a unique tool that can help you very well in your trading The indicator is suitable for currency pairs with the most liquidity (EURUSD/GBPUSD...)

Once upon a time, in the bustling streets of Gotham City, there lived a mysterious figure known only as the Joker. With his enigmatic grin and unpredictable nature, the Joker roamed the city's financial district, leaving chaos and uncertainty in his wake. One fateful day, a group of traders stumbled upon a peculiar artifact hidden deep within the dark alleys of Gotham. It was a cryptic indicator known as the "Joker Arrow," rumored to possess the power to predict market movements with uncanny acc

The indicator reveals key levels for gold.
The levels can be used for support and resistance, breakout, break and retest or most strategies.
The major levels can be used for intraday trades from one level to the next or reversals.
The mini levels can be used to scalp lower timeframes.
The color, line style and thickness can be adjusted as preferred.
Symbol: XAUUSD Timeframe: Major levels - M30 - H4 Mini Levels M15 - M1
The levels may enhance your current setup.

The indicator plots key levels automatically for EURUSD.
Major levels - H4,H1 Minor Levels - M30,M15 Mini Levels - M5,M1
To deactivate a level, just select color none.
It can be used to enhance your current strategy. (Please see screenshots)
The color, line style and thickness can be adjusted as preferred.
Symbol: EURUSD Timeframe: H4 and below
Enjoy! ------------------------------------------

TRADE THE BREAKOUTS like Gordon Gekko Gordon Gekko, the ruthless and iconic character from the movie "Wall Street," is renowned for his aggressive and opportunistic trading strategies. When it comes to trading breakouts, Gekko embodies the mindset of a savvy and relentless trader who seizes every opportunity to capitalize on market movements. In Gekko's trading playbook, spotting breakout opportunities is akin to identifying potential gold mines in the market. He meticulously scans the charts

MASONS-una herramienta que te hace un analista profesional! El método de determinación de los movimientos de onda con la ayuda de canales inclinados,transmite cualitativamente el esquemático del movimiento de cualquier instrumento,mostrando no solo las posibles reversiones en el mercado,sino también los objetivos de otros movimientos.Destruye el mito de que el mercado está vivo ,mostrando claramente los movimientos esquemáticos de un rango a otro! Herramienta profesional, adecuado para la persp

The Trend_Scalper_Arrows_Entry&Exit trend indicator perfectly follows the trend, indicates entry search zones, indicates entry signals with arrows, and also indicates zones for fixing market orders with vertical lines. An excellent indicator for both beginners in Forex trading and professionals.
All lines, arrows, alerts can be disabled.
See all indicator parameters on the screenshot.

Channel indicator, written according to a strategy based on indicators: BollingerBands, Moving Average, RSI and TMA. The indicator embodies arrow signals for the trend, counter-trend, and also for fixing transactions. And also all possible alerts. The indicator is ideal for working together with a trend indicator for taking profits. All settings are on screenshots.

Subscribe to the 'MA7 Trading' channel to receive notifications about new programs, updates and other information. Ask questions in the profile on the MQL5 .
Description of work
The 'MA7 Clover' indicator is based on candle shapes. Shows the 'Pin Bar' candle pattern. Detailed information about the 'MA7 Clover' indicator.
Indicator settings
General settings: Min body size ; Max body size ; Min nose size ; Max nose size .
Message settings: Send message to the terminal (Alert) – permission
To download MT5 version please click here .
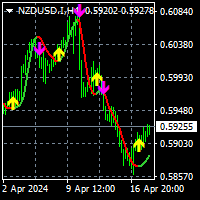
- This is the exact conversion from TradingView: " PA-Adaptive Hull Parabolic " By "Loxx".
- This is a non-repaint and light processing load indicator
- You can message in private chat for further changes you need.
- All input options are available except candle coloring.
- Buffers are available for processing within EAs.
El MA Killer Indicator es el arma definitiva para los operadores que utilizan promedios móviles. Es un sistema completo que utiliza varias herramientas accesibles directamente desde un panel de gestión . Gracias a sus herramientas usted tiene una visión general del mercado y una valiosa ayuda en la toma de decisiones para acceder a un puesto.
Consiste:
- El indicador Trend Master chart que muestra la tendencia directamente en el gráfico mediante un código de color. Esta tendencia se calcul
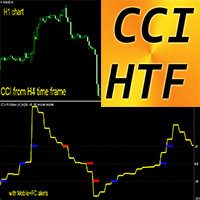
Indicador Forex CCI HTF Oscilador para MT4
Actualice sus métodos comerciales con el oscilador CCI HTF profesional para MT4. HTF significa - Marco de tiempo más alto Commodity Channel Index (CCI) mide la diferencia entre el precio actual y el precio promedio histórico Niveles importantes: +/-200, +/-100 Es genial aceptar entradas de Venta desde la zona superior a +200 y entradas de Compra desde menos de -200. Este indicador es excelente para sistemas de comercio de marcos de tiempo múltiples c
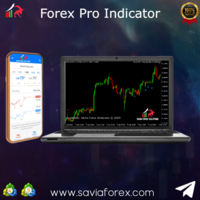
Savia Forex Pro Indicator The Savia Forex Solutions Forex Pro Indicator gives you highly accurate entries on all Forex/Currency pairs, Indices and Cryptocurrencies. The Forex Pro Indicator is dynamic and powerful and is optimized for all timeframes and ALL Currency pairs, Indices, Commodities, and Cryptocurrency pairs. Trade with improved confidence and maximize your success rate. Benefits Dynamic and Powerful. Forex Pro Indicator is fully optimized for all chart timeframes. Forex Pro Indicator

Con esta herramienta comercial, puede escanear 15 mercados simultáneamente.
Presentamos el nuevo indicador comercial 2024:
️ Tablero Estocástico de marco de tiempo múltiple y moneda múltiple.
Hay al menos dos razones por las que creé esta herramienta comercial:
Primero, estoy aburrido de observar sólo un mercado. En segundo lugar, no quiero perder el momento de entrada en otro mercado.
Por eso quiero conocer al mismo tiempo otras condiciones del mercado.
Por este motivo, necesito u
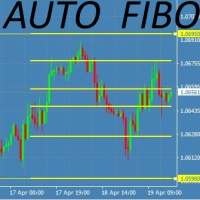
This Fibonacci Indicator is showing fibo retracement lines on chart for EA trading same as the default tool from Metatrader's menu, except this one is fully automatic and changes along with the chart (with modes B and C, then mode A is always fixed by set levels)
AND it also offers the line levels for the Expert Advisors to read (buffers) , so you can set your trades based on crossover\crossunder on those fibo lines.
You can choose from 3 modes for selecting the max HIGH and min LOW limit,

The Forex Correlation Indicator is a powerful tool designed to analyze and display the correlation between different major forex pairs in the market. This indicator helps traders identify relationships and trends between currency pairs, allowing for more informed trading decisions. Key Features: Displays correlation coefficients between pairs. Visualizes correlation strength through color-coded indicators. Customizable settings for timeframes and correlation calculations. User-friendly interfac

The Trend Seeker indicator is perfectly suited for tracking long-term trends in the Forex market and can be used without restrictions on instruments or time intervals. This indicator allows attempting to forecast future values, but its main application lies in generating buy and sell signals. The AlphaTrend Seeker tracks market trends, disregarding sharp fluctuations and noise around the average price. It is based on the idea of technical analysis, asserting that the market has a cyclical n

nuestro indicador Basic Support and Resistance es la solución que necesita para aumentar su análisis técnico.Este indicador le permite proyectar niveles de soporte y resistencia en el gráfico/ versión mt5
características
Integración de los niveles de Fibonacci: Con la opción de mostrar los niveles de Fibonacci junto con los niveles de soporte y resistencia, nuestro indicador le brinda una visión aún más profunda del comportamiento del mercado y las posibles áreas de inversión.
Optimización

The "Trend Tandem" indicator is a trend analysis tool in financial markets that helps traders determine the direction of price movement.
Options:
RISK: Determines the level of risk taken into account in the trend analysis. The higher the value, the more aggressively volatility is taken into account. SSP (SSP Period): Defines the period of the moving average used to identify a trend. The higher the value, the smoother the trend signal will be. CountBars: Determines the number of bars on whic

The "Trend Api" indicator is an innovative tool for trend analysis in the Forex market. It has unique features and a wide range of settings that will help traders make informed decisions when trading.
This indicator is based on the analysis of the market trend and helps to identify the direction of price movement. It uses various mathematical algorithms and statistical methods to determine the strength and sustainability of a trend in the market.
One of the key features of the "Trend Api" i
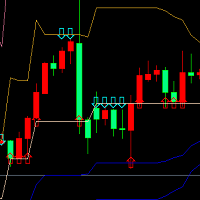
Este indicador se basa en la teoría de la sección dorada, que obtiene los precios altos y bajos de las últimas 22 líneas K (por defecto), y obtiene la curva de soporte y presión a través del cálculo del coeficiente de sección dorada. Cuando el precio se acerca a la línea de presión hacia arriba por primera vez, o se acerca a la línea de presión muchas veces, aparecerá una flecha hacia abajo que coincide, lo que indica que hay presión y es adecuado para acortar el sell; Cuando el precio se acerc
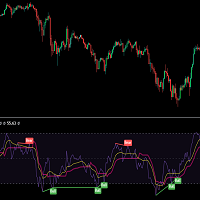
MOST is applied on this RSI moving average with an extra default option added VAR/VIDYA (Variable Index Dynamic Moving Average)
MOST added on RSI has a Moving Average of RSI and a trailing percent stop level of the Moving Average that can be adjusted by changing the length of the MA and %percent of the stop level.
BUY SIGNAL when the Moving Average Line crosses above the MOST Line
LONG CONDITION when the Moving Average is above the MOST
SELL SIGNAL when Moving Average Line crosses belo
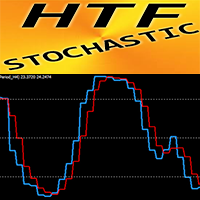
Indicador Forex estocástico HTF para MT4
El oscilador estocástico es uno de los mejores indicadores del mercado y es una herramienta perfecta para muchos traders. HTF significa - Marco de tiempo más alto Zona de sobrecompra: por encima de 80; Uno sobrevendido: menos de 20 El indicador estocástico HTF es excelente para sistemas comerciales de marcos de tiempo múltiples, especialmente con entradas de acción de precio. Este indicador le permite adjuntar el estocástico desde un período de tiempo

MAXLUM SYSTEM is a Trading System that uses anti-Margin Call without using SL with a positive correlation Hedging Strategy
Simple example of BUY on EURUSD and SELL on GBPUSD at the same time This kind of trading will not occur as a Margin Call By calculating the GAP difference between the 2 pairs we can take advantage of the GAP
This indicator will be more effective if you use Data Analysis download excel file on telegram Group Please join the Maxlum System Telegram group for details t.me/m

This tool helps you to find easily and clearly when you enter trade with day time and price examples Entered Buy at Monday 20:30 with price 2150 Exited buy at Tues 10: 30 with price 2187 You can convert as local time by inputting shift hours and minutes.
Trading is a learning skill, so you have to evaluate your trading performance at the end of your day. Did you follow your rules? If you did then it was a win, regardless if you earned pips or not. If you didn't follow my rules then is a

The Tripl indicator is designed to visually display the current trend in the market. One of the key aspects of currency market analysis is identifying a trend, which is a stable direction in which prices are moving. For this purpose, the Tripl indicator uses calculations that smooth out sharp fluctuations that do not have a significant impact on the overall trend of price movements.
A trend can be either upward (bullish) or downward (bearish). Most often, a trend develops for a long time befo

Con esta herramienta comercial, puede escanear 15 mercados simultáneamente.
Presentamos el nuevo indicador comercial 2024:
️ Panel de control Multidivisa Multiplazo Doble CCI.
Hay al menos dos razones por las que creé esta herramienta comercial:
En primer lugar, estoy aburrido de observar sólo un mercado. En segundo lugar, no quiero perder el momento de entrada en otro mercado.
Por eso quiero conocer al mismo tiempo otras condiciones del mercado.
Por este motivo, necesito un escáne
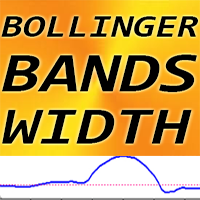
Ancho de las bandas de Bollinger del indicador Forex para MT4, sin repintado.
-El indicador de ancho BB es aplicable para usar junto con el indicador estándar de Bandas de Bollinger. -Este software es imprescindible para todo fanático del indicador de Bandas de Bollinger, porque su combinación es muy eficiente para operar con Breakouts -El indicador de ancho BB muestra la distancia (alcance) entre las bandas de Bollinger.
CÓMO UTILIZAR el ancho de BB (consulte el ejemplo en la imagen): 1) E

Con esta herramienta comercial, puede escanear 15 mercados simultáneamente.
Presentamos el nuevo indicador comercial 2024:
️ Panel de control Multidivisa Múltiple Marco de tiempo Doble RSI.
Hay al menos dos razones por las que creé esta herramienta comercial:
Primero, estoy aburrido de observar sólo un mercado. En segundo lugar, no quiero perder el momento de entrada en otro mercado.
Por eso quiero conocer al mismo tiempo otras condiciones del mercado.
Por este motivo, necesito un

Elevate your trading game with TigerSignals – the ultimate MetaTrader 4 indicator. Designed for simplicity and precision, TigerSignals provides crystal-clear buy and sell signals, making it a must-have for traders of all levels.
Features: User-Friendly: Easy-to-use interface ensures hassle-free integration into your trading strategy. Alerts: Sound, phone, and email alerts. Receive notifications when a new signal appears, giving you the freedom to step away from the chart! Lot Size Calcula

The indicator show Higher timeframe candles for ICT technical analisys Higher time frames reduce the 'noise' inherent in lower time frames, providing a clearer, more accurate picture of the market's movements.
By examining higher time frames, you can better identify trends, reversals, and key areas of support and resistance.
The Higher Time Frame Candles indicator overlays higher time frame data directly onto your current chart.
You can easily specify the higher time frame candles yo

Auto Multi Channels VT Ещё один технический индикатор в помощь трейдеру. Данный индикатор, автоматически показывает, наклонные каналы в восходящем,
нисходящем и боковом движении цены, т.е. тренды. (Внутри дня. Среднесрочные и долгосрочные, а также Восходящие, нисходящие и боковые).
О понятии Тренд. На бирже, трендом называется направленное движение ценового графика в одну из сторон (вверх или вниз) . То есть, тренд в трейдинге — это ситуация,
когда цена определенное время возрастает или

Introducing the Ultimate Horizontal Line Alert Indicator for MT4! Transform your trading with the smartest tool in the market. Our Horizontal Line Alert Indicator isn't just any indicator — it's your new trading partner that combines precision, flexibility, and intuitive control. What Does It Do? This revolutionary MT4 indicator automatically adjusts trend lines to be horizontal with just the press of the 'L' key. It’s perfect for traders who want to focus on specific price levels, ensu
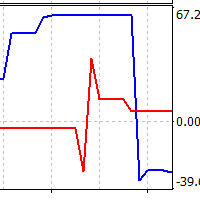
Two lines are being drawn in a separate window. And both are representing an angle of a trendline. One trendline is measured going across two price highs, but the other is measured across two lows. You get to choose the period from which the first price high and first price low is being determined. The second high and low comes from identical time period preceding the first one. Feel free to experiment with the period count until you get the confirmation you are looking for.

TrendWave Oscillator is an advanced MT4 oscillator that not only identifies the trend direction but also provides visual and audio alerts to enhance trading strategies.
Key Features: - Color-coded trend indication: - Blue : Indicates an uptrend, signaling potential price growth. - Orange : Indicates a downtrend, suggesting possible price decline. - Gray : Represents a flat market or lack of clear entry signals.
- Graphical signals on the chart : - Aqua : Highlights an uptrend, empha
AlphaTrend AM is an indicator that allows you to open a position at the very beginning of a significant price movement. The second most important quality of the indicator is the ability to follow the trend as long as possible in order to obtain all potential profits while minimizing potential losses. The indicator determines the trend and points to possible entry points formed by local highs/lows. The indicator allows you to notify the user about your signals by sending messages to the terminal

Safe Trade Indicator MT4
The Safe Trade indicator is an analytical and technical tool that has different features and very accurate signals. This indicator can be used in various markets such as the stock market and the forex market. It states and also provides buy and sell signals.
Features of the Safe Trade indicator
Receiving signals as notifications on the Metatrader mobile application. Receive signals by email. Receiving signals in the form of warning messages or alarms on Metatrader.

Title: BBMA Structure Guide - BBMA Structure Guide
Description: BBMA Structure Guide is a specialized MQL4 indicator designed to help traders understand the journey of BBMA structure more easily and efficiently. BBMA, or "Bollinger Bands Moving Average," is known for its motto "One Step Ahead," highlighting the importance of understanding market structure in depth.
With BBMA Structure Guide, you can quickly identify the underlying market structure patterns that drive price movements. This w

TLBD Chart Indicator MT4
Drawing a trend line in price charts is one of the most important methods to identify the market trend, many traders use the trend line break for positioning because they believe that the trend line break means changing the trend and creating a new trend. As a result, the breaking of the trend line is an important sign for traders to open their positions in the direction of the trend. The TLBD indicator is a very suitable tool for detecting the breaking of dynamic tren

Market Magnet - This is not just a convenient tool, but rather an indispensable assistant for those who prefer to analyze the market using a clean chart. Sometimes even experienced traders need an additional analytical tool to identify key entry and exit points for trades. That's where Market Magnet comes in.
This indicator is ideal for those who often have difficulty identifying trend inflection points or drawing trend lines on a chart. It offers a visual representation of key market moments
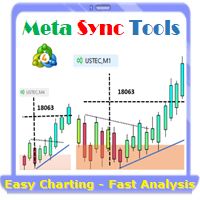
Supercharge Your MetaTrader Analysis and Trading with Meta Sync Tools! Struggling to analyze price action across different timeframes? Meta Sync Tools eliminates the frustration of unsynced crosshairs and charts, allowing seamless multi-timeframe analysis. Missing key correlations between assets and constantly switching between charts? Meta Sync Tools empowers you to visualize relationships between instruments effortlessly. Tired of wasting time on repetitive tasks? With 30+ Customizable Short

Introduction
The "Smart Money Concept" transcends mere technical trading strategies; it embodies a comprehensive philosophy elucidating market dynamics. Central to this concept is the acknowledgment that influential market participants manipulate price actions, presenting challenges for retail traders.
As a "retail trader", aligning your strategy with the behavior of "Smart Money," primarily market makers, is paramount. Understanding their trading patterns, which revolve around supply

Introducción al indicador MT4: Indicador de nivel de K-line, ayuda a los traders a identificar oportunidades de trading al 100% Resumen: El indicador de nivel de K-line es una herramienta de análisis técnico poderosa que ayuda a los traders a identificar oportunidades de trading de alta probabilidad. Al analizar los máximos, mínimos, aperturas y cierres de las K-lines, este indicador revela niveles ocultos de soporte y resistencia que actúan como imanes para la acción del precio. Funciones: Iden

hint: my basic indicators are used like that KingLevel combind with KingSequence will provides basic insights of the price action of the markets and KingSequenceSgn is just for the convienent for watching. And plus with Forex Trading mentor subsccription I will assist you to win the market at first later if it's great will be upgraded to King Forex trading mentor.
Slide 1: Title Slide Title: Unveiling Market Rhythms with Advanced Price Momentum Analysis Subtitle: A Revolutionary Trading Ind
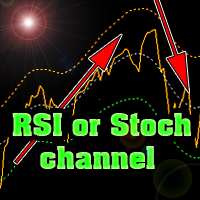
The indicator plots Stochastic or RSI levels in the price channel of a trading instrument.
Download the indicator for FREE right now and test it in the strategy tester.
It is easy to determine the trend direction and overbought or oversold levels.
The settings are standard for any of these indicators.
It is possible to change settings for each trading instrument separately.
You can use currencies, stock markets, futures or cryptocurrencies.
The indicator can be used as an independen
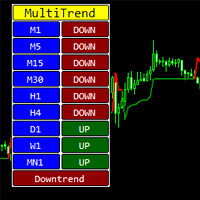
The indicator shows the direction of the trend on different timeframes.
Timeframes can be disabled in the settings.
The bottom line of the indicator reports the prevailing trend - up or down.
The indicator can be used on any trading instruments - currencies, stocks, futures, indices, metals, cryptocurrencies.
This indicator can be used as an independent trading system or as an addition to another system.
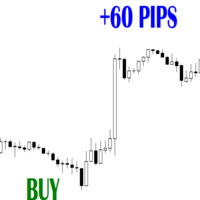
Otras herramientas de volumen para combinar: https://www.mql5.com/en/market/product/72744 Identificación de extremos de alto volumen: Posicione el indicador como una poderosa herramienta para que los operadores identifiquen períodos de intensa presión de compra o venta. Resalte cómo el amortiguador principal del indicador, que utiliza el volumen, ayuda a los operadores a identificar picos en el volumen que indican una mayor actividad del mercado. Enfatice la importancia de estos extremos de al

Use GANN 369 to use a combination of 30's,60's,90's time to cross 3's,6's,9's. Any larger combination of these cross smaller combinations of these
Using GANN 369 Method for Trading Reversals The GANN 369 method, inspired by the works of W.D. Gann and Nikola Tesla's 3, 6, 9 numerical patterns, can be employed to identify potential reversals in financial markets. By combining specific periods (30, 60, and 90) with the numbers 3, 6, and 9, traders can seek opportunities for trend changes.
>>> BIG SALE PROMOTION: 50% OFF + GIFT EA! - Promo price: $64 / Regular price $129 <<< - The promotion will end soon!
The Forex Trend Tracker is an advanced tool designed to enhance the trading capabilities of forex traders. This sophisticated indicator uses complex mathematical formulas alongside the Average True Range (ATR) to detect the beginnings of new upward and downward trends in the forex market. It offers visual cues and real-time alerts to give traders a competitive advantage in th

Overview
In the evolving landscape of trading and investment, the demand for sophisticated and reliable tools is ever-growing. The AI Trend Navigator is an indicator designed to meet this demand, providing valuable insights into market trends and potential future price movements. The AI Trend Navigator indicator is designed to predict market trends using the k-Nearest Neighbors (KNN) classifier.
By intelligently analyzing recent price actions and emphasizing similar values, it help
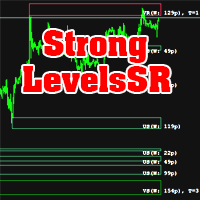
The indicator calculates support and resistance levels. There is a hint in the upper left corner. This hint can be removed. Hint in two languages (English and Russian). The width of support and resistance levels is shown. The number of levels touched is displayed. Works on all timeframes. Can be used as an independent trading system, and as an addition to another system. Download the demo version of the indicator right now and try it in the strategy tester!
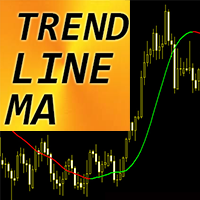
Indicador Forex "Promedio móvil de línea de tendencia" para MT4
Trend Line MA: ¡es la próxima generación de medias móviles! Se utiliza un nuevo método de cálculo avanzado. El indicador muestra tendencias sin demoras. Es mucho más rápido y claro que los indicadores estándar SMA, EMA y LWMA. Hay muchas oportunidades para mejorar incluso las estrategias estándar con este indicador. El color verde significa tendencia alcista. El color rojo es una tendencia bajista.
// Más asesores expertos e in

The presented indicator clearly and very accurately displays the current trend, its beginning and end. The indicator is also used to identify support/resistance levels. The operating principle of the indicator is based on another popular and time-tested indicator - Bollinger Bands. The indicator allows you to send notifications to a mobile terminal and email. Customizable parameters: Bollinger Bands Period; Bollinger Bands Deviation; Offset Factor; Alerts - displays a dialog box containing inf
Confident trading with levels of support and resistance! We present to you the indicator " Levels of support and resistance ", which will become your indispensable assistant in the world of trading.
The indicator automatically identifies key levels of support and resistance , on the basis of which you can:
Make Exact Deals : Entering the market at levels of support and resistance greatly increases the chances of successful trading. Identify trend movements : A breakthrough or rebound from

Le presentamos el indicador "Candle closing counter", que se convertirá en su asistente indispensable en el mundo del trading.
Es por eso que saber cuándo se cerrará la vela puede ayudar:
Si usted tiene gusto de negociar usando patrones de la vela, usted sabrá cuando la vela será cerrada. Este indicador le permitirá comprobar si se ha formado un patrón conocido y si hay una posibilidad de negociación. El indicador le ayudará a prepararse para la apertura del mercado y el cierre del mercado.

The Zigzag Indicator is a powerful tool, developed to assist traders in identifying market trends by highlighting significant highs and lows of a trade. It is designed with the flexibility to adjust to fluctuating market conditions and to filter the minor price fluctuations in the market to focus on substantial ones.
The Zigzag Indicator adheres only to movements that meet a specific percentage or a defined number of points, allowing it to weed out minor price movements and focus solely on
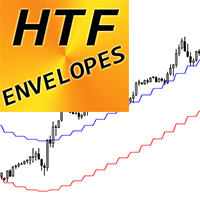
Indicador Forex "Sobres HTF" para MT4
Actualice sus métodos comerciales con los sobres HTF profesionales para MT4. HTF significa - Marco de tiempo más alto Sobres es uno de los mejores indicadores de tendencias del mercado: herramienta perfecta para operar Se utiliza para ayudar a los operadores a identificar condiciones extremas de sobrecompra y sobreventa, así como rangos de negociación. El indicador HTF Sobres es excelente para sistemas de comercio de marcos de tiempo múltiples con entrada
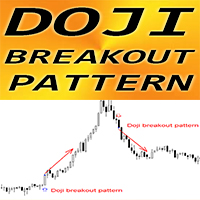
Indicador Forex "Patrón de ruptura Doji" para MT4
El indicador "Patrón de ruptura de Doji" es puro comercio de acción del precio: sin repintado, sin demoras; El indicador detecta una ruptura del patrón Doji en la dirección de la tendencia donde la vela Doji está en el medio del patrón y la última vela es la de ruptura: Patrón de ruptura alcista de Doji: señal de flecha azul en el gráfico (ver imágenes) Patrón de ruptura bajista de Doji: señal de flecha roja en el gráfico (ver imágenes) Se inc
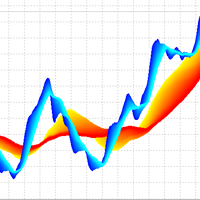
3D Trend Indicator is a non-repaint indicator using multiple moving averages with a 3D surface view. By using this indicator, you can remove uncertainties that can happen using a single and fixed moving average period. You can use a cloud area using a range of moving average periods. Also a wide range of visual settings are added to this indicator to have a better view from the cloud area. Alert and notification system added to the indicator to inform the trader about the action of candles on t
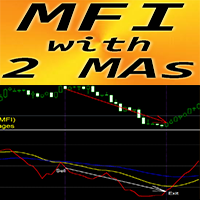
Indicador Forex "IMF y 2 medias móviles" para MT4
El índice de flujo de dinero (MFI) es un oscilador técnico que utiliza datos de precio y volumen para identificar zonas de sobreventa y sobrecompra. El indicador "MFI y 2 medias móviles" le permite ver las medias móviles rápidas y lentas del oscilador MFI El indicador brinda oportunidades para ver el cambio de tendencia muy temprano Es muy fácil configurar este indicador a través de parámetros, se puede utilizar en cualquier período de tiempo.
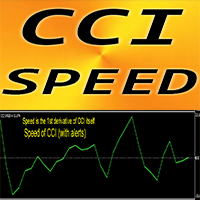
Indicador Forex "Velocidad CCI" para MT4
El cálculo de este indicador se basa en ecuaciones de la física. CCI Speed es el primer derivado del propio CCI Commodity Channel Index (CCI) mide la diferencia entre el precio actual y el precio promedio histórico CCI Speed es bueno para analizar entradas en la dirección de la tendencia principal: úselo en combinación con cualquier indicador de tendencia adecuado El indicador de velocidad CCI muestra qué tan rápido el propio CCI cambia de dirección: e

Binarias & Forex (+90% Ratio-Win Next Candle) Espere que el precio llegue a una buena zona (fuerte) sea soporte, resistencia, zona de oferta o demanda, fibonacci level key, cifra redonda. Haciendo lo anterior definitivamente habrá una reversión en el precio y obtendrá su ITM en primera vela dando una efectividad del 100% siguiendo la tendencia. Es muy importante estar atento a las noticias fundamentales en el mercado y estas no afecten tu trading. Sesiones comerciales: cualquiera (24 horas).
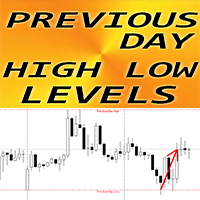
Indicador Forex "Niveles máximos y mínimos del día anterior" para MT4
El indicador "Niveles altos y bajos del día anterior" es un indicador auxiliar muy útil Los niveles máximos y mínimos de ayer son muy importantes porque el precio muy a menudo se recupera de ellos. Estos niveles pueden considerarse soportes y resistencias confiables: el precio los respeta mucho. Es un indicador útil para los operadores intradiarios que utilizan métodos de negociación de reversión y especulación. Muy bueno p
MetaTrader Market ofrece a todos los desarrollador de programas de trading una sencilla y cómoda plataforma para ponerlos a la venta.
Le ayudaremos con la presentación y explicaremos cómo preparar la descripción de su producto para el Market. Todos los programas que se venden a través del Market están protegidos por una codificación adicional y pueden ser iniciados sólo en el ordenador del comprador. La copia ilegal es imposible.
Está perdiendo oportunidades comerciales:
- Aplicaciones de trading gratuitas
- 8 000+ señales para copiar
- Noticias económicas para analizar los mercados financieros
Registro
Entrada
Si no tiene cuenta de usuario, regístrese
Para iniciar sesión y usar el sitio web MQL5.com es necesario permitir el uso de Сookies.
Por favor, active este ajuste en su navegador, de lo contrario, no podrá iniciar sesión.