适用于MetaTrader 4的技术指标 - 139
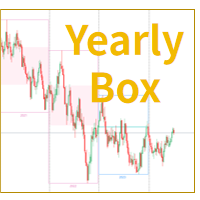
MT4年线盒子指标 MetaTrader 4平台上的“年线盒子”指标是一款看盘分析工具,将一年的价格走势直观地显示在一个矩形框内。该指标通过框定价格范围并着色背景来突出展示一年的开盘价和收盘价。交易者可以一目了然地 识别和分析年度价格波动 ,使用年线盒子指标清晰地了解市场中的年度趋势和模式。该指标提供简洁直观的年度数据可视化,帮助交易者基于历史价格走势做出明智的决策。无论你是祼K交易员,还是趋势交易员,“MT4年线盒子指标”都是一个超级有用的助手。
可以在货币对、加密货币、指数、黄金原油等多个产品上显示。 可以在各个周期下自定义显示。 可以自定义年线框、年实体的阳柱、阴柱颜色。 每个年份下方,有对应的年份数字显示。 通过对比年K线,可以一目了然的分析多空趋势。

Our new indicator is an important part of the Smart Money Concepts (SMC) system
It uses a modern market vision and fast calculation methods. As a result, the trader has a complete picture of the trade at every moment in time, which makes the process of obtaining results easier and faster.
Our new indicator displays the following important patterns:
Order Blocks. Imbalance – Fair Value Gap (FVG). Break Of Structures (BoS). Change of character (CHoCH). Equal highs & lows. Premium , Equilibrium
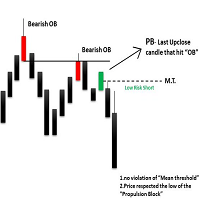
The ICT Propulsion Block indicator is meant to detect and highlight propulsion blocks, which are specific price structures introduced by the Inner Circle Trader (ICT).
Propulsion Blocks are essentially blocks located where prices interact with preceding order blocks. Traders often utilize them when analyzing price movements to identify potential turning points and market behavior or areas of interest in the market. Note: Multiple Timeframe version avaiable at here
USAGE (fingure
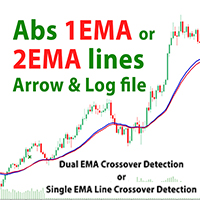
Product: 1 or 2 EMA Lines Crossover Indicator The 2 EMA Lines Crossover Indicator is a powerful and versatile tool designed for MetaTrader 4 (MT4) that helps traders identify potential buy and sell signals based on the crossover of two Exponential Moving Averages (EMAs). This indicator provides visual arrows on the chart to highlight trading opportunities, and it can also log these signals for further analysis. Whether you're a beginner or an experienced trader, this indicator can enhance your t

This indicator is based on the Cboe EuroCurrency Volatility Index, also known as Euro VIX and has a ticker symbol of EVZ . It basically measures volatility in the Eur/USD exchange rate but it can be used to track overall volitility in the Forex market. It's best usage is to add it to your system as a mandatory tool, when the value is above 7, you can expect some movement in the market, so you can trade at full risk, when the value is below 7, you trade with less risk or don't trade at all.
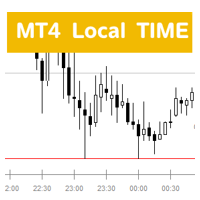
本地时间指标说明 MT4 Local Time H4box 概述 本地时间指标是一个用于 MetaTrader 4 (MT4) 平台的自定义指标,旨在提供用户所在地区的当前本地时间。此指标适用于全球各个地方,方便交易者在进行外汇交易时快速查看本地时间,从而更好地把握市场动态与交易机会。指标内带一个可选的 H4 box,方便查看 4 小时内的 K 线波动。 功能 实时显示本地时间: 指标能够实时更新并显示用户计算机的本地时间,确保信息的准确性。 适应性强: 无论用户身处哪个时区,可以手动调整并显示相应的本地时间,避免因时差而导致的误判。 可视化显示: 本地时间以清晰易读的格式显示在图表上,用户可以根据自己的需求调整字体和线段的颜色,以适应不同的图表背景。 易于查看: 紧贴 K 线的显示,在 M5、M1 这样的小周期中,时间以 4 小时为一组,紧贴 K 线的下方显示,便于查看:日内时间 显示在 H1 M30 M15 M5 M1。 使用方法 安装指标: 将指标文件复制到 MT4 的 Indicators 文件夹中,并重启平台。 添加到图表: 在导航栏中

Moving Pivot Average The pivot indicator compares the selected period with its counterpart from the previous period. The indicator uses very flexible algorithm for pivot value calculating. It allows you to allocate in days a certain time intervals (custom bars) and calculate the average pivot value based on High, Low and Close prices of these bars. How many custom bars will be taken into account is determined by the "Days" setting. The pivot line can be considered an average trend line and us

Determining the current trend is one of the most important tasks of a trader, regardless of the trading style. The Creative Trend indicator will help you do this with a fairly high probability. Creative Trend is a trend recognition indicator that uses the author's calculation algorithm. The indicator readings do not change under any conditions. The indicator is suitable for any currency pair, any timeframe, as long as there is enough historical data for calculations. Indicator Parameters
Main Se

Contact me for instruction, any questions! Introduction Chart patterns are an essential tool traders and investors use to analyze the future price movements of securities. One such pattern is the triple bottom or the triple top pattern, which can provide valuable insights into potential price reversals. This pattern forms when a security reaches a low price level three times before reversing upward or reaches a high price level three times before reversing downward.
Triple Top Bottom P
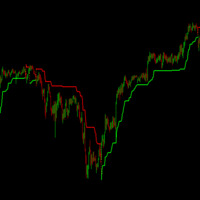
The classic SuperTrend indicator. The best indicator to define trends and small-scale trend changes in any pair and time frame. It is set up in exactly the same way as the TradinView indicator, and can be adjusted and complemented with other indicators to create profitable strategies or expert advisors, or used individually to profit from the market. Based on the average volatility of the last candles and the price movement, it draws a green line below the price if an bullish microtrend is ident
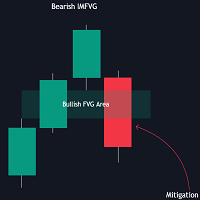
The FVG Instantaneous Mitigation Signals indicator detects and highlights "instantaneously" mitigated fair value gaps (FVG), that is FVGs that get mitigated one bar after their creation, returning signals upon mitigation.
Take profit/stop loss areas, as well as a trailing stop loss are also included to complement the signals.
USAGE Figure 1 Instantaneous Fair Value Gap mitigation is a new concept introduced in this script and refers to the event of price mitigating a fair value gap one

The One and Only!, simply the best!, amazing! entry indicator Golden Move. Try it yourself as it proves its quality with its results.
Settings: AlertConfirmation: turns on and off alerts CalculatedBars: how many bars will be calculated Distance : arrow distance
Buffers: Buffer0 (Arrow Buy) Buffer1 (Arrow Sell) Buffer2 (Buy value == 1) Buffer3 (Sell value == 1)

Moving pivot Average Fibonacci
The indicator compares the selected period with its counterpart from the previous period. The indicator determines the moving Fibonacci levels for the day or any time interval to assess the price movement range from the time average. The indicator helps predict the expected high or low for the day based on historical time data. The pivot line can be considered an average trend line and use it in a variety of trading strategies.
If you have any question about the

Dynamic Range Indicator for MQL4 Introducing our cutting-edge Dynamic Range Indicator , specifically designed for 5-minute charts, featuring a proven back-testing record to ensure reliable performance. Key Features: Blue and Red Lines: The indicator uses two dynamic lines to represent market volatility. Calculation Method: The lines are constructed using the last 14 days' average absolute movement of 5-minute closing prices, multiplied by today's session open price. Indicator Formula: Today's op
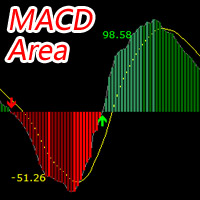
MACD Area 指标,基于系统自带的MACD指标,进行增强功能的开发。 主要增强为:平均算法+四色量柱+面积值。 默认使用Exponential平均算法(即EMA),四个算法可任意选择。 算法一:Simple (SMA 算术移动平均线)基础之作
SMA,算术移动平均线的简称,其计算方法是将最近N天的收盘价相加,然后除以N,赋予每一点相同的权重,呈现趋势的平均轨迹。在交易界,许多软件默认的均线指标就是SMA,因其直观易懂。
算法二:Exponential(EMA 指数移动平均线)敏捷的反应者
不同于SMA,EMA采用指数加权方式,赋予近期内的价格更高的权重。计算时,今日收盘价乘以特定乘数(如20日线的乘数为0.0952)加昨日EMA的值。这让EMA对价格波动更为敏感,对于短期趋势的捕捉更为敏锐。
算法三:Smoothed(SMMA平滑移动平均线)稳健的平衡者
SMMA不急于剔除旧数据,而是降低权重处理。首日计算与SMA相同,随后每个新数据点的权重递减。这种平滑性使得SMMA在趋势识别上更为平滑,减少短期波动的影响。
算法四:Linear Weighted(LWMA 线性

The Smart Divergence Dashboard is your ultimate tool for identifying high-probability trading opportunities. This cutting-edge indicator is meticulously designed to detect Regular Divergences, offering traders a clear and actionable advantage. MT5 Version - https://www.mql5.com/en/market/product/120703/ Key Features: Real-time Divergence Detection: Instantly pinpoints Higher High/Lower Low and Oscillator Higher Low divergences across multiple currency pairs and timeframes using Awesome Oscill

First and foremost, the Insight Flow Indicator stands out as a Non-Repainting, Non-Redrawing, and Non-Lagging tool. This makes it a prime choice for both manual and algorithmic trading, ensuring reliable and consistent signals. User Manual: Settings, Inputs, and Strategy The Insight Flow Indicator leverages price action, strength, and momentum to provide a clear edge in the market. Equipped with advanced filters, it eliminates noise and false signals, enhancing trading potential. By using multip
Introducing Sterling Blaster V1.0: Specifically engineered for the unique nature of GBPUSD, delivering a remarkable around 99% success rate and an excellent way to achieve prop firm challenges. USE 5MIN TIMEFRAME Sterling Blaster Features: Optimal for GBPUSD : Tailored to deliver outstanding performance on GBPUSD. Exceptional Success Rate : Achieves a remarkable around 99% success rate based on extensive backtesting. Thoroughly Backtested : Verified through years of historical data. Risk Managem

基于常用的ZigZag指标,对指标进行了深入的挖掘,主要两项改进: 一、对每一个ZZ价格点的进行标注;对相邻两个ZZ点之间的距离点数进行标注,更方便直观地查看价格波动的距离。 二、对当前的ZZ价格方向,画斐波线。斐波线包括两种类型:斐波回调水平线与斐波扩展水平线。当最末的四个ZZ点,符合道氏123法则时,就画斐波扩展水平线。如果不符合123法则,就画斐波回调。斐波线对盈利的点位具体非常好的参考作用。 三、在参数设置中,对标注的价格与距离,可进行文字大小的设置,以及分别进行颜色设置,根据颜色更好地分辨两组不同的数值。 四、对ZigZag线的颜色可以设置。 在不同的时间周期进行切换,你会得到不同的ZZ线。交易通常遵循的原则:顺着大周期的方向,进行顺势交易,在小周期中的行情转折处入场,是最明智的、是也最容易赚钱的方式。
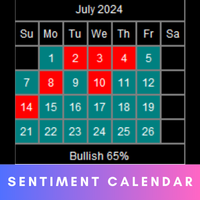
The Market Sentiment calendar provides a visual representation of market sentiment for each day or month. It will display daily and monthly BIAS . The calendar also highlights the percentage of bullish days or months within a given month or year. MT5 version - https://www.mql5.com/en/market/product/120768/ Inputs Frequency: Choose between "Daily" and "Monthly" calendar views. Sentiment Method: Select the method to determine daily or monthly sentiment: " L inear Regression ", " Accumulated Delta

Trend Divergence Indicator: Your Essential Tool for Market Analysis The Trend Divergence Indicator is a powerful tool designed to assist traders in identifying market trends and pinpointing entry points with precision. By leveraging price divergence, this indicator enhances your trading strategy, offering reliable insights and filtering unnecessary signals. Key Features and Benefits of the Trend Divergence Indicator Accurate Trend Analysis: The Trend Divergence Indicator uses price divergence t

This product is based on the methodologies of Gann, his follower Don E. Hall. The Indicator builds a working view grid, which is used to analyze graphics. The Pyrapoint tool, developed by Don Hall, is a grid based on the Pythagorean cube. In his calculations he uses the Gann Square 9 methodology and the relationship between Price and Time. This tool is used to predict changes in trend and overall market actions.
More information about the method HERE
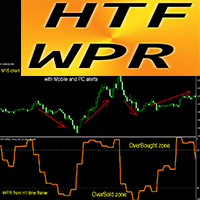
适用于 MT4 的强大 Crypto_Forex 指标 HTF WPR 振荡器。
- 使用适用于 MT4 的专业 HTF WPR 振荡器升级您的交易方法。HTF 表示 - 更高时间框架。 - WPR 是剥头皮交易的顶级振荡器之一。 - 该指标非常适合多时间框架交易系统,价格行为条目来自超卖/买入区域。 - HTF WPR 指标允许您将更高时间框架的 WPR 附加到当前图表 --> 这是专业的交易方法。 - 指标具有内置的移动和 PC 警报。 .................................................................................................................... // 出色的交易机器人和指标可在此处获取: https://www.mql5.com/en/users/def1380/seller 它是仅在此 MQL5 网站上提供的原创产品。

The best indicator out there, try it yourself! Please leave your positive comments and reviews!
Settings: AlertConfirmation: truns on and off alerts CalculatedBars: how many bars will be calculated Distance : arrow distance
Buffers: Buffer0 (Arrow Buy) Buffer1 (Arrow Sell) Buffer2 (Empty) Buffer3 (Empty) Buffer4(Buy value == 1) Buffer5(Sell value ==1)

The ICT Immediate Rebalance Toolkit is a comprehensive suite of tools crafted to aid traders in pinpointing crucial trading zones and patterns within the market.
The ICT Immediate Rebalance, although frequently overlooked, emerges as one of ICT's most influential concepts, particularly when considered within a specific context. The toolkit integrates commonly used price action tools to be utilized in conjunction with the Immediate Rebalance patterns, enriching the capacity to discern conte

本指标是一个信息展示板,可以显示每日波动率,方便交易者快速统计查看。
可以显示以下信息: 昨天的高、低和收盘价。 今天的高点、低点、开盘价。 动态显示从今天开盘到当前价格涨幅点数。 计算并显示今天、昨天、5天、10天、20天、30天和90天的平均日内涨跌点数。 当前实时点差。 当前实时报价。
我在左下角增加了一个快捷的控制面板,在同时开启多个不同的Bank系列指标时,控制面板可以快捷开关显示/隐藏各个指标,以便于图表中不会同时显示很多个指标而很显的很乱。 参数说明: Indicator ID: 指标的唯一ID。当启动多个实例的时候该ID必须唯一不能重复。 Control Panel Pos X: 指标控制面板的X位置。 Control Panel Pos Y: 指标控制面板的Y位置。 Control Panel Dislpay Name: 指标控制面板显示的文字内容。 Yesterday High Text: 昨日高点标题显示的文本内容。 Yesterday Low Text: 昨日低点标题显示的文本内容。 Yesterday Close Text: 昨日收盘标题显示的文本内容。

Zigzag指标可以帮助交易者识别和确认价格走势中的主要趋势和反转点。通过连接显著的高点和低点,Zigzag指标能够清晰地显示出市场的整体趋势,帮助交易者在分析价格行为时做出更明智的决策。
支持任意时间周期。
我为它在左下角增加了一个快捷的控制面板,在同时开启多个不同的Bank系列指标时,控制面板可以快捷开关显示/隐藏各个指标,以便于图表中不会同时显示很多个指标而很显的很乱。
参数说明: Indicator ID: 指标的唯一ID。当启动多个实例的时候该ID必须唯一不能重复。 Control Panel Pos X: 指标控制面板的X位置。 Control Panel Pos Y: 指标控制面板的Y位置。 Control Panel Dislpay Name: 指标控制面板显示的文字内容。 Depth: 设置深度。这个参数决定了在价格走势中识别波动的最小数量。较大的Depth值意味着只有在价格经过一定的波动后,Zigzag指标才会绘制新的高点或低点。简而言之,Depth控制了Zigzag指标对价格变化的敏感度,值越大,指标越不敏感。 Deviation: 设置幅度。这个参数控制了

PinBar是一种常见的蜡烛图形态, 通常被用作反转信号。 该指标会在PinBar形成后,用箭头在PinBar位置标注出。 支持任意时间周期。 当前本指标仅根据K线上下影线和实体数值计算判断,后期会加入根据行情其它因素智能判断。
我为它在左下角增加了一个快捷的控制面板,在同时开启多个不同的Bank系列指标时,控制面板可以快捷开关显示/隐藏各个指标,以便于图表中不会同时显示很多个指标而很显的很乱。
参数说明: Indicator ID: 指标的唯一ID。当启动多个实例的时候该ID必须唯一不能重复。 Control Panel Pos X: 指标控制面板的X位置。 Control Panel Pos Y: 指标控制面板的Y位置。 Control Panel Dislpay Name: 指标控制面板显示的文字内容。

吞没是一种常见的蜡烛图形态, 通常被用作反转信号。 该指标会在吞没形成后,用双箭头在吞没位置标注出。 支持任意时间周期。 当前本指标仅根据K线上下影线和实体数值计算判断,后期会加入根据行情其它因素智能判断。
我为它在左下角增加了一个快捷的控制面板,在同时开启多个不同的Bank系列指标时,控制面板可以快捷开关显示/隐藏各个指标,以便于图表中不会同时显示很多个指标而很显的很乱。
参数说明: Indicator ID: 指标的唯一ID。当启动多个实例的时候该ID必须唯一不能重复。 Control Panel Pos X: 指标控制面板的X位置。 Control Panel Pos Y: 指标控制面板的Y位置。 Control Panel Dislpay Name: 指标控制面板显示的文字内容。

The only indicator i use with MA. Best indicator for me it shows everything you need to know for trading. Many updates will be in the future. If you have any idea what to add to it then comment or write me or if you have any issues please comment or write me , but i didnt found any error in it , everything works perfectly fine. --------------------------------------------------------------------------------------------------------------------------------------------------------------------------

A simple indicator for plotting a tick chart.
This indicator will allow you to track the spread dynamics and the price behavior in general.
In the settings, you can select the price to display on the chart - Bid, Ask or both prices at the same time.
Tick Chart Indicator will definitely be useful when using scalping strategies. The MT5 version is available here . Good luck to everyone and successful trading!
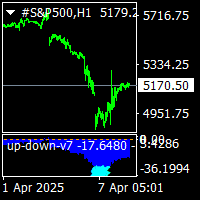
up down v7 indicator is a no repaint trend indicator.this is different version of up down v9.use different algoritm. it works all pairs and and all timeframes. dont use processed value lower than 500 bars.you can increase it acording to chart bar counts.2000-3000 there is blue histogram gives divergencies and extreme points. when gold points on histogram it gives extreme sell signal. when aqua points below histogram it gives extreme buy signal. for to see extreme signals switch timefremes 1m

El indicador "MR BEAST ALERTAS DE LIQUIDEZ" es una herramienta avanzada diseñada para proporcionar señales y alertas sobre la liquidez del mercado basándose en una serie de indicadores técnicos y análisis de tendencias. Ideal para traders que buscan oportunidades de trading en función de la dinámica de precios y los niveles de volatilidad, este indicador ofrece una visualización clara y detallada en la ventana del gráfico de MetaTrader. Características Principales: Canal ATR Adaptativo: Calcula

Simple but great indicator to improve your trading. ----------------------------------------------------- Test it as it proves its value with its results.
Settings: AlertConfirmation: turns on and off alerts CalculatedBars: how many bars will be calculated Distance : arrow distance
Buffers: Buffer0 (Arrow Buy) Buffer1 (Arrow Sell) Buffer2 (Buy value 1) Buffer3 (Sell value 1)
Hello
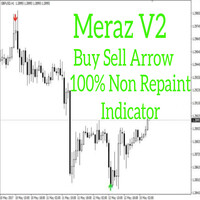
Alright. This indicator works on MT4 and is very easy to use. When you receive a signal from it, you wait for that candle with the signal to close and you enter your trade at the beginning of the next new candle. A red arrow means sell and a green arrow means buy. All arrows comes with a long dotted like for easy identification of trade signal. Are you okay with that? 100% non repaint Work All Major currency Pair, 1 minute time frame 1 minute expire, 5 minute timeframe 5 minute expire
Supply and Demand Professional is a powerful tool suited for advanced traders! Easily see levels of supply and demand (or support and resistance) as they develop. *This is a NON-repainting indicator* How this can help you?
Levels can be used for stop loss and take profit targets Automatically identifying key levels in the market Spotting market imbalances Better entry levels and timing of trades Volume analysis Understanding market sentiment Predicting price movements Risk management Trend co
Imbalance is one of the important zones on the chart, to which the price will always strive to cover it. It is from the imbalance zone that the market most often makes significant reversals, rollbacks and gives entry points that you can successfully trade. In the Smart Money concept, the imbalance zone is used to find an entry point, as well as a place for take profit at the level of imbalance overlap by the price. Until the imbalance is overlapped, it is the closest target for the price. Ho
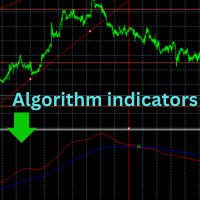
Welcome, thank you for choosing us Read carefully before starting When you turn on the indicator, leave it for about an hour or two. It will automatically collect the data, and then its shape will be complete and it will start balancing the new data. We offer you the latest indicators that will help you make decisions after creating your own technical analysis
You will see the entry point that you will use to get a good deal
At each intersection there is an opportunity for a deal that the ind
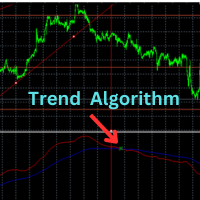
歡迎您,感謝您選擇我們
開始前請仔細閱讀
打開指示器後,將其放置約一兩個小時。它將自動收集數據,然後其形狀將完成,並開始平衡新數據。
我們為您提供最新指標,幫助您在創建自己的技術分析後做出決策
您將看到用於獲得優惠交易的切入點
在每個交叉路口都有一個交易機會,指示器透過標記向您顯示
建議僅在較長時間內使用該指標,超過半小時,機會很明顯,比率為 70%
該指標仍在開發中,以添加新功能,將來可能會轉移到專家
目前完整版的初始價格為 30 美元
最新版本發布後,訂閱將按月進行
您現在就可以享受並獲利,不要忘記外匯需要耐心,獲利時不要貪婪
隨著時間的推移,一滴水會充滿杯子 ...............................................................................

This indicator is collection of important dynamic support and resistance giving a trader crystal clear idea , where to sell and where to buy. it completely complements trend lines, support, resistance, and sideways market and allow a trader to make sustainable profits. The thickness of lines suggests its strengths, the thicker the dynamic line, the stronger is rejection or pullback allowing a trader to make multi-fold profit, as they can clearly see them.
Introducing Your Ultimate Trading Edge:

This powerful and insightful indicator is based on a leading version of the EURUSD proxy trade, such that the day's underlying direction can be inferred through the intraday volatility and market noise.
Predicting the day's overall trend.
Market price action is deceptive, misleading, no one has ever profitted consistently by just following latest price action. This also fools single market and momentum based indicators, since the main data used is market price.
Intermarket analysis on the ot

DTFX Algo Zones are auto-generated Fibonacci Retracements based on market structure shifts.
These retracement levels are intended to be used as support and resistance levels to look for price to bounce off of to confirm direction.
USAGE Figure 1 Due to the retracement levels only being generated from identified market structure shifts, the retracements are confined to only draw from areas considered more important due to the technical Break of Structure (BOS) or Change of Character (CHo
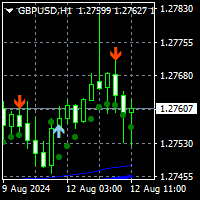
To get access to MT5 version please click here . This is the exact conversion from TradingView: " SSL Hybrid" by Mihkel00.
This is a light-load processing and non-repaint indicator. All input options are available. Buffers are available for processing in EAs. You can message in private chat for further information/changes you need. Thanks for downloading

This indicator works on MT4 and is very easy to use. When you receive a signal from it, you wait for that candle with the signal to close and you enter your trade at the beginning of the next new candle . A red arrow means sell and a green arrow means buy. All arrows comes with Alert like for easy identification of trade signal. Are you okay with that?
1 minute candle
1 minute expire

【 TrendLinePro2 】 MT4 (MetaTrader 4) line trading aid indicator. It is a very basic specification that is recommended for everyone, assuming that it is faithful to the Dow Theory. It recognises trends based on the Dow Theory and furthermore automatically draws support, resistance and trend lines in real time. The accuracy is very high.
【 ZigZag 】 Based on the original zigzag created from the chart shape and in line with Dow Theory. The trend that can be read from the zigz
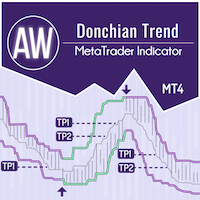
AW Donchian Trend 是一款基于 Donchian 通道的趋势指标。该指标可以计算获利和止损水平,具有信号成功率的高级统计数据,以及三种有关接收信号的通知类型。 设置指南和说明 - 此处 / MT5 版本 - 此处 如何利用指标进行交易: 使用 AW Donchian Trend 进行交易只需三个简单步骤: 步骤 1 - 开仓 在 M15 时间范围内收到成功率超过 70% 的买入信号,我们检查 H1 和 D1 上的趋势方向,当信号方向和更高时间范围内的趋势匹配时,我们开仓
第 2 步 - 定义 止损 通过相反信号或动态计算止损水平来选择止损 步骤 3 - 定义获利策略 策略1:达到TP1时全部平仓
策略 2:达到 TP1 时平仓 50%,达到 TP2 时平仓剩余 50%
策略三:趋势反转时全仓平仓 优点: 动态计算进入和退出水平 根据当前波动性计算获利,以便更准确地入场 关于新信号出现的三种通知类型 不重新绘制信号和历史记录 高级统计模块 统计模块: 为了选择最佳交易符号,请使用内置的统计计算。 计算交易 - 给出统计的信号总数 成功率 - 到达 TP
Follow Line 指标是交易者用于准确识别和跟随市场趋势的重要工具。该指标动态适应价格变化,绘制一条平滑、连续的线来跟踪价格走势。凭借其视觉上的简洁性和有效性,能够提示趋势变化,Follow Line 是任何交易者策略中的绝佳补充。 主要特点: 趋势跟踪: Follow Line 紧随价格变化,使交易者能够轻松识别当前的市场趋势。 视觉简洁: 通过清晰明确的线条,即使是经验不足的交易者也能快速理解市场方向。 适应性强: 适用于各种时间框架和工具,适合从日内交易到波段交易的多种交易策略。 如何使用: 安装: 将 Follow Line 指标添加到您希望分析的金融工具的图表上。 设置: 根据您的交易策略调整指标参数。 趋势分析: 观察 Follow Line 线条以确定当前趋势方向。 交易机会: Follow Line 在趋势市场中特别有用。例如,在突破情境中,当价格超过重要的阻力或支撑位时,Follow Line 可以确认走势的有效性。这使交易者能够更加自信地把握价格波动的机会。

Trend Cutter 是一种趋势指标,可用于任何时间范围,包括 M1 和 M5 等较低时间范围。该指标对于喜欢日内交易的交易者来说是理想的选择,并且对那些喜欢长期交易的交易者也有帮助。您可以使用该指标作为您的交易系统的基础或作为独立的交易解决方案。
该指标提供所有类型的警报,包括推送通知。 指标中有一个易于使用的输入参数,可让您按照您希望的方式调整信号。此选项将为您提供交易的灵活性。 您也可以在任何您想要的市场进行交易。
该指标非常容易使用。您只需遵循信号即可。我还将免费向该指标的所有用户提供附加指标,这将帮助您尽可能高效地使用该方法。 购买后请联系我以获得我的交易提示和丰厚奖金! 感谢您的关注! 祝您交易顺利、盈利!

Candle Info"指标适用于MetaTrader 4 (MT4),帮助交易者直接在图表上分析和可视化关键蜡烛形态。通过识别如更高高点 (HH)、更低低点 (LL)、更高低点 (HL) 和更低高点 (LH) 等形态,提供市场趋势和潜在价格走势的洞察。 主要功能: 蜡烛形态: 识别并标记HH、LL、HL、LH,以及诸如HH & HL(看涨趋势)和LL & LH(看跌趋势)的组合。 交易时段过滤: 允许根据主要交易时段(东京、伦敦、纽约、悉尼)过滤形态,便于集中关注重要的市场时间。 警报: 可配置的屏幕、推送、邮件和声音警报,提醒交易者新形态。 自定义: 调整文字颜色、大小,并选择显示哪些时段或形态。 非常适合趋势交易和基于时段的策略,"Candle Info"指标简化了市场分析,帮助交易者更快做出明智的决策。

The Binary Profit Maker,
This indicator works on MT4 and is very easy to use. When you receive a signal from it, you wait for that candle with the signal to close and you enter your trade at the beginning of the next new candle . A Up Purple arrow means Buy and a Down Purple arrow means Sell. All arrows comes with Alert like for easy identification of trade signal. Are you okay with that?
How To Enter Trade?
1 minute candle
1 minute expire
This indicator is designed to help us capture breakout momentum using the Fibo Musang Candle Breakout Retes system. With its multi-time frame signal feature displayed on a single screen, we can easily identify the right entry points and quickly take advantage of market momentum. The main benefit is its ability to avoid the traps of false breakouts or misleading trends that often confuse traders. To maximize trade potential, use Fibo Musang for entry, following the direction of the signal from t

This indicator/dashboard , is place on a single symbol. It shows the percentage of movement withing all time frames from M1 to W1.The text will change green if all % are in the positive for a buy signal.The text will change red if all % are below zero and in negative for a sell signal. There are audible notifications, as well as on screen notifications along with push notifications that can be turned on and ON/OFF in the settings.
This is a sure way to Find trends quickly and efficiently, with
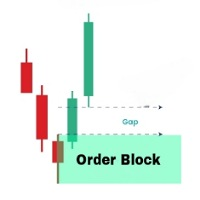
OrderBlock Analyzer 是一个定制的MetaTrader 4 (MT4) 指标,用于在价格图表上检测并标记订单块(Order Blocks)。此工具帮助交易者识别关键的市场结构,显示可能的反转或延续区域。OrderBlock Analyzer 基于市场行为自动绘制订单块,并通过颜色区分看涨和看跌块。 主要功能: 检测和绘制看涨和看跌订单块。 实时更新图表上的订单块,以便快速识别潜在的交易机会。 自定义订单块的颜色、填充线和线条样式。 灵活设置填充线的显示和厚度。 此指标适用于各类交易者,尤其适合趋势交易和反转交易策略。
............................................
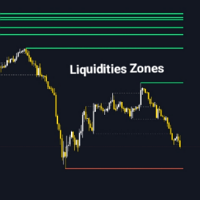
Liquidity Zone Detector 是一款高级技术指标,旨在通过使用 ZigZag 指标来识别和标注市场中的关键流动性区域。该工具通过在 ZigZag 检测到的高点和低点绘制趋势线来定位可能存在显著流动性的价格水平。Liquidity Zone Detector 帮助交易者根据流动性的累积或释放发现潜在的反转或趋势延续区域。 主要特点: 自动识别流动性区域 :在 ZigZag 指标识别的高点和低点绘制趋势线。 高级定制 :可配置流动性线的颜色、厚度和样式。 动态颜色变化 :当流动性水平被突破时,可选择更改线条颜色。 可调 ZigZag 参数 :调整 ZigZag 的深度、偏差和回溯步长以获得更精确的检测。 Liquidity Zone Detector 是分析市场结构并识别可能发生显著价格变动的关键区域的交易者的必备工具。
Доброго времени суток.
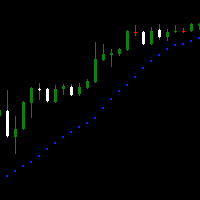
Вашему вниманию простой, но крайне удобный продукт для любителей индикатора Parabolic SAR . Он представляет собой окно осциллятора, на который выводится несколько тайм-фреймов в режими реального времени вместе с индикатором.
Настройки интуитивно понятные, что бы включать и отключать количество выбранных таймов - необходимо применять PERIOD_CURRENT, в таком случае дополнительный тайм не откроется.
Пишите в комментариях к продукту, что бы вы хотели увидеть в новых версия
什么是"实时多指标"? "实时多指标" 是一款先进的交易工具,旨在简化和优化您的技术分析。这款革命性指标收集多个时间框架和技术指标的信号,并将它们显示在一个清晰易读的表格中。如果您希望在不必不断切换图表或手动分析每个指标的情况下获得完整和详细的市场视图,"实时多指标" 是您的理想解决方案。 为什么选择"实时多指标"? 多时间框架分析: "实时多指标" 允许您同时监控多个时间框架的市场。从M15到H4,这个指标清楚地显示了每个时间框架的趋势是上升还是下降,帮助您根据市场的整体视图做出明智的决策。 多个指标的集成: 该工具结合了多个关键技术指标的信号,如Parabolic SAR, MACD, SMA, ADX 和 CCI。无需分别分析每个指标,"实时多指标" 为您提供了全面而详细的概览,清晰地显示了多个时间框架中的趋势和买卖信号。 清晰的汇总表: "实时多指标" 的一个突出特点是其汇总表。此表清晰显示了每个时间框架中每个指标的买入或卖出信号,使市场状况一目了然,并使您能够迅速应对机会。 易于使用: 无论您的交易经验水平如何,"实时多指标" 都被设计为用户友好型。直观的界面和信息的有序呈现
MACD Indicator The Moving Average Convergence and Divergence (MACD) is a trend following momentum indicator which shows the relationship between two moving averages that we chose and configure them on the indicator. The MACD is calculated by subtracting the 26-period exponential moving average and the 12 period D.A.M. These are the default parameters when you put the MACD indicator on the charts, and the period is usually 9 which means the last 9 candles. DT-Oscillator This is Robert C. Miner's

he "Super Trampoline" is an innovative trading indicator designed to simplify decision-making in financial markets. It analyzes chart data and provides clear and timely signals on when to buy or sell an asset, based on a proven strategy of candlestick pattern analysis. Product Advantages: Intuitive Interface : "Super Trampoline" integrates directly into your trading terminal, displaying signals as simple arrows on the chart. This means you don't need deep technical analysis knowledge to start us

Introducing "Super Transplant with Filter" — a game-changing tool for traders who value precision, reliability, and simplicity. This indicator combines advanced trend analysis techniques with intelligent signal filtering, allowing you to make decisions based on the most relevant data. Benefits of "Super Transplant with Filter": Accuracy in Every Trade : The indicator meticulously analyzes market data, identifying key trends while filtering out false signals. This enables you to make more informe
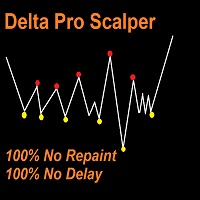
Delta Pro Scalper - Your Ultimate Trend Trading Solution, Delta Pro Scalper is a TREND indicator that automatically analyzes the market and provides information about the trend without redrawing or delay.
The indicator uses candlestick OHLC data and analyzing them to determine up trend or down trend, You MUST wait till closing candle, once the dot appear the next open candle you can open buy or sell position.
Red Dot = Bearish Trend (Open SELL)
Yellow Dot = Bullish Trend (Open BUY)
Here's the f

Trend detection is one of the basic challenges of every trader. Finding a way to tell when to enter a trade is very important, timing is a game changer, not too early and not too late. Sometimes, due to not knowing the market conditions, the trader closes his positions with a small profit or allows the losses to grow, these are the mistakes that novice traders make. Indicator Trend Whipper is a complete trading strategy and can improve the trader's trading process. The trend detection algorithm
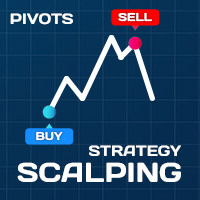
Scalping Strategy BUY SELL
Having a strategy in the market is one of the main conditions for trading. The presence of various and complicated indicators and tools sometimes makes trading difficult, and the user gets confused after trying various methods and gets stuck in a loss cycle, the result of which is usually clear. This indicator is a simple strategy based on the detection of pivots and short-term trends, which helps you to easily trade in trends. Sometimes a simple but efficient str

TitanVision indicator is a versatile technical analysis tool that helps traders identify market trends and potential entry and exit points. It features a dynamic Trend Catcher Strategy, adapting to market conditions for a clear visual representation of trend direction and various trend reversal points. Traders can customize the parameters according to their preferences. The indicator helps in identifying trends, signals possible reversals, acts as a trailing stop mechanism and provides real-tim

Reversal Zones Pro is an indicator specifically designed to accurately identify key trend reversal zones. It calculates the average true range of price movement from the lower to upper boundaries and visually displays potential zones directly on the chart, helping traders effectively identify important trend reversal points. Key Features: Reversal Zone Identification: The indicator visually displays potential reversal zones directly on the chart. This helps traders effectively identify importan
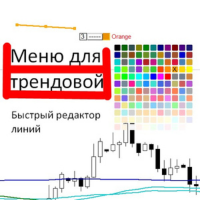
Выпадающее меню для трендовых линий и прямоугольника. Позволяет редактировать цвет, стиль и толщину. При выделении линии появляется меню, каждая функция разделена. Можно сразу нажать и поменять на нужное. Толщина меняется по другому, нужно нажать на цифру, она станет в синем цвете, нажать нужную цифру от 1 до 4, в зависимости от нужной толщины, нажать интер.

MT4 is a Histogram version of MT5: https://www.mql5.com/en/market/product/122151 Introducing Trade Sniper: Your Edge in the Markets. Tired of missing profitable trades or getting caught on the wrong side of the market? Meet Trade Sniper, the cutting-edge indicator that harnesses the power of trends to give you a razor-sharp advantage in your trading. Trend Sniper is not just another run-of-the-mill indicator. It's a sophisticated tool that combines advanced algorithms with time-tested trading
增强型RSI:更深入的技术分析混合指标 增强型RSI是一种多功能且可定制的技术指标,旨在为交易者提供更全面和准确的市场分析。通过结合移动平均线、RSI和MACD的最佳特性,该指标提供了动量和趋势强度的多维视角。 主要特点: 完美融合: 增强型RSI融合了移动平均线、RSI和MACD的功能,提供了更完整的价格走势视图。 最大灵活性: 通过可定制的周期,指标适应任何交易风格和时间框架。 多功能性: 它适用于任何金融资产,从外汇到加密货币、股票和指数。 分析支持: 增强型RSI不是自动交易系统,而是一个提供有用信号和确认的工具,以增强您的技术分析。 工作原理: 增强型RSI计算RSI的指数移动平均线,并将其与MACD的信号相结合。结果是一个振荡器,识别超买和超卖条件,发出背离信号并确认趋势。 优点: 更可靠的信号: 多指标的结合减少了错误信号的风险。 趋势反转的提前预测: 增强型RSI可以帮助比其他指标更早识别趋势反转。 自定义: 通过调整移动平均线周期、RSI水平和MACD参数,将指标定制为满足您的特定需求。 用途: 趋势识别: 增强型RSI帮助确认趋势方向并识别累积和分配阶段。 入场和出

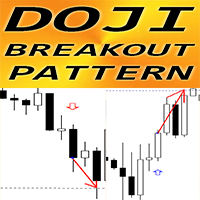
Crypto_Forex 指标“十字星突破模式”适用于 MT4。
- 指标“十字星突破模式”是纯粹的价格行为交易:无重绘,无延迟; - 指标检测十字星模式突破趋势方向,其中十字星蜡烛位于模式中间,最后一根蜡烛是突破蜡烛: - 看涨十字星突破模式 - 图表上显示蓝色箭头信号(见图片)。 - 看跌十字星突破模式 - 图表上显示红色箭头信号(见图片)。 - 带有 PC、手机和电子邮件警报。 - 指标“十字星突破模式”适合与支撑/阻力位结合使用。 .................................................................................................................... // 出色的交易机器人和指标可在此处获取: https://www.mql5.com/en/users/def1380/seller 这是仅在此 MQL5 网站上提供的原创产品。

Super Reversal Pattern Indicator
Unlock the power of advanced pattern recognition with our Super Reversal Pattern Indicator. Designed for traders seeking precision and reliability, this indicator identifies one of the most effective reversal patterns in technical analysis, offering a significant edge in your trading strategy. Key Features: Non-Repainting Accuracy: Enjoy the confidence of non-repainting technology. Once a Super Reversal Pattern is detected, it remains static, providing consiste
MetaTrader市场是 出售自动交易和技术指标的最好地方。
您只需要以一个有吸引力的设计和良好的描述为MetaTrader平台开发应用程序。我们将为您解释如何在市场发布您的产品将它提供给数以百万计的MetaTrader用户。
您错过了交易机会:
- 免费交易应用程序
- 8,000+信号可供复制
- 探索金融市场的经济新闻
注册
登录