适用于MetaTrader 4的技术指标 - 115
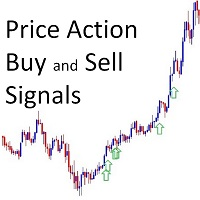
Buy and Sell Arrows On The Chart According To Price Action Sends Alerts On MT4 To Your Phone To You Email
Does NOT repaint. Works on any pair, any timeframe.
10 Activations allowed so you are free from limitations. MT5 Version here . For spreads from a tiny 0.1pip RAW/ECN Accounts, click here . Check out my Waka Esque EA signal here: >> High Risk Settings or Medium Risk Settings .
When you get a signal, all you need to do is check the previous structue highs and lows to use as your
Индикатор iVeles_Trend_X_II - использует специализированный расчет текущих цен графика. Очень качественно и своевременно показывает смену направления, более того, отображаемая цена индикатора может быть использован в качестве уровня принятия решения. Работает качественно на любом ТФ и с любым инструментом. Параметры: period - период расчетов average - усреднение МА method - применяемый метод shift - сдвиг показаний
Индикатор iVeles_Perfect_Oscilator является опережающим и одним из самых лучших осциляторов на сегодняшний день, использует специализированный расчет текущих цен графика. Очень качественно и своевременно показывает смену направления, очень точный подход к уровням перекупленности и перепроданности, что позволяет своевременно принять решение по сделке. Работает качественно на любом ТФ и с любым инструментом. Параметры: period_Osc - период расчетов average_Osc - усреднение МА method_Osc - прим

AlgoKing Chandelier Exit Indicator (MT4)
The Chandelier Exit Indicator is a volatility based indicator that maximizes returns using the Average True Range (ATR) value and the highest high or lowest low of a period. Benefits Should be used as a trailing stop. Helps you exit a position when you have a respectable profit. Identifies a high probability of a trend reversal when the price moves against the prevailing trend by a distance equal to 3x the average volatility. Join the AlgoKing Lightning

The indicator refers to the means of probabilistic analysis. Prediction is performed by the Monte Carlo method together with a mathematical model of a neuron. But, the modeling of samples for this method is made not artificially, but comes from the original "nature", that is, from history. The number of samples and the detail of their modeling is achieved using the lower (relative current) timeframe.
Indicator algorithm :
In general terms, the algorithm boils down to the fact that the indica

DYJ变色龙基于趋势跟踪和反趋势系统。 DYJ变色龙是一种高概率指示器。该指标使用独特的混合指标,将复杂的指标与用户的判断力相结合。 该指标是一种最先进的Ma交叉和方差算法。 该指示器显示一个彩色方向箭头,指示交易者的最佳进入和退出位置。 当入场是BUY信号,同时它也是上一次入场SELL的离场信号. 你能通过邮件或手机推送接收到信号通知,在通过手机手动开仓
参数 InpPeriod = 50 -- Period InpPrice = PRICE_TYPICAL -- 价格应用方法,您能根据自己的货币对偏好和交易习惯,选择更佳的价格方法 InpMethod = MODE_SMA -- 4种MA模式方法 ,MODE_SMA,MODE_EMA,MODE_SMMA,MODE_LWMA

UR發散觀察儀
UR DivergenceSpotter 是多年經驗的結晶,有時最簡單的方法就是最好的。 一些指標之間存在良好的相關性,但當它們不匹配時 - 價格試圖“重新調整” - 正是在那個時刻我們通過 UR DivergenceSpotter 收到信號。
使用 UR Divergence Spotter 的優勢:
無參數 蠟燭創建後不重繪 當信號不再有效時發出信號(這意味著您可以持有更長時間的交易,將止損設置為 BE 並讓它運行,獲取部分利潤或完全關閉它!)。 該指標是多年經驗和觀察的結果。 它堅固且經過測試。 最好在更高的時間範圍 (h1/h4) 中使用以獲得更好的結果和更安全的信號。
另一種方法是將它與我的其他指標(如 UR TrendExhaustion 或 UR VolumeTrend)一起使用,以獲得更好的信號准確性。 有一個特殊的電報聊天,您可以在其中了解最新的工具更新,如果您覺得缺少什麼,也可以發送請求!
為什麼選擇 UR DivergenceSpotter?
如前所述 - 該指標是將體驗整合到一個指標中。 以某種方式對其進行編碼,以便每個人都可
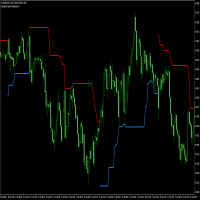
TP Trend Bars Indicator is a trend following technical indicator which is based on price action focusing on the swing highs and lows.
This indicator plots 2 types of lines. The first line is a dotted line, represnting the short-term trend. The second line is a solid line, representing the long term trend
Lines which are below the price action when on a bullish trend and above the price when the trend is bearish The solid line also changes color to indicate trend direction

Professional Support&Resistance Indicator. This indicator is primarily intended for professional use by brokers. There are countless options to choose from and it is one of the best tools in the stock market today. The indicator is optimized for use with EAs.
For programmers to retrieve output index value is for MQL4; (EXAMPLE)
bool buySNR=false,sellSNR=false;
char count=100;
char limit=1;
char dist=3;
for(short cnt=0;cnt<=count;cnt++)
{
double snr_middle=iCustom(NULL,TF_,"::Indicators\\SN

极大的提升了交易感官,一目了然的走势展示,简洁高效。 极大的突出展示了行情的趋势脉络,跟随时间周期适应变化,替用户交易者研判了行情走势,简洁高效 同时我们还提供了主窗口和副窗口的展现,有需要可以联系我作者本人,感谢支持。 像传统的renko,又不是传统的renko,技术在发展,同样的砖图可以有不一样的绘制和计算展现。 希望可以帮到大家的交易,再次感谢。
极大的提升了交易感官,一目了然的走势展示,简洁高效。 极大的突出展示了行情的趋势脉络,跟随时间周期适应变化,替用户交易者研判了行情走势,简洁高效 同时我们还提供了主窗口和副窗口的展现,有需要可以联系我作者本人,感谢支持。 像传统的renko,又不是传统的renko,技术在发展,同样的砖图可以有不一样的绘制和计算展现。 希望可以帮到大家的交易,再次感谢。

Fractal Structures Breakout Trader !!SPECIAL PRICE FOR THE FIRST 10 COPIES!!
A next generation powerfull indicator which brings a new approach to fractal theory Indicator tries to scan and find the fractal breakouts. Momentum, price action and harmonic calculations are also used to complete the algo. Advantages: No Repaint Works on all chart timeframes. Works for every instrument including Currency Pairs, Gold, Oil, Commodities, Indices, Stocks and Cryptocurrencies. Easy to use. User and CPU fr

價格樞軸點 H1 - 顯示 H1 時間框架上的價格樞軸點的指標,準確度高達 95%。來自 100 的 95 個信號將準確指示相反方向的價格反轉位置。指標不會重繪其值。適用於任何貨幣對的交易。它可用於日內剝頭皮和長期交易。價格樞軸點 H1 將信號顯示為箭頭。當價格反轉時,指標將在圖表上繪製一個箭頭。如果價格上漲,指標會畫一個藍色箭頭,當價格下跌時,指標會畫一個紅色箭頭。信號的準確性使您能夠建立有效的交易策略。我們採用 Sonic 標誌來強調信號的速度。在 93% 的情況下,信號是在價格反轉的那一刻準確繪製的。他們沒有遲到。信號非常快。只有在 5% 時,價格不會立即反轉,而是在幾根柱之後反轉。
指標的好處: 未重繪 向交易者顯示價格方向的變化 非常簡單易用 無需其他設置和設置文件 適用於所有貨幣對 可以使用任何時間範圍。但最準確的信號是在 H1、H4 上。 適合二元期權交易!
指標設置: period - 指標週期。該值越高,過濾器的作用越強,指標繪製的信號就越少。 每個購買此指標並留下評論的人都將收到額外的非常有價值的禮物。購買後私信給我們留言,我們將送你一份禮物!

This Indicator is a very Simple Method to make profit from the market! it has two arrow directions up and down. you can easily buy when you see up arrow and close it when you see down arrow. you can use it for Binary Options too! you also can use it with other indicators like Heiken Ashi and Ichimoku to make a complete System of Trading. it has just two Input Options: nBars: The Number of Candles you want to see the Signals for. ShowPanel: to display or not to display the Panel DoAlert: to Send

Indicator Support and Resistence plain in your chart seven lines; Red line=Resistence 3. Red line=Resistence 2. Red line=Resistence 1. Yellow line= Pivot. Green line= Support 1. Green line= Support 2. Green line= Support 3. adattable in all timeframe (minute 1, minute 5, minute 15, minute 30, Hour 1, Hour 4,Day 1,Week 1,Mounth 1); Buy under support and sell over the resistence;


This is another Arrow Indicator to show the instant direction of the Market. it's no repainting and no lagging. you can easily trade by it's direction or use it on your own System. the later is recommended! you can use it on Automatic Experts too. it's input parameters are consists of: nBars: Number of Bars to be checked EnableAlerts: to send Alert messages when get new Signal. EmailAlerts: to send you Email for new Signals you can simply use it on any Symbol or Time Frame after checking for it'

Magic Lines MT4 is an indicator which can be categorized as trend, levels and channels type. It draws a colored line which is colored in green and red depending where last close is. The value at the current open bar should not be taken into account. This part of the indicator can give us a sense whether it is trending up or down or its going sideways. Magic Lines indicator also draws blue top and bottom levels which can be taken into account for breakouts and false breakouts. A sideway zone shou

It could help to calculate Risk-Reward easily before placing a BUY-SELL position. TradeSizeCalculator is a Multi-Tasking Calculator. It will calculate the others when we define the value in one of the columns. Stoploss, risk percentage, risk-money, lot size, take-profit , reward-money, and reward-ratio. Depending on which value is changed. All values in the columns are editable. Also, we can get those calculation results by drag-drop the stop-loss/take-profit line. Parameter: The inputs below ar
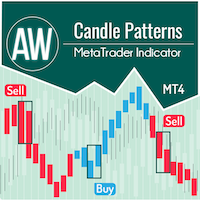
AW 蜡烛形态指标是高级趋势指标与强大的蜡烛形态扫描仪的组合。它是识别和突出显示 30 个最可靠的烛台形态的有用工具。此外,它是一个基于彩色条的电流趋势分析器,带有 可调整大小和定位的插件多时间框架趋势面板。根据趋势过滤调整模式显示的独特能力。 优点: 轻松识别蜡烛形态 不重绘结果 内置多时间趋势面板 禁用模式类型(1、2、3 根蜡烛) 显示形态时趋势过滤的调整 MT5 version - > HERE / Instructions and description -> HERE 显示模式列表: 锤模式 固定/固定 看跌 Harami / 看涨 Harami 看跌 Harami Cross / 看涨 Harami Cross 枢轴点反转向上/枢轴点反转向下 双柱低位收盘价较高/双柱低位收盘价较低 收盘价反转向上 / 收盘价反转向下 中性条 / 两个中性条 双内/内/外 向上推力杆/向下推力杆 晚星/晨星 晚上十字星 / 早上十字星 吞没看跌线/吞没看涨线 镜子酒吧 流星 乌云盖顶 十字星 输入变量: Main settings Trend Filtering Mo

For Nasdaq trading, the most important principle is to know the trend of the fund.
This indicator with 6 green and red lights provides you with the daily path of this important indicator.
This indicator has been tested for 6 months and has a win rate of over 85%.
Be sure to contact me before purchasing to get the necessary instructions on how to use and set up this indicator.
You should use a broker that has dollar index, vix, and commodities. MT5 Version
You can contact us via Instagram, Teleg
AI Signal is an indicator that is a ready to made scalping system that doesn't repaint
Instructions: Load indicator. Use arrows as entries in trends and stay out of sideways markets. Trade with the larger trend and trade only active volatile hours Buy blue arrow above yellow and exit at red arrow or at discretion. Sell red arrow below yellow and exit at blue arrow or at discretion.
Easy to follow and is based on trends. The indicator works on all time frames and assets. Use at your own d

Indicator help you recognize trend quickly ( recommended to use TF M30-Daily ) Parameters: Alert when have signal Push Notification to MT4 mobil2 Benefits Easy to use. input parameters is simple The ability to use as filter for any strategy. It work on stock, index, oil, gold, and on all time frames. It has the function of push-notifications, and sound alerts. Importance : Non Repainting Indicator

Diagnosis of major and minor pivot
Trend detection
with many signals
Can be used in all symbols
Can be used in all time frames
Settings:
Back Show: The number of candles it displays
If you need any adjustments, or have any questions or suggestions, message me
How to trade:
Blue: sell signal
Red: buy signal
Blue and red at the same time: no signal
Exit signal: Opposite signal

Forecasting the future by combining trend and average price
with many signals
Can be used in all symbols
Can be used in all time frames
Settings:
BackShow: The number of candles displayed
Osi: Main setting, the larger the number, the longer the trend
If you need more settings, or have any questions or suggestions, message me
How to trade:
Blue: sell signal
Red: buy signal
Blue and red at the same time: no signal
Binaripex 是二元期權的指標 。該指標在圖表上用箭頭顯示價格在不久的將來會朝哪個方向發展。根據我們的統計,在 95% 的情況下,近期價格(從 1 到 5 分鐘的小時間框架)將高於或低於箭頭指示。這使您可以高效地使用該指標進行二元期權交易。此外,圖表上的指標指示在每筆交易附近價格朝著正確方向發展的距離。您可以直觀地看到,在 95% 的情況下,在 M5 時間範圍內交易時,價格會朝著正確的方向上漲 30 點或更多點。
指標的好處: 未重繪 有幾種操作模式 為二元期權或外匯剝頭皮而創建 顯示所有貨幣對和時間範圍的信號 非常容易使用 向電話和電子郵件發送信號 指標設置: .period - 價格分析的計算週期。 .border - 信號過濾器。 mode_price - 進行計算的價格:開盤,收盤。 arrow_size - 箭頭大小。 .signal - 向電話和電子郵件發送信號。
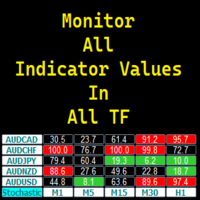
ALL in ONE Indicator Display Indicator values in all Timeframes Display Multiple Symbols/Pairs Fully customizable Click any value/box to open the chart of the corresponding symbol and timeframe Attach multiple instance of the program to display other indicator values Flexible Dashboard Positioning in chart You may request more indicators or additional feature for future updates!
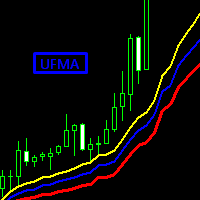
NEW FEATURE ! Now you can select the option of two MA to see the amazing MA cross of Two UFMA.
With the fast reaction of this MA you can avoid most of the false signals of a normal MA Cross.
New formula to calculate moving average, it quickly adapts to the price but maintains the analysis to determine if a change in trend is necessary.
Input Parameters:
Period: used to select the number of bars to use for calculations. Mode: Mode to use for the calculation of the moving average > SMA, EMA, S
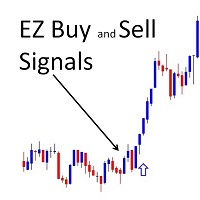
!! FLASH SALE !! Over 80% off !! For ONE week only. Now only $47 - normally $297! >>> Ends on 30 June 2023 - Don't miss it!
Buy and Sell Signals Directly Onto Your Charts. It couldn't be EZ-er! Aslo Gives Alerts – On Your MT4 To Your Phone To Your Email.
Does not repaint! This couldn't be EZ-er to use - just drag it onto your chart (any timeframe, any pair) set the time of day you want signals and where you want alerts, and wait for the signals. Spreads from 0.1pip RAW/ECN Accoun

Reminder: After purchasing the unlimited version of this indicator send me the proof and I will add you to my private group so that you join the community and continue to learn more about this tool and grow together with other traders. You will also learn the strategy that will change your trading story! Dear Traders I am so glad to introduce my forex trading product called "Day Traders Master Board". This tool is designed for serious traders of any trading strategy. My goal is to help trader b

Golden section price action indicator - is a trend-scalping complete system with enter and exit points. Indicator is based on most powerfull price action japan patterns that are filtered by volume, volatility, market phase. Pattern is not a simple combinations of candles. Patterns must have "weight" to move market in right direction. "Weight" - is the summary of pattern's volume, the size of pattern candles according to last average volatility and ofcourse pattern must appear in correct market p

NOTE: NEXT PRICE WILL BE 550$ Dear Trader I hope you have been eagerly waiting and looking for a tool to improve your trading. I am so glad to introduce my other product to you called Trend Shooter Index. The main goal of this tool is to help traders shoot the trend (target the trend) from the bottom or from the top of the trend for maximum profitability. How is the Indicator designed
This tool is designed to show the following Red arrows pointing down for sell signals. Blue arrows pointing up f
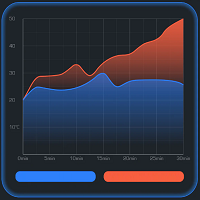
Fixation Trend indicator showing buy and sell areas. The indicator follows the price movement, works at the opening price. It also displays information about the trend following the breakout of the minimum and maximum. The indicator has very simple but effective graphics: above the opening price, an orange dot is displayed - a sell signal, below the opening price - blue, a buy signal. The indicator also accompanies the signals with a sound alert and a pop-up window notifying the signal on the op

The Mechanism Trend indicator is a hybrid indicator that shows the moments for entering the market with arrows. This indicator was created on the basis of the original indicators for searching for extreme points, the indicator is well suited for determining a reversal or a large sharp jerk to one side.
When the trend changes, the Mechanism Trend indicator uses color signaling: green - when changing from a downtrend to an uptrend, and red - vice versa, to a downtrend. You can use the indicator
Are you tired of the constant ups and downs? Do not become a victim of unstable market movements, it's time to get rid of it somehow! Already now you can use The Trend Setter solutions to balance the price movement analysis and get a clearer picture of the price action.
The Trend Setter is a trend indicator for the MetaTrader 4 trading platform. If you don't have your own trading strategy yet, you can use our ready-made trading strategy. The indicator will help in finding entry points when ana

Shift Trend is a forex trend arrow indicator for identifying potential entry points. Determining the market trend is an important task for traders. The Shift Trend indicator implements an advanced algorithm for visualizing the market trend. Shows the opening points of transactions for sale or purchase, and also indicates the direction of the trend on: short-term and long-term periods. Suitable for trading on low timeframes because it ignores sudden price spikes or corrections in price action by

What are "pivot points"? Pivot point analysis is often used in conjunction with the calculation of support and resistance levels, as is the case with trend line analysis. Pivot point analysis calculates the first support and resistance levels using the trading range width between the pivot point and the previous day's high or low price. The second support and resistance levels are calculated using the entire width between the previous day's high and low prices.
Looking for a quality pivot poin

A useful dashboard that shows the CCI values for multiple symbols and Time-frames.
It can be easily hidden/displayed with a simple click on the X top left of the dashboard.
You can input upper and lower CCI values and the colours can be set to show when above/below these values. The default values are 100 and 30-100 There are also input colours for when the CCI is positive or negative (but not exceeding the upper/lower levels
Symbols and time-frames are input separated by commas.
Symbols
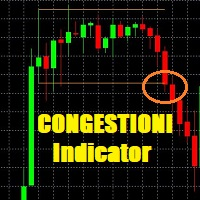
This indicator is very usefull to TRADE Trading Ranges and helps identify the following TREND. Every Trader knows that any market stay 80% of the time in trading ranges and only 20% of the time in TREND; this indicator has been built to help traders trade trading ranges. Now instead of waiting for the next TREND, You can SWING TRADE on trading ranges with this simple yet very effective indicator.
TRADING with CONGESTIONI INDICATOR:
The CONGESTIONI Indicator identify a new trading range and ale

- 50% OFF -
Telegram group : https://t.me/+5RIceImV_OJmNDA0 MT5 version : https://www.mql5.com/en/market/product/85917?source=Site+Market+Product+Page
Master Pullback is a complete system that gives unique trading opportunities and a clear indication of the market: trend, signals as well as stop loss and take profit levels. This system has been designed to be as simple as possible and detects extreme overbought and oversold zones, support and resistance levels, as well as the major trend. You p
AverageDirectionalIndex - 改進的指標公式。這個版本的 ADX 更準確地確定了價格反轉點和當前趨勢的方向。此外,使用此指標,您可以確定趨勢的強度。當綠線自下而上穿過紅線時,這意味著趨勢正在向上或正在形成暫時的回調。當紅線自上而下與綠線交叉時,表示趨勢正在轉向向下或正在形成暫時的回調。
如何使用 AverageDirectionalIndex 指標進行交易: 購買交易。將 AverageDirectionalIndex 指標添加到圖表中 + 添加標準移動指標。當價格高於移動平均線時,我們等待綠線自下而上穿過紅線的那一刻,並建立買入交易。 交易出售。將 AverageDirectionalIndex 指標添加到圖表中 + 添加標準移動指標。當價格低於移動平均線時,我們等待紅線從上到下穿過綠線的那一刻,並建立賣出交易。
AverageDirectionalIndex 指標的優點: 改進的 ADX 公式 超過標準版 很好地顯示了價格反轉點 您可以在所有貨幣對和時間範圍內進行交易 適合使用剝頭皮策略進行交易
AverageDirectionalIndex 指標的設
Divergence is one best ways to trade the financial market as it is a leading indicator of price action that detect high probability reversal and continuation setups. The AlgoKing Divergence Detector is an RSI and Stochastics Indicator with Divergence Detection. Features Hidden Divergence for trend continuation. Standard or Normal Divergence for trend reversal. Screen Alerts. MetaQuotes Notifications. Email Notifications. RSI Indicator built in. Stochastics Indicator built in. Types of Divergen

Introduction to Chart Pattern MT Chart Pattern MT is a chart pattern scanner to detect the triangle pattern, falling wedge pattern, rising wedge pattern, channel pattern and so on. Chart Pattern MT uses highly sophisticated chart pattern detection algorithm. However, we have designed it in the easy to use with intuitive user interface. Chart Pattern MT will show all the patterns in your chart in the most efficient format for your trading. You do not have to do tedious manual pattern detection an

This indicator provides several drawing tools to assist in various methods of chart analysis.
The drawings will keep their proportions (according to their handle trendline) across different chart scales, update in real time, and multiple drawings are supported.
#
Drawing Option
Description
1 Grid box draggable boxed grid, user defines rows x colums, diagonal ray option 2 Grid partial or fullscreen grid, sized by handle line 3 Grid flex a diagonal grid, sized and sloped by handle line
4 Cyc
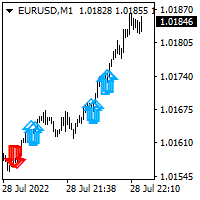
This indicator helps you to build position and profit when market turns in your favor. You will build your full position by trading many small position. Once blue arrow appear on the chart, you could add long position. Once red arrow appear on the chart, you could add short position. I personally spread my full size position in to 5-10 small position. I use small target of 2-5 pips on eurusd pair.

DESCRIPTION
The CHAOS INDICATOR has been developed to be used for the TRADING STRATEGY OF CHAOS, as described in the book. The book is in italian language only and can be obtained only on my website indicated below.
DATAS COLLECTED AND SHOWN ON GRAPHS
The CHAOS INDICATOR apply easily to any graph and any asset, and it is a TRADING FACILITATOR, as it identify immediately the following items on any graph: - The GP (= RIGHT PRICE) i.e. the price to which the asset should be attracted within 24 ho

This indicator is designed for those people, who want to trade and earn on any instruments and timeframes .The indicator gives out very good points to enter the market,it's very easy to trade,the arrows will show when to open trades,set and trade without thinking about anything,stop loss and take profit,set each one yourself,it all depends on your trading style,someone scalps and someone holds trades on a few days..In the strategy tester, the indicator simply cannot physically show accurate res

https://c.mql5.com/31/761/best-trend-indicator-logo-200x200-8493.png 该指标用一条红绿相见的实线来反映市场价格的万千变化。 绿线表明市场价格处于上 升期间 , 红线表明市场价格处于下跌期间。
实线颜色 的改变预示着市场已经发生变化行情极有可能会出现逆转! 建议您在日K线图上使用该指标。该指标不适合您做超短线交易! 众所周知,趋势线是技术分析家们用来绘制的某一证券 (股票) 或商品期货过去价格走势的线。目的是用来预测未来的价格变化。这条 趋势 线是通过联结某一特定时期内证券或商品期货上升或 下跌 的最高或最低价格点而形成的。它可以预测该证券或商品期货是处于上升的趋势还是处于下跌的趋势。但是,您一定要认识到每一个指标都有是有缺陷的,这个世界上没有任何一个指标可 以精准的预测到市场未来的发展方向。因此,我建议您在使用这个指标的时候能够结合其他的技术分指标,以此获得更好 的 效果 。
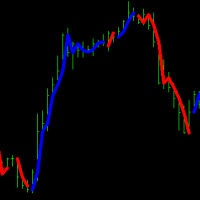
趨勢指標確定趨勢的方向。該指標掃描市場尋找急劇的價格反轉並向交易者顯示看跌或看漲趨勢開始的位置。當市場橫盤整理時,指標停止繪製信號線。由於該指標,每個交易者都能夠快速確定市場方向並在價格變動方向上開出正確的訂單。您還可以分析不同時間幀的市場,使用較大時間幀的信號確認較小時間幀的信號。這種策略可以高精度地確定趨勢的方向. 該指標準確地確定了中高時間範圍內的價格反轉點。 使用該指標進行交易時,最好將其與任何振盪器結合以確定精確的樞軸點。
指標的好處 : 不重繪信號 顯示趨勢的方向 提供有關當前市場趨勢及其發展方向的信息 易於設置的指標 適用於所有貨幣對和時間範圍 指標設置: period - 計算週期。 filter——信號濾波器。

Night Ghost - Arrow indicator for binary options.
This is a reliable assistant to you in the future!
- No redrawing on the chart -Works great on EUR/USD currency pairs! -Indicator accuracy up to 90% (Especially at night)
-No long setup required (Perfectly set up for Binary Options)
- Not late signals
- The appearance of a signal on the current candle
-Perfect for M1 period (No More!)
- Eye-friendly candle color (Red and Blue)
-Installed Alert
Working with it:
- Blue arrow shows signa

Forex Gump Trend 是一種通用指標,用於高效確定趨勢方向。如果您正確識別趨勢,這就是 95% 的交易成功,因為您將能夠在價格變動的方向上開倉並從中受益。 Forex Gump Trend 指標幫助交易者以高度的效率確定當前趨勢方向,以及趨勢反轉點。趨勢的方向在圖表上用彩色線表示,趨勢反轉點用箭頭表示。該指標有許多設置,允許您在幾乎所有時間框架和所有貨幣對上使用它。
如何與外匯阿甘趨勢交易? 交易策略取決於交易者的交易風格和他所使用的貨幣對。但在全球範圍內,使用該指標的交易策略始終基於趨勢方向的開單。該指標用彩色線條顯示趨勢。因此,當指標畫出藍線時,我們建立買入交易,當指標畫出紅線時,我們建立賣出交易。考慮到大多數交易者使用剝頭皮策略進行交易的事實,我們建議將 TakeProfit 放置在最小距離。大約15-25分。這是由於剝頭皮。在剝頭皮交易中,我們的目標是在短距離內打開許多訂單。止損設置在指標信號線的上方或下方或趨勢發生變化時。我們總是以小批量交易,這使我們能夠減少交易餘額的負擔。我們嘗試每天進行大量交易以平均結果。因此,如果我們開立大量短距離交易,我們會增加盈
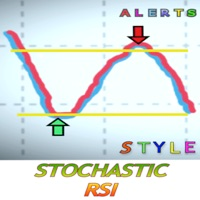
什么是随机RSI?
随机RSI(StochRSI)是技术分析中使用的一个指标,其范围在0和1之间(或在某些图表平台上为0和100),是通过将随机振荡器公式应用于一组相对强度指数(RSI)值而不是标准价格数据来创建的。这个版本包括提醒,不要错过真正的好机会。当你想接收买入信号或卖出信号时,你可以设置参数。为了接收任何信号,你必须通过MetaQuotes ID连接你的桌面版和Metatrader应用程序。MetaQuotes ID在你的MT4/5应用程序的设置>>聊天和信息中找到。在桌面上是在工具>>选项>>通知。你把ID放在桌面版上,激活通知,就可以开始了。
试试MT5版本, 这里
因为风格很重要
我知道每次都要点击属性来改变蜡烛的颜色、背景是浅色还是深色,以及放置或删除网格是多么令人厌烦。这里有一个一键式的解决方案。 三个可定制的按钮可以选择交易者想要的蜡烛样式。 一个按钮可以在白天和夜晚模式之间切换。 一个按钮可以在图表上显示或隐藏网格。 ***** 在设置中,你可以选择按钮在屏幕上的显示位置*****。
另外,请考虑查看我的其他产品 https://www.mql5
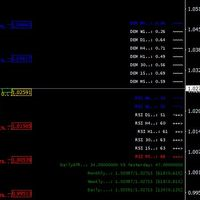
I decided to add parallel function with DeMarker to free version of my indicator with RSI MTF. it is good for scalping or for weekly trading and looks as universal fx-toy. In menu you can turn on daily percentage gain info, it is good for crypto as for me, weekly and monthly gains also included as informers. Short ATR helps to determine when price was stopped and entry for pulse pump/dump. The filter of numbers of RSI can be tuned for overbought/oversold values with colors you needed. Examp

Currently switched to the 4 hour chart - but use other time frames for confirmation. :-) I change my main time frame based on the market movement at the time. The Hurricane Forex Indicator is a multi time frame indicator that includes such things as Trade Notifications, Trade Calculator, Momentum Indicator, risk reward and much more. We have a free Trade room for our users as well. Please check out the video for full details of how this indicator works as it has over 15 years worth of developme
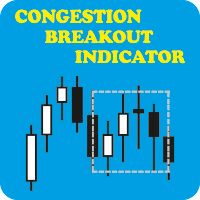
CONGESTION BREAKOUT INDICATOR: When you see a sideways price movement in a meaningless market, what goes through your mind? Is it a danger, an opportunity or completely a vacuum? Let's see if we can avoid the latter and focus on using it to our advantage. The ability to read price action through the display of rectangles on the chart could be the boost you need to achieve your trading goals. What is congestion? Congestion is a market situation where the price is trading around a particular leve

BSA indicator is a ZigZag based indicator. This indicator is used to find the reversal level of the price. You can use the existing risk ratio and calculation timeframe in the entries by optimizing them according to your usage preference. In lower time frames, the indicator can repaint. For healthier results, you can detect the least repainting by observing for a while according to the graphic you will apply.

Simple Dark Holder Tool
Arrow indicator for Forex and binary options
Already tuned for the best signals
Multicurrency and multitimeframe
Works on all currency pairs as well as raw materials, etc.
Works on the author's strategy and combines 3 indicators that show good results
Does not draw or redraw
The signal appears clearly at the opening of the candle
blue up
Red down
Alert is also built into it for your convenience.
Test and watch a video on how it works

Weddell Pro is a good trading tool that is suitable for both a beginner and an experienced trader.
It can be used both separately and combined with other strategies and indicators
Configured for currency pairs was tested several times on cryptocurrency but did not show a high result
Currency pairs USD/EUR AUD/CAD GBP/USD Showed itself very well here
The percentage of correct transactions is above 68%, which does not make it perfect and bad
Doesn't draw or disappear
The red arrow shows a t

Welcome to Upside Down !
Upside Down is a powerful indicator that gives the perfect trading opportunities and a clear indication of the market. Upside Down has been created to be as simple as possible. Arrows are calculated based on ASC Trend and customs indicators . Signals appear without delay at the end of a candle, if it has tested the level. The signals do not overdraw.
THE BENEFIT:
Easily to enter in buy position/sell position Intuitive directional arrows by colors
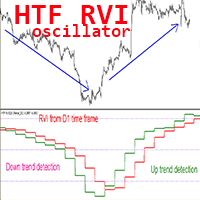
Crypto_Forex 指标 HTF RVI 振荡器适用于 MT4,无需重绘。
- 使用专业的 HTF RVI 振荡器升级您的交易方法,适用于 MT4。HTF 表示 - 更高的时间框架。 - RVI 是用于趋势变化检测和从超卖/超买区域进入的最佳振荡器之一。 - 该指标非常适合多时间框架交易系统,价格行动从超卖/买入区域进入。 - HTF RVI 指标允许您将更高时间框架的 RVI 附加到当前图表 --> 这是专业的交易方法。 - 超买区域高于 0.23;超卖区域低于 -0.23; - 指标具有内置的移动和 PC 警报。 ................................................... 点击这里查看高质量的交易机器人和指标! 它是仅在此 MQL5 网站上提供的原创产品。

Support And Resistance Screener is in one level indicator for MetaTrader that provide multiple tools inside one indicator. The available tools are : 1. Market Structure Screener. 2. Bullish Pullback Zone. 3. Bearish Pullback Zone. 4. Daily Pivots Points 5. weekly Pivots Points 6. monthly Pivots Points 7. Strong Support and Resistance based on Harmonic Pattern and volume. 8. Bank Level Zones.
Key Features All in one level indicator.
All types of alerts ( Pop-up alert, puss notification alerts.

This tool provides a freehand drawing method, to treat the chart space as a blackboard and draw by-hand. Drawings can be made to stick to the CHART (moves with chart scroll), or to stick to the WINDOW (does not move with chart scroll).
Features: all drawings are individually styled, color, width
show/hide each drawing type
delete last drawing drawings, on chart and on window, remain through TF changes and terminal re-starts, until the indicator is removed
Panel: stylable colors scalable in size
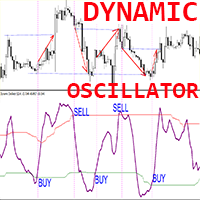
动态振荡器 - 是一种高级自定义 Crypto_Forex 指标 - 适用于 MT4 的高效交易工具! .................................................................................................... - 新一代振荡器 - 查看图片以了解如何使用它。 - 动态振荡器具有自适应超卖/超买区域。 - 振荡器是一种辅助工具,用于从超卖/超买区域找到准确的切入点。 - 超卖值:低于绿线;超买值:高于红线。 - 它比标准振荡器准确得多。合适的时间范围:M30、H1、H4、D1、W1。 - 具有 PC 和移动警报。 点击这里查看高质量的交易机器人和指标! 它是仅在此 MQL5 网站上提供的原创产品。

My indicator is a great helper in the forex market. It shows possible market reversals with absolute accuracy. My indicator does not redraw and does not change values when switching timeframes. It works perfectly on all timeframes and can become a key indicator in your strategy. I would like to note that flexible indicator settings allow you to adapt the indicator to your strategy and can make a big contribution to your profitable strategy, although everything is already laid down in this indica
ADX Pro Indicator This Indicator Are Advanced Pro ADX Indicator Multi Time Frame Are Same Window Multi Currency Are Same Windows All Time Frame And All Currency ADX Strenght Are Same Window Monitring You Will Add Manully All Currency Pairs , And Metel , And Also Crypto Currency Pairs : EURUSD , GBPUSD, USDJPY .... Etc , Metel : XAUUSD , XAGUSD ... Etc , Crypto : BTCUSD, ETHUSD... Etc
Hello; The product offers high quality trend tracking. Thanks to the arrows on the graph, you can easily follow the entry and exit signals. It provides ease of use thanks to a single input parameter. You can easily follow the signals thanks to the alarm options. Moreover, trend color lines provide convenience in determining the trend direction. Input parameter setting: Periodic: Indicates the number of bars that need to be calculated.
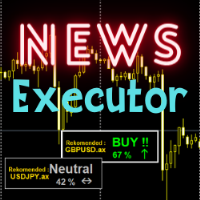
Several indicators are summarized in one display conclusion. Highly recommended indicator for all traders even beginners. You only need to make transactions according to the recommendations displayed by the indicator. It's obvious for trading news with big effects though. Trading is all about money, so love your money and make a profit with our tools. Trading recommendations on news on major currencies

Master Trend Signal Indicator
TimeFrame - 15 Mins & More
Pairs - All Forex Currency Pairs , Gold , Silver , Crypto, Stock
Once Trend Is UP Cross The Yellow Line, It's Show Colour For Green
Once Trend Is Down Cross The Yellow Line, It's Show Colour For Red Easy TO Identify Trend Strength ON Trading For Scalping, Intraday Trading 5 Purchases left & The Price Increases

В основе индикатора EasyBands лежит тот же принцип, что и при построении Bollinger Band. Однако, данная модификация индикатора использует вместо стандартного отклонения средний торговый диапазон (Average True Range). Соответственно, с данным индикатором абсолютно аналогично можно использовать все стратегии, которые применяются с Bollinger Band. В данной версии индикатора используется двенадцать уровней и средняя линия (белый цвет). Индикация тренда выполнена в виде окраски свечей в зависимости
Golden Scalping & Day Trading Signal Indicator You Can Enable Or Disable Scalping Signal Option Once Enable For Scalping More Order Signals Option Or Disable For Scalping Option Intraday Signal Option Pairs : XAUUSD, XAGUSD - EURUSD, GBPUSD,USDJPY, AUDUSD, USDCAD, BTCUSD , USDCHF, GBPJPY Time Frame : 15 Mins, 30 Mins , 1 Hour 5 Purchases left & The Price Increases
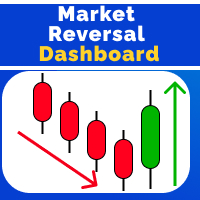
Market Reversal Catcher Dashboard indicator looks for market reversal points or major pullback. To do this, it analyzes previous price movements and using a flexible algorithm for estimating the probability of a reversal, also gives recommendations on entry points and sets recommended profit targets for positions opened on a signal. The dashboard is designed to sit on a chart on it's own and work in the background to send you alerts on your chosen pairs and timeframes. Dashboard does not requi
您知道为什么MetaTrader市场是出售交易策略和技术指标的最佳场所吗?不需要广告或软件保护,没有支付的麻烦。一切都在MetaTrader市场提供。
您错过了交易机会:
- 免费交易应用程序
- 8,000+信号可供复制
- 探索金融市场的经济新闻
注册
登录