适用于MetaTrader 4的技术指标 - 112
"Four eyed turkey" это индикатор на основе RSI,Stochastic,MACD и Envelopes определяющий точки входа на таймфреймах М5, М15, М30, Н1. В отдельном окне индикаторы указывают возможные точки входа, параметры можете определить самостоятельно в настройках. Для RSI и Stochastic - зоны перекупленности и зона перепроданности. Для MACD - сигнальная линия и гистограмма выше 0 это BUY, для SELL противоположно . Для Envelopes - открытие свечи выше верхней линии это BUY, открытие свечи ниже нижней линии это

KT Forex Session shows the different Forex market sessions using meaningful illustration and real-time alerts. Forex is one of the world's largest financial market, which is open 24 hours a day, 5 days a week. However, that doesn't mean it operates uniformly throughout the day.
Features
Lightly coded indicator to show the forex market sessions without using massive resources. It provides all kinds of Metatrader alerts when a new session starts. Fully customizable.
Forex Session Timings I

KT Volume Profile shows the volume accumulation data as a histogram on the y-axis providing an ability to find out the trading activity over specified time periods and price levels.
Point of Control (POC) in a Volume Profile
POC represents a price level that coincides with the highest traded volume within the whole volume profile histogram. POC is mostly used as a support/resistance or as an essential price level where market retest before going in a specific direction.
Features Very easy
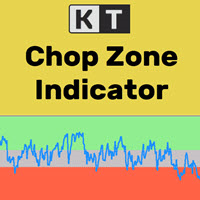
It's a well-known fact that most of the financial markets trend only 30% of the time while moving in a closed range rest 70% of the time. However, most beginner traders find it difficult to see whether the markets are trending or stuck in a range. KT Chop Zone solves this problem by explicitly highlighting the market phase into three zones as Bearish Zone, Bullish Zone, and Chop Zone.
Features
Instantly improve your trading by avoiding trade during the sideways market (Chop Zone). You can al
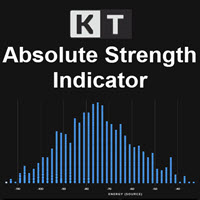
KT Absolute Strength measures and plots the absolute strength of the instrument's price action in a histogram form. It combines the moving average and histogram for a meaningful illustration. It supports two modes for the histogram calculation, i.e., it can be calculated using RSI and Stochastic both. However, for more dynamic analysis, RSI mode is always preferred.
Buy Entry
When the Absolute Strength histogram turns green and also it's higher than the previous red column.
Sell Entry
W
KT Coppock Curve is a modified version of the original Coppock curve published in Barron's Magazine by Edwin Coppock in 1962. The Coppock curve is a price momentum indicator used to identify the market's more prominent up and down movements.
Features
It comes with up & down arrows signifying the zero line crossovers in both directions. It uses a simplified color scheme to represent the Coppock curve in a better way. It comes with all kinds of Metatrader alerts.
Applications It can provide
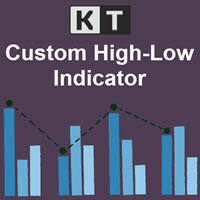
KT Custom High Low shows the most recent highs/lows by fetching the data points from multi-timeframes and then projecting them on a single chart. If two or more highs/lows are found at the same price, they are merged into a single level to declutter the charts.
Features
It is built with a sorting algorithm that declutters the charts by merging the duplicate values into a single value. Get Highs/Lows from multiple timeframes on a single chart without any fuss. Provide alerts when the current

KT Auto Trendline draws the upper and lower trendlines automatically using the last two significant swing highs/lows. Trendline anchor points are found by plotting the ZigZag over X number of bars.
Features
No guesswork requires. It instantly draws the notable trendlines without any uncertainty. Each trendline is extended with its corresponding rays, which helps determine the area of breakout/reversal. It can draw two separate upper and lower trendlines simultaneously. It works on all timefr
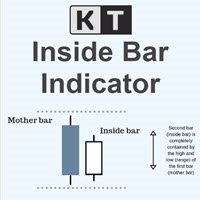
KT Inside Bar plots the famous inside bar pattern in which the bar carries a lower high and higher low compared to the previous bar. The last bar is also known as the mother bar. On smaller time-frames, the inside bar sometimes appears similar to a triangle pattern.
Features
Also plots entry, stop-loss, and take-profit levels with the inside bar pattern. No complex inputs and settings. Erase unwanted levels when the price reaches the entry line in either direction. All Metatrader alerts incl
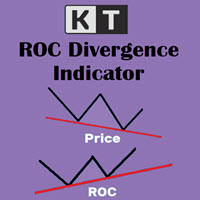
KT ROC divergence shows the regular and hidden divergences build between the price and Rate of change oscillator. Rate of change (ROC) is a pure momentum oscillator that calculates the change of percentage in price from one period to another. It compares the current price with the price "n" periods ago. ROC = [(Close - Close n periods ago) / (Close n periods ago)] * 100 There is an interesting phenomenon associated with ROC oscillator. In ROC territory there is no upward limit, but there is a do
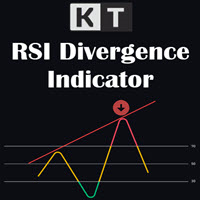
KT RSI Divergence shows the regular and hidden divergences built between the price and Relative Strength Index (RSI) oscillator. Divergence can depict the upcoming price reversal, but manually spotting the divergence between price and oscillator is not an easy task.
Features
Ability to choose the alerts only for the divergences that occur within an overbought/oversold level. Unsymmetrical divergences are discarded for better accuracy and lesser clutter. Support trading strategies for trend r
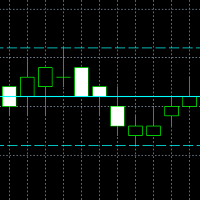
It is a new indicator that frames the price movement and tracks it. It consists of oscillation channel and its center line CL . For its calculation it is only necessary to introduce the amplitude of the channel. Because of this, it is a non-lagging indicator as it is not calculated based on a number of previous candlesticks. It removes any level of noise , showing the underlying price movement cleanly via the center line . It allows you to easily identify the beginnings and ends of the trend ,

1. Стрелочный индикатор. 2. Для анализа использует несколько скользящих средних на разных таймфреймах и соотносит их с важными уровнями цены. 3. Не перерисовывает стрелку, т.к. использует для расчета фиксированное количество исторических данных. 4. Пример работы индикатора приведен на скриншотах. 5. Показывает отличные результаты на всех валютных парах на таймфрейме от H 1 и выше. 6. Не требует оптимизации.

ATR Scanner Pro is a multi symbol multi timeframe volatility scanner that monitors and analyzes Average True Range indicator value in up to 28 symbols and 9 timeframes in 3 modes : ATR value: As a volatility dashboard it shows the ATR indicator value in all pairs and timeframes and signals when the ATR value reaches a maximum or minimum in a given duration. Short term ATR/Long term ATR ratio: It shows ratio of 2 ATRs with different periods. It's useful in detecting short term volatility and e

This indicator detects trade direction and sends notification to your mobile phone so that you can enter/exit a trade without having to be seated in front of desktop computer all day and night. Although you have to execute/send an order yourself, you can setup rules through the setting made available for proper lots size base on the available balance/fund you are trading with. The opportunity to take a profit at the right time and set reasonable stop loss that will not be overwhelming and gett

DayNight HighLow is base on support and resistance levels, as well as averages of highs and lows. It detects trade direction and sends notification to your mobile phone so that you can enter/exit a trade without having to be seated in front of desktop computer all day and night. Although you have to execute/send an order yourself, you can setup rules through the setting made available for proper lots size base on the available balance/fund you are trading with. The opportunity to take a profit

DayNight moving averages along with support and resistance make a remarkable difference if properly utilized This indicator detects trade direction and sends notification to your mobile phone so that you can enter/exit a trade without having to be seated in front of desktop computer all day and night. Although you have to execute/send an order yourself, you can setup rules through the setting made available for proper lots size base on the available balance/fund you are trading with. The opport
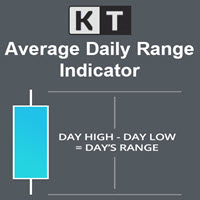
KT Average Daily Range(ADR) shows the upper and lower levels using the average daily range covered by the currency pair or the instrument. The average daily range is calculated using the chosen period in the input settings. ADR High: ADR upper level is found by adding the average daily range value to the current day's low.
ADR Low: ADR lower level is found by subtracting the ADR value from the current day's high.
Features
It shows the ADR levels with several other helpful information bene
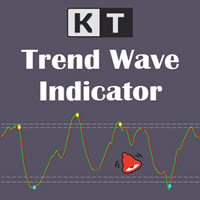
KT Trend Wave is an oscillator based on the combination of Price, Exponential, and Simple moving averages. It usually works great to catch the short term price reversals during the ongoing trending market. The bullish and bearish crossovers of the main and signal lines can be used as buy/sell signals (blue and yellow dot). It can also be used to find the overbought and oversold market. The buy and sell signals that appear within the overbought and oversold region are usually stronger.
Feature
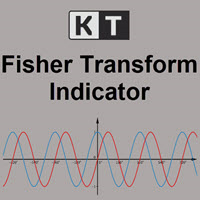
KT Fisher Transform is an advanced version of the original Fisher Transform oscillator equipped with divergence detection, crossover alerts, and many more features. Originally it was developed by John F. Ehlers. It converts the asset's price into a Gaussian normal distribution to find the local extremes in a price wave.
Features
A light-weighted oscillator that efficiently identifies the upward and downward crossovers and marks them using vertical lines. It also finds regular and hidden div
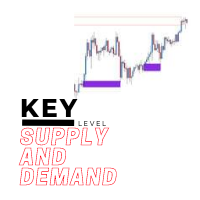
The key level supply and demand indicator is the first supply and demand indicator with options to change settings to show different zones, giving you the choice to pick the zones you see are being respected the most and saving the settings.
Advantages
The key level supply and demand DOES NOT REPAINT unlike other supply and demand currently in the market. This gives you a massive advantage to scroll back and see how price reacted on previous levels. The key level supply and demand has the o
KT Pip Counter is a simple and informative indicator that shows some essential data and numbers on a real-time basis. Such critical information and data can benefit a trader during an intense trading session.
Features
Shows the current profit/loss in currency, pips, and percentage. Shows the current spreads. Shows the remaining time in the closing of the current bar. The different color schemes for profit/loss scenario. The text position and layout can be fully customized. It uses minimum

KT Pivot Points automatically plots the daily, weekly, and monthly pivot levels on a chart with the precise calculation based on the latest data. Pivot points is a widely used indicator in technical analysis, particularly in the Forex market.
Features
Send alerts when the price touches the pivot level. It offers complete customization for each kind of pivot level. Shows daily, weekly, and monthly pivot levels without any fuss. It uses minimum CPU resources for faster calculation. Compati
KT Candle Timer shows the remaining time in the closing of the current bar. You can use the bar closing time for multiple purposes, including time and trade management during the trading hours.
Features
It also shows the Symbol spreads along with the remaining time. It offers two convenient timer display positions, i.e., chart corner or next to the current bar. From colors to text size, it offers full customization according to user preferences. It is optimized to work without using extensiv

About the Lyne indicator
Lyne is a Metatrader 4 (MT4) indicator, the essence of which is to transform the accumulated historical data.
The Lyne indicator makes it possible to detect various features and patterns in price dynamics that are invisible to the naked eye.
Based on this information, traders can anticipate further price movement and adjust their strategy accordingly.
This indicator has proven itself in the scalping strategy. The indicator works without repainting.
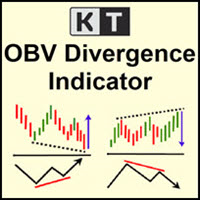
KT OBV Divergence shows the regular and hidden divergences build between the price and OBV - On Balance Volume oscillator.
Features
Unsymmetrical divergences are discarded for better accuracy and lesser clutter. Support trading strategies for trend reversal and trend continuation. Fully compatible and ready to embed in an Expert Advisor. Can be used for entries as well as for exits. All Metatrader alerts are available.
What is a Divergence exactly?
In the context of technical analysis, i

KT Bullish Bearish shows the bullish/bearish regime of the market in the form of a colored histogram representing both of the market states alternately. Bull Market (Blue Histogram): A bull market indicates an uptrend when an instrument price rises over a continued period like days, months, or years. Bear Market (Red Histogram): A bear market indicates a downtrend when an instrument price rises over a continued period like days, months, or years.
Applications
It prevents trading against the
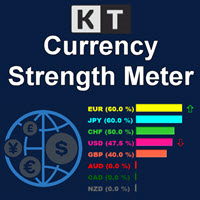
The KT Currency Strength Meter measures the individual currencies' strength and weakness by applying an aggregated mathematical formula over the major FX pairs. The strength is calculated using the bullish and bearish candles over a fixed period. After filling up the strength data, an algorithm sorts out the strongest and weakest currencies in a stack and updates their orders using the real-time incoming data.
Advantages
Improve your trading strategy instantly by filtering out the signals th
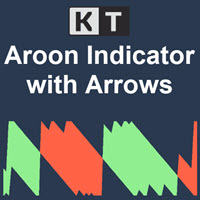
KT Aroon oscillator is the modified version of the original Aroon oscillator initially developed by Tushar Chande in 1995. It measures the time interval between the ongoing highs and lows and uses this deduction to calculate the market trend's direction and strength. It works on the notion that the price will form new highs consecutively during an uptrend, and during a downtrend, new lows will be formed. Buy Signal: When Aroon Up line cross above the Aroon Down line.
Sell Signal: When Aroon Do
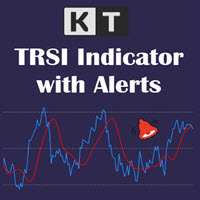
KT TRSI is an oscillator built using a combination of RSI (Relative Strength Index), EMA (Exponential Moving Average), and SMA (Simple Moving Average). Compared to the classic RSI, a TRSI is less susceptible to false signals due to the SMA's smoothing factor. Moreover, it is also equipped with all kinds of Metatrader alerts.
Simple Entry Rules
Buy: When the Blue line(RSI) crosses above the Red line(TRSI). Sell: When the Blue line(RSI) crosses below the Red line(TRSI).
Advance Entry Rules
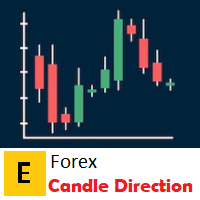
Simple indicator that supports decision makers. You will have the candles directions for different timeframes on your screen. That will allowed you to be one more scenario to analyze before you open your orders. In case you would like to have more details, just let me know.. so we can add it to the chart. Multicurrency that in inform you the directions for multi-timeframes!

KT Bollinger Bands Alert is a modified version of the classic Bollinger Bands added with price touch alerts and visible price tags for each band separately.
Alert Events
When the current price touches the upper Bollinger band. When the current price touches the middle Bollinger band. When the current price touches the lower Bollinger band.
Features Separate alert events for each band. Ability to specify a custom interval between each alert to prevent repetitive and annoying alerts. Added

KT SuperTrend is a modified version of the classic SuperTrend indicator with new useful features. Whether its Equities, Futures, and Forex, the beginners' traders widely use the Supertrend indicator. Buy Signal: When price close above the supertrend line.
Sell Signal: When price close below the supertrend line.
Features
A multi-featured SuperTrend coded from scratch. Equipped with a multi-timeframe scanner. The last signal direction and entry price showed on the chart. All kinds of MetaTra
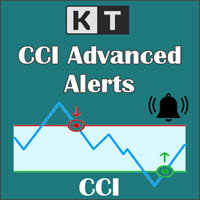
KT CCI Alerts is a personal implementation of the Commodity Channel Index (CCI) oscillator that provide signals and alerts on four custom events: When CCI enter in an overbought zone. When CCI exit from an overbought zone. When CCI enter in an oversold zone. When CCI exit from an oversold zone.
Features A perfect choice for traders who speculate the CCI movements within an overbought/oversold zone. Lightly coded without using extensive memory and resources. It implements all Metatrader alerts
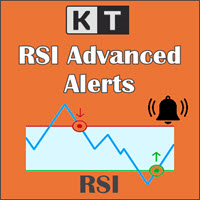
KT RSI Alerts is a personal implementation of the Relative Strength Index (RSI) oscillator that provide signals and alerts on four custom events: When RSI enter in an overbought zone. When RSI exit from an overbought zone. When RSI enter in an oversold zone. When RSI exit from an oversold zone.
Features A perfect choice for traders who speculate the RSI movements within an overbought/oversold zone. It's a lightly coded indicator without using extensive memory and resources. It implements all

"The trend is your friend" is one of the oldest and best-known sayings in financial markets. However, this message only represents half of the picture. The correct saying should be, "The trend is your friend only until it ends." KT Trend Filter solves this problem by clearly indicating the start of an Uptrend and Downtrend using an averaging equation on the price series. If the trend direction is not clear, it shows the trend as sideways showing the uncertainty in the market.
Features
Get a

The Vortex Indicator was first presented by Douglas Siepman and Etienne Botes in January 2010 edition of Technical Analysis of Stocks & Commodities. Despite its based on a complex implosion phenomenon, the vortex is quite simple to interpret. A bullish signal is generated when +VI line cross above the -VI line and vice versa. The indicator is mostly used as a confirmation for trend trading strategies. The Vortex was inspired by the work of Viktor Schauberger, who studied the flow of water in tur
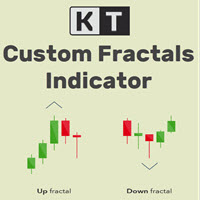
KT Custom Fractals is a personal implementation of the Fractal indicator first introduced by Bill Williams. With KT Custom Fractals you can choose a custom number of bars to allow to the left and right side of the fractal. For example, you can display the fractals that have "three" successive bars with the highest high in the middle and one lower high on both sides , or you can display the fractals that have "Eleven" consecutive bars with the lowest low in the middle and five higher lows on bot
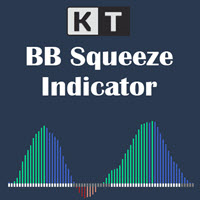
KT BB Squeeze measures the contraction and expansion of market volatility with a momentum oscillator, which can be used to decide a trading direction. It measures the squeeze in volatility by deducing the relationship between the Bollinger Bands and Keltner channels. Buy Trade: A white dot after the series of gray dots + Rising momentum above the zero line.
Sell Trade: A white dot after the series of gray dots + Rising momentum below the zero line. Markets tend to move from a period of low vol
The KT QQE Advanced is a modified version of the classic QQE oscillator to depict it more accurately using the colored histogram with fast and slow Trailing Line(TL).
Unlike the classic QQE, the KT QQE Advanced consists of a histogram with overbought/oversold levels.
Applications
Find quick buy/sell signals across all the timeframes using the MTF scanner. Find the trend direction more accurately. Detects overbought/oversold market. Shows the price momentum.
Inputs RSI Period Smooth Per
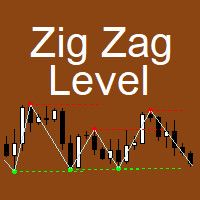
The indicator implements the author's approach to the construction of the popular "Zig-Zag" indicator.
The advantages of the "ZIgZag Level" indicator is that it filters out market noise and shows levels.
"ZIg Zag Level" is based on peaks and troughs, displays levels.
These levels can be disabled and configured.
The indicator displays the price of the level, the price tag can be disabled.
The "zigzag" line between the points can also be disabled.
The indicator has a built-in notific
An indicator for you follow the trend. We are providing a group of indicators that can support you decisions...
At this one you are having access to the trend indicator. Please review the others indicators for trend availables... That you give you the ability to understand the market flow and also you will be developing your pacience...
Trend the market as professional... We are using the Average True Range Indicator! Hope you enjoy.
An indicator for you follow the trend candles.
We are providing a group of indicators that can support your decisions...
At this one you are having access to the candle trend indicator. Please review the others indicators for trend availables...
That you give you the ability to understand the market flow and also you will be developing your pacience... Trend the market as professional...
We are using the Average True Range Indicator! Hope you enjoy.
MACD Pro - Features a built-from-scratch overhauled MACD indicator - Signals Buy and Sell Zones - Uses an exceptional noise cancelling filter - Signals up trends and down trends - Precise and accurate signals
MACD Pro is an indicator built from the ground up and is designed to signal optimal buy and sell zones. Take buy trades in the buy zones and sell trades in the sell zones. It includes a noise cancelation feature which rivals the best products on the market.
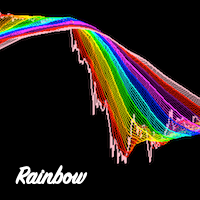
Rainbow Ribbon - Rainbow MA bands - Useful for spotting trend changes - Useful for spotting trend slopes - Useful for spotting trend acceleration - Ability to choose ribbon colors, moving averages, and distances - Provides colorful rainbow ribbons to show an array of moving averages
Rainbow Ribbon is an extremely useful indicator, it has been designed to make it easy to spot the trend and also changes within the trend before they occur. It can be used many different ways and provides the abil

TrendMMK is an extremely simple indicator. The Buy and Sell signal changes as soon as the indicator flips over the closing price. When the TrendMMK closes below the Price, a Buy signal is generated, and when the TrendMMK closes above the Price, a Sell signal is generated.
TrendMMK is a trending indicator, and like all trending indicators it works well in trending markets. However, it does give lesser false signals than a lot of other indicators and hence if you are an intraday trader who wan
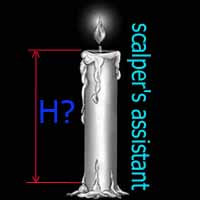
Индикатор "TakeOver" простой в использовании, создавался он для удобства определения разницы между открытием и закрытием текущей свечи. "TakeOver" рекомендуется применять в скальпинге с различными стандартными индикаторами МТ4, к примеру Envelopes, ZigZag, RSI и т.д. В настройках по умолчанию установлены уровни 200 и -200, но вы можете самостоятельно изменить. Один из примеров обнаружения входа в открытие сделки изображено на скриншоте, SELL если свеча закрылась выше уровня Envelopes и гистогра
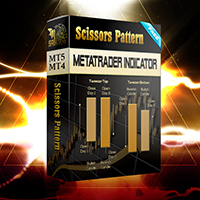
Configure scaffolding charts and signals based on the scissor pattern, which works great at low times.
Buy and sell signs based on 2 previous candle patterns
It works on the active time form, and when detecting the pattern in 4 time frames, 5 minutes, 15 minutes, 30 minutes and one hour, the alert can be set to notify us of the formation of this pattern.
MetaTrader version 5 click here
How to use:
When there is an opportunity to buy or sell, the marker places a scissors mark on the

Indicator of EARLY determination of the beginning of a new trend.
In addition, the indicator determines the global direction of the trend by the number of points: if there are more green dots (parameter Calculation of the global trend) - the trend is up; if there are more red dots, the trend is down.
The indicator does not redraw on the first candle.
The indicator can be used as an independent trading system, and as an addition to any other trading system.
The indicator can be used on a

OCTO TACK TREND PRO INDICATOR Summary/Description: Trend indicator Shows signals that tell you the current market trend Shows different signals to execute orders in favor of the current trend
Get ready to have the best trend indicator you've ever tried. It does not repaint in any way, once a signal has been captured, it remains there until it is finalized. It generates clear signals and always in favor of the trend (see screenshots) Just be attentive and wait for the alert to tell you when a n
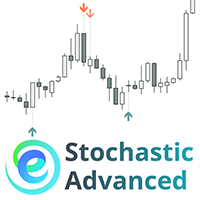
The " Stochastic Advanced " indicator displays the signals of the 'Stochastic" indicator directly on the chart without the presence of the indicator itself at the bottom of the screen. The indicator signals can be displayed not only on the current timeframe, but also on a timeframe one level higher. In addition, we have implemented a filter system based on the Moving Average indicator.
Manual (Be sure to read before purchasing) | Version for MT5 Advantages
1. Displaying the signals of the "Sto

The Strategy Tester product is an indicator where you can both test and run strategies. There are 64 strategies in total in this indicator. It uses 3 indicators. You can test tens of thousands of strategies by changing the parameter settings of these indicators. You can run 6 strategies at the same time. With this product, you will now create your own signals.
Recommendations and Features Used indicators: Macd, Bulls power, Bears power It works on all time frame Recommended time fra
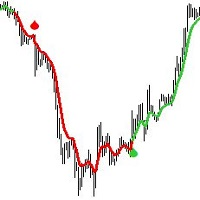
Introducing the Tear Drop Indicator: Your Gateway to Confident Forex Trading.
The Tear Drop Indicator is a powerful MetaTrader 4 tool designed to simplify trend identification and streamline entry point selection. Built upon customized Moving Average principles, this intuitive indicator offers traders an unparalleled advantage in navigating the forex market.
Key Features: 1. Customized Moving Average: The Tear Drop Indicator harnesses the power of customized Moving Averages, providing trader
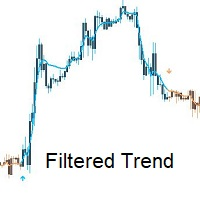
Introducing Filtered Trend: Your Reliable Companion in Forex Trading.
Filtered Trend is a powerful MetaTrader 4 indicator that revolutionizes trend identification and entry point selection in the forex market. Built upon customized Moving Average principles, this intuitive indicator offers traders a simple yet effective tool for navigating the complexities of currency trading.
Key Features: 1. Customized Moving Average: Filtered Trend leverages customized Moving Averages to provide traders w

Benefits of the Surfboard indicator :
Entry signals without repainting If a signal appears and is confirmed, it does NOT disappear anymore, unlike indicators with repainting, which lead to major financial losses because they can show a signal and then remove it. perfect opening of trades The indicator algorithms allow you to find the Peak and floor position to enter a deal (buy or sell an asset), which increases the success rate for each and every trader using it. Surfboard works with any ass
The Strategy Tester product is an indicator where you can both test and run strategies. There are 64 strategies in total in this indicator. It uses 3 indicators. You can test tens of thousands of strategies by changing the parameter settings of these indicators. You can run 6 strategies at the same time. With this product, you will now create your own signals.
Recommendations and Features Used indicators: Osma, Money Flow index, Stochastic It works on all time frame Recommended time

The Strategy Tester product is an indicator where you can both test and run strategies. There are 64 strategies in total in this indicator. It uses 3 indicators. You can test tens of thousands of strategies by changing the parameter settings of these indicators. You can run 6 strategies at the same time. With this product, you will now create your own signals.
Recommendations and Features Used indicators: Rsi, Bears power, Stochastic It works on all time frame Recommended time frame

The Strategy Tester product is an indicator where you can both test and run strategies. There are 64 strategies in total in this indicator. It uses 3 indicators. You can test tens of thousands of strategies by changing the parameter settings of these indicators. You can run 6 strategies at the same time. With this product, you will now create your own signals.
Recommendations and Features Used indicators: Rsi, Osma, DeMarker It works on all time frame Recommended time frame H1 You

The Strategy Tester product is an indicator where you can both test and run strategies. There are 64 strategies in total in this indicator. It uses 3 indicators. You can test tens of thousands of strategies by changing the parameter settings of these indicators. You can run 6 strategies at the same time. With this product, you will now create your own signals.
Recommendations and Features Used indicators: Stochastic, Macd, Williams Percent Range It works on all time frame Recommended time f

Kolmogorov-Zhurbenko 滤波器可以被认为是一种特殊的窗函数,旨在消除频谱泄漏。此过滤器最适合平滑随机(包括金融)时间序列。 基于此过滤器的指标包含以下参数: iLength - 用于构建过滤器的原始矩形窗口的周期。有效值为 2 - 255。 iDegree - 过滤顺序。如果 iDegree=0,那么将获得一个简单的移动平均线。如果 iDegree=1,那么你得到一个三角形移动平均线。更高阶允许更好的平滑和噪声抑制。允许值为 2 - 255。此外,此参数影响指标的最终周期 = iLength + iDegree * (iLength - 1)。 iMultiplier - 一个乘数,显示从过滤器值计算的标准偏差数。
指示器的外观如图所示。
CFF Dark M Volume
This is the most accurate Volume Reversal & Trend Following System for MT4 providing accurate signals to enter a trade without redrawing or delays. It can be applied to: All MT4 Charts . . The best results are on the timeframe 1H & 4H
IMPORTANT! Contact me after your purchase to get the detailed guide.
Most traders are %99 accurate with the help of CFF Dark Money Volume System. Benefits of CFF Dark M Volume System
Entry signals based on real volume of


Tra le tecniche alternative di trading più utilizzate dagli investitori, uno spazio interessante va dato alla strategia Ichimoku cloud che si basasulle nuvole (kumo).
Queste ultime sono il vero fulcro del sistema di trading Hichimoku Kinko Hyo. Molti erroneamente pensano che l’Ichimoku Kinko Hyo sia un semplice indicatore trend following, mentre invece è un vero e proprio sistema di trading completo .
Infatti grazie a UN SOLO grafico (sia pure molto complesso) ci dà una visione complet
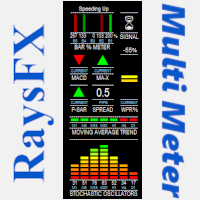
Questo indicatore è studiato per analizzare:
Lo Stochastic Oscillators , la Moving Averages , il MACD , il crossover MA , e per finire i Parabolic SAR. Il tutto viene racchiuso in un grafico che indicherà con frecce e spettri il momento ideale per aprire un trade. "La precisione dei segnali dipende sempre dai valori impostati, con i valori stock si ha un ottima affidabilità "

The "Easy Ichimoku Wave Meter" indicator is a basic tool to automatically determine Waves according to Ichimoku!
The indicator gives the possibility to simultaneously apply the Wave Theory, Time Theory and Target Price Theory according to the "Little Ichimoku" strategy developed by Sense Hosoda on the MT4 platform. The use of this tool allows not only novice traders to instantly (fully automatic) determine the waves and their rapid interpretation, it also allows to automatically measure the p

This is an innovative indicator that uses a perfect algorithm to quickly and accurately determine the trend direction. The indicator will show you the best entry points to get in the market and get out safely. *CFF Market Road*
Main Features: Next-Generation Trend Detection. Accurate and clear way of entering the market and exiting the market. Many ways to use the indicator. Suitable for different trading instruments and timeframes. Easy-to-Use Rules. Suitable for beginners and experienced tra
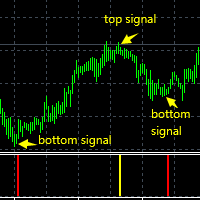
Super Top bottom signal指标系统是根据现阶段的K线波动振幅大小以及空间所处位置自动计算得出所形成的底部信号和顶部信号。
Super Top bottom signal指标系统将实时自动计算检测K线价格波动形成底部信号和顶部信号,当K线价格波动形成底部信号时会自动提示底部红色柱状信号,当K线价格波动形成顶部信号时会自动提示顶部黄色柱状信号,这些形成的底部信号和顶部信号提示是简单明了的,并完全是实时自动提示形成的底部信号和顶部信号,用户可以根据当K线价格波动形成底部信号时操作买交易和当K线价波动形成顶部信号时操作卖交易,当然用户也可以配合其它指标系统使用以提高买卖交易效率和成功率。利用Super Top bottom signal指标系统可以更加有效的辅助用户对当前K线价格波动形成底部信号和顶部信号进行有效的买卖交易.
Индикатор Strong Reversal Points H1 показывает стрелками сильные разворотные точки на таймфрейме H1. Индикатор не перерисовывает! Для максимального винрейта торгуйте только на таймфрейме H1 и только 3 (три) основные валютные пары: EURUSD, GBPUSD, USDCAD! Обязательно! Перед торговлей или тестом (прогоном в тестере) убедитесь в том, что в вашем терминале MT4 установлен правильный час открытия торгов в Нью-Йорке (параметр Terminal_NewYork_Open_Hour). Нужен час открытия Нью-Йорка именно по времени в

CFF Super Arrows Sniper Mode V2.0 This is an accurate following trend Arrows indicator for MT4 providing accurate signals to enter a trade without redrawing or delays. It can be applied to: All Mt4 charts. The best results are on the timeframe 15M,1H & 4H
IMPORTANT! Contact me after your purchase to get the detailed guide.
Most traders are %85 accurate with the help of CFF Super Arrows Sniper Mode indicator. Benefits of CFF Super Arrows Sniper Mode indicator
Entry signals
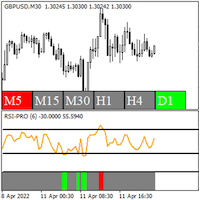
RSI Pro Indicator - Shows accurate RSI signals with modifiable price applications - Shows accurate RSI overbought and oversold levels - Shows multiple timeframe RSI overbought and oversold conditions on a single chart - 3 green bar sections in a row is an uptrend pattern - 3 red bar sections in a row is a downtrend pattern
The RSI Pro Indicator is a highly useful tool for determining overbought and oversold conditions and spotting RSI patterns, as well as spotting overbought and oversold cond
MetaTrader市场是一个简单方便的网站,在这里开发者可以出售自己的交易应用程序。
我们将帮助您发布您的产品,并向您解释如何为市场准备您的产品描述。市场上所有的应用程序都是加密保护并且只能在买家的电脑上运行。非法拷贝是不可能的。
您错过了交易机会:
- 免费交易应用程序
- 8,000+信号可供复制
- 探索金融市场的经济新闻
注册
登录