适用于MetaTrader 4的免费EA交易和指标 - 43
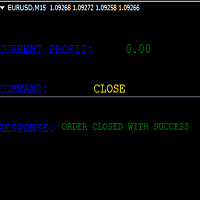
KEYBOARD CONTROL TRADING This script allows you to buy, sell or close positions using the keys on your keyboard. This allows you to create shortcuts to place buy or sell orders or to close an open position.
Setting:
LOT: To choose the lot size of your order.
TAKE PROFIT PIPS: To set your take profit in pips
STOP LOSS PIPS: To set the stop loss in pips
KEY FOR BUYING: To choose the keyboard touch to buy: -Up : To choose the UP direction key to place purchases -B : To choose the direction k
FREE

Индикатор показывает: открытые ордера по инструменту; количество ордеров; профит по Buy и Sell каждого инструмента; суммарный профит. Количество строк и столбцов по инструментам определяется автоматически, в зависимости от ширины окна. Индикатор обновляется по таймеру, время обновления задается в настройках. Устанавливать индикатор можно любой график вне зависимости от ТФ и пары. Клик по названию инструмента переключает текущий график на выбранный. Совместно со скриптом https://www.mql5.com/ru/
FREE

这是使用《新闻过滤器》所需的脚本。这个脚本选择任何你想过滤的图表,并将输入发送到新闻过滤程序。每个输入都是针对该图表的,所以你可以灵活地为每个图表设置不同的输入。新闻过滤器(免费演示)的链接可以在下面找到: 新闻过滤指南+下载链接
新闻选择 新闻来源于Forex Factory的经济日历。 选择可以基于任何一种货币,如USD,EUR,GBP,JPY,AUD,CAD,CHF,NZD和CNY等。 选择也可以基于关键识别,例如Non-Farm (NFP),FOMC,CPI等。 能够选择新闻影响级别的筛选,从低、中、到高影响。 自动模式只选择与图表相关的新闻。 新闻来源每小时自动刷新,以确保最新的新闻数据。 为每个新闻影响级别提供单独的输入,以确定您要过滤掉的新闻发布前后的分钟数。
订单管理选项
在新闻发布前关闭未平仓头寸的选项,并在新闻发布后恢复它们。 在新闻发布前删除挂单的选项,并在新闻发布后恢复它们。 在新闻发布前移除止损和止盈水平的选项,并在新闻发布后恢复它们。 在新闻发布前移动止损和止盈水平的选项,并在新闻发布后恢复它们。如果您希望在新闻期间适应增加的波动性,这个功能特别有用。
FREE
This is a medium-term conservative system. It tracks quote movements and defines entry points. The Expert Advisor is completely automated and features the unique algorithm. This demo version trades USDJPY.
Features It does not use Martingale; No grid; No scalping; No excessive parameters; Fixed lot; No complicated settings. Trades are usually opened infrequently. Orders may remain open for a few days for obtaining greater profit. Amount of trades per month is from 5 to 20. Deals are closed by T
FREE

简介:
很多交易者会面临这样的窘境(至少我经历过),需要给自己想手动进入的订单设置一个MagicNumber,但修改订单程序又比较费时费力。
于是,我想创建一个简单的工具,只要输入一些参数,就可以下单,并且设置好MagicNumber,以便日后可以对此订单做后续操作。
这个工具就是为了实现这样一个简单的功能:下订单的时候设置它的MagicNumber。
使用方法:
把这个EA应用到您想要做单的货币对或者商品的图表中,可以是任意的时间图(30M,1H,4H,1D...),设置好参数,就可以带着MagicNumber挂单或者直接进场到相应的货币对或者商品。
设置说明:
Set your Magic Number: 设置Magic Number,必须是整数。
Set your Lot: 设置交易手数。
Order Type: 设置立刻买入(Buy at once),立刻卖出(Sell at once),或者挂单交易,也可以什么也不做(No Action)。
Set your Entry for Pending order: (no use for immediate order) 如
FREE

The WTR Dynamic Range Indicator is a powerful and deeply customizable range indicator that takes in account the average upward and downward movement of the price in the past trading days. This fully customizable indicator can be setted for a lot of uses and cases:
• Trend trading on level breakouts
• Spotting high probability targets for Take Profits
• Setting a multiple targets for position scaling out The WTR Dynamic Range Indicator calculates the average movements in the long side, then p
FREE

This indicator helps you to Scan symbols which are in the Market Watch Window and filter out trends with alerts. It works based on the effective indicator "SUPERTREND" which is used by many traders for trading: When box color changes to " Green " or " Red " color, it indicates you for trend change for long and short entry. And also you will get alerted on screen. When it changes to " Green ", it indicates you that trend is going upwards, and you can take the long entry. If the color changes to
FREE

交易实用必备工具指标 波浪自动计算指标,通道趋势交易 完美的趋势-波浪自动计算通道计算 , MT4版本 完美的趋势-波浪自动计算通道计算 , MT5版本 本地跟单复制交易 Easy And Fast Copy , MT4版本 Easy And Fast Copy , MT5版本 本地跟单复制交易 模拟试用 Easy And Fast Copy , MT4 模拟账号运行 Easy And Fast Copy , MT5 模拟账号运行 强烈推荐趋势指标, 波浪的标准自动计算 和 波浪的标准自动计算MT5版本
合作QQ:556024" 合作wechat:556024" 合作email:556024@qq.com" 专业EA指标定制编写.
指标用于显示历史交易路径,方便大家看到本货币对的交易情况.
FREE
The NNFX ALGO TESTER is an tool designed to help the NNFX (No Nonsense Forex) traders develop, improve and test algorithms in a simpler, faster and more accurate way. This software reduces backtesting time from serveral days to only a few minutes! Please download the Demo instead of this Lite version. You can sill use the Lite but this version is now discontinued and it has much less functionality than the full version. The NNFX algo Tester software is too big (in terms of complexity) to be avai
FREE

Universal trading advisor "WOz" with a built-in trading panel
The EA's capabilities can be easily tested in the strategy tester in visual mode.
The EA can simulate real trading with the ability to move the SL and TP levels.
The EA has 5 modes of operation:
1. AUTOTRADING automatic trading mode on a set signal
2. ONLY SIGNAL mode of tracking the set signal without auto trading
3. RANGE MODUS mode of automatic placement of equidistant orders on Bayi Sell at a specified time
4. HAND MODUS
FREE

The indicator calculates the current spread for each tick using the formula Spread=(ASK-BID)/Point. Schedule of changes in the boundaries spread over the timeframe displayed in a separate window from the date of accession of the indicator. Two lines corresponding to the minimum and maximum spread values are displayed. The indicator window is self-adjusted according to the minimum and maximum values from the moment of launch. The minimum and maximum values for the entire period of the indicator o
FREE
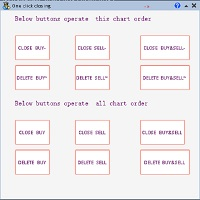
一键平仓小工具,可以针对买单、卖单和挂单进行批量操作,可以操作当前图表订单和所有订单,简单高效。 第一行第一个按钮是关闭当前图表 品种 所有买单,第二个按钮是关闭当前图表品种的所有卖单,第三个按钮是关闭当前图表 品种 的所有订单; 第二行 第一个按钮是删除当前图表 品种 所有买单挂单,第二个按钮是 删除 当前图表品种的所有卖单 挂单 ,第三个按钮是 删除 当前图表 品种 的所有 挂单 ; 第三行第一个按钮是关闭所有 品种的全部买单,第二个按钮是关闭所有 品种的全 卖单,第三个按钮是关闭所有 品种的全部订单; 第四行第一个按钮是删除所有 品种全部买单挂单 ,第二个按钮是 删除 全部品种 的全部卖单挂单 ,第三个按钮是删除 全部品种 的全部挂单 。 希望此程序能对您有用
FREE

This pointer is supplied of a double smoothing in such way to succeed to be more reactive of a blunt Moving Average but without tracing the noises of bottom of the market. Its use will have to be exclusively turned to the search and to the identification of the trend in action (even if graphically it could seem an indicator that indicates an inversion of the prices) because the first useful signal is had to the opening of the successive bar to that one that has made to invert the sense of the
FREE

Robot basado en indicadores para realizar operaciones de forma tendencial. Ideal para cuentas de cualquier capital, como un balance mínimo de 100$ Funciona con cualquier Timeframe. El bróker recomendado es Swissquote. Si desea utilizar el robot le recomendamos que se ponga en contacto con nosotros para asesorarle en la mejor configuración posible del sistema.
FREE

Moving Average Rainbow Stack: Free: Single Currency & Single Timeframe MA Stack Very useful for finding current and higher timeframe trends. Best suited for long term trend based trading. Use fewer MAs for quick scalping. And not suitable during low volatility. Only use during high volatility and steady trending markets. Use this to enhance your existing Trend based strategies to find best trends.
Read detailed description https://abiroid.com/product/abiroid-ma-stack Available MTF and Scanner v
FREE
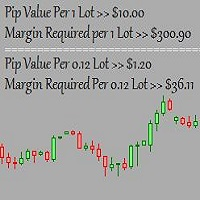
This is a basic tool that displays the Pip Value and Margin required for each symbol. It displays the same information for both a standard lot and the amount based on lot amount entered in the input section. It allows you to use different colors for each line Font Size FontType (Based on what fonts are installed in the system folder on the pc. Set to Ariel by default if the font entered is not available.) Allows X &Y coordinates so you can decide where on the chart the info is displayed.
FREE

SwapTrader is a simple Expert Advisor for swap trading at the end of the day. The EA scans the current chart instrument and instruments specified in the settings, looking for the currency and order with the positive swap. It opens positions with positive swaps after user-defined time and then closes these positions after user-defined time as soon as the specified profit is reached. The EA trades the current currency and instruments listed in the settings.
Expert Advisor Settings SymbolsList - l
FREE

Индикатор " AutoDiMA " рисует по графику в основном окне скользящую среднюю с динамическим периодом, рассчитываемым по стандартному индикатору " Average True Range (ATR) ". Когда " ATR " изменяется в диапазоне значений между верхним уровнем и нижним уровнем - тогда в заданном диапазоне меняется вариативный период скользящей средней. Принцип ускорения или замедления скользящей средней переключается в настройках параметром " FLATing ".
ВХОДНЫЕ ПАРАМЕТРЫ: - DRAWs : Количество баров для отображения
FREE

Lord Info 是 META TRADER 4 平台上的金融市場指標。
您可以將領主資訊放置在您平台上的任何股票/貨幣對上。
Lord Info 能夠向我們展示最近 (10) 天或可設定的 ATR 報告,我們可以在其中看到該貨幣對的基本波動率及其後果。
平均真實波動幅度(ATR)是技術分析中使用的市場波動性指標。 它通常源自於一系列實際範圍指標的 14 天簡單移動平均線。 ATR 最初是為商品市場而開發的,但後來已應用於所有類型的證券。
Lord Info 向我們顯示了蠟燭的每日高低(最高/最低)、目前以及最後一根蠟燭。
多空互換操作。
簡化和定制止損位以獲得分析性能。
主振盪器,自動時間範圍辨識:使用我們的個人化指標 (PAID) LordOscilator,M1、M5、M15、M30、H1、H4、D1。
您還可以了解關閉最後一根蠟燭的剩餘時間(分鐘、小時)、當前價差。
Lord Info對於結論和/或圖形分析來說是非常有用的信息。
FREE

Auto Close & Delete All is an assistant to help you quickly close all trades of a selected symbol or all symbols and delete pending orders. Through its flexible settings, you can set the script to either close only trades, or only pending orders, or both market trades and pending orders. The script can close deals and delete pending orders wither for the current instrument, or for all instruments. This is selected in settings. The settings are displayed on the screen before the script execution,
FREE

Why do you need this script? If you place lots of orders and re-calculate your risk for every order you placed, you definitely need such a script. This script places one or (optional) two different orders with the following script inputs.
Utility parameters Operation Type - "Buy","Sell","Buylimit","Selllimit","Buystop","Sellstop" Price - Entry price of the order(s). Stop Loss - Stop Loss of the order(s). Take Profit 1 - Take Profit of the first order. Take Profit 2 - Take Profit of the second o
FREE

Indicador "Heikin Ashi Master" para MetaTrader: Transforma tu Análisis con Velas Japonesas Suavizadas El indicador "Heikin Ashi Master" es una herramienta innovadora diseñada para traders que buscan una perspectiva única del mercado a través de las Velas Japonesas. Compatible con MetaTrader, este indicador suaviza la acción del precio, ofreciendo una interpretación simplificada y visualmente atractiva de las tendencias y cambios en el mercado. Características Destacadas: Suavizado de la Acción
FREE

Cat趋势VZ是一个不断改进的指标,具有准确和有利可图的入场信号。
Cat Trend vz指标线根据趋势方向改变颜色,指标在价格反转点绘制箭头。
此外,Cat趋势VZ指标实现了关于箭头外观的声音和文本警报。
重要提示:指标不重绘。
猫趋势VZ的主要特点: 分析函数
它可以在任何货币对和时间框架上使用; 指标不重绘; 这是其他指标的一个很好的补充; 不需要过滤器进入; 图形功能
占据图表上最小数量的位置; 柔性酊剂; 简单易学;
猫趋势VZ的主要特点: 设置
长度-平滑深度; 相位是在-100内变化的参数。.. +100,影响过渡过程的质量; 移位-指示器沿时间轴的移位; 输入价格海关-计算指标的价格选择(0-"关闭",1-"开放",2-"(高+低)/2",3-"高",4-"低"); JMA移动线No.1-设置JMA的第一个移动平均线; JMA移动线2号-设置第二个JMA移动平均线; CCF移动平均线-设置CCF移动平均线; Cjcf移动平均线-设置CJCF移动平均线; 平均周期MA-平均MA的周期; 计数条-要读取的条数; 线路显示
行-显示行真/假;
FREE

This indicator is designed to detect the best divergences between price/MACD and price/RSI. MACD and RSI produce by far the best divergence signals therefore this indicator focus on those two divergences. This is the FREE version of the indicator: https://www.mql5.com/en/market/product/28375
Important Information How you can maximize the potential of the scanner, please read here: www.mql5.com/en/blogs/post/718074
The free version works only on EURUSD and GBPUSD! This indicator scans for you u
FREE

Pivot Mean Oscillator (PMO) is a unbounded zero-centered oscillator that provides a quick and normalized measure of divergence between two spreads. Detailed description of the mathematical formulation along with some comments and experiments can be found in this article .
Trading aspects
This version of PMO is tuned on spreads relative to Close and Open price signals against their cumulative moving average (CMA). Positive PMO(m,n) values means that last (normalized) m Close prices are higher t
FREE

This is the author's trading system.
Designed for intraday trading. Signals are not rewritten. Suitable for any instrument and timeframe. You can enable alerts. Easy to use. See screenshots. Simple settings! Everything has already been done for you! The basis is the analysis of the current trend. The indicator is looking for a way out of accumulation. If you have been looking for a good trading system for a long time, then it is in front of you! Subscribe to my telegram channel, where we discus
FREE

Introduction This Indicator Is Based On Average Price/Maximum Price Moves, And Using Moving Bollinger Bands And Moving Averages.
The Advantage Of Using It With YOUR own Analysis Will Confirm Potential Supports And Resistances While it Compliments With Your Analysis
The Indicator Is Non-Repainting
AND Along With Our Special Trend METRE that Changes With The Conditions OF A Bullish Or Bearish Trend....
Recommend Time-Frames: H1 H4 M15
Usage: The Indicator Is Very Profitable If Use
FREE
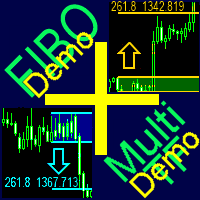
A ready-made multitimeframe trading system based on automatic plotting and tracking of Fibonacci levels for buying and selling any symbol. Demo version - calculation of the last 390 bars is not performed.
Advantages Determines the trend direction based on a complex of 14 indicators ( Cx ), extremums of ZigZag ( Z ), RSI ( R ), Impulse ( I ) Displaying the values of 14 indicators comprising the trend direction ( Cx ) Plotting horizontal levels, support and resistance lines, channels View the plo
FREE
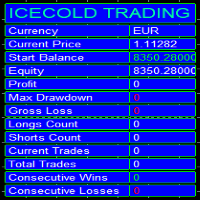
Icecold Trading OSD (On Screen Display) Is very Helpful and easy to use. Try Demo out today!
On Screen Display -Start Balance -Equity -Profit -Max Drawdown -Gross Loss -Longs count -Shorts count -Current Trades -Total Trades
*Know that in the Total Trades, Consecutive Wins & Consecutive Loss columns , those are ALL of the trades your account has done. It does not show 0 when loaded if you have completed trades already in Account History... Just note. To RESET just change Account history perio
FREE

MQLuxe A1 is a special MT4 Robot that is a fully automated trading system that doesn't require any special skills from you. Just fire up this EA and rest. You don't need to set up anything, EA will do everything for you. EA is adapted to work on small deposits.
Set up an adviser according to the instructions !!! Important information :
please read this pages and see the youtube videos. For the first 2 weeks, trade on a demo account or a cent account (to choose the best trading conditions for y
FREE

With the SR Dashboard, you get a powerful tool to control some of the most important information in trading. Assemble a setup according to your strategy and get informed as soon as this setup is valid. Assign scores to defined conditions and let the Dashboard find them. Choose from Trend, Average Daily Range, RSI, Moving Averages, Pivot (Daily, Weekly, Monthly), Highs and Lows, Candlestick Patterns.
Note: This indicator is the free version of the Netsrac SR Dashboard. This version only supports
FREE

Free Scalping is a comprehensive manual system developed for the most efficient trading at any market conditions and time scale.
The system is based on two main blocks:
1. The block of trend determination that calculates dynamic support and resistance. The function of auto-optimization is available for this block.
2. The block of price deviation from its median based on the big set of regressions to get the statistically-valid result. Entry rules For buys:
1. The trend goes up
2. The price i
FREE
~*~*~*~* ~* ~* ~* ~* ~* ~*
*2023/07/19 Ncon1.91公開しました。 ~*~*~*~* ~* ~* ~* ~* ~* ~*
**************************************************************************************
ストラテジーテスターでトレードの練習を出来ます。 デモ口座でトレードの練習を出来ます。 動作保証はありません。 利益を保証するものではありません。
如何なる損失をしたとしても使用者の自己責任となります。
機能によってストラテジーテスターとデモ口座のどちらかで動かないものもあります。
**************************************************************************************
::主な設定項目:: マジックナンバー コメント 通貨ペア同期 コントロールボタンロック
ミニコントローラー ロットサイズ自動計算 リスクパーセント自動計算
最大ポジション数 最大スプレッド
FREE

FREE

The EA monitors positions for selected pairs, sets a break-even level and moves a trailing stop. When the trade is "n" points of profit (parameter dist_BEP), the stop loss is moved to the break-even point (the level of the trade opening price) plus the specified distance in points (parameter BEP) The EA checks all available (or filtered) trades for break-even and moves stop-loss levels if necessary. The EA also checks all available (or filtered) trades for trailing stop conditions and, if neces
FREE

The indicator represents 4 moving averages, shifted back. Created, like any moving average indicators, in order to see the approximate balance of volatility and the number of bulls and bears. The difference from other Moving Averages is that an attempt is made here to bring the moving averages of different periods to a common denominator, respectively, to bring the number of traders trading on different timeframes to a common denominator. The indicator is distributed as is.
MnojitelMA1, Mnojit
FREE
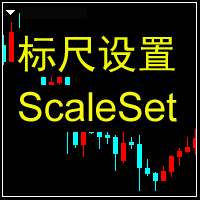
本指标用来关闭或开启价格标尺和时间标尺。选择true为显示标尺,选择false为关闭标尺。(价格标尺关闭后,再开启有可能显示全不。但可以通过周期切换的方式解决。) 本指标 设置了D 和P 两个标签,可以实时的通过点击开启或关闭标尺。相关的参数可以自定义修改,如标签的名称、位置、坐标等。....... labD_Window = 0 标签显示的窗口选择 labD_Corner = 0 标签 显示的 角落选择 abD_X = 0 标签 显示的 横轴距离 labD_Y = 35 标签 显示的 竖轴距离 labD_Txt = "D" 标签 显示的 文字 labD_FontSize = 11 标签 显示字体的大小 真是奇葩的描述字数限制,系统要求至少300个字。剧情不够只能掺水了。
FREE

4 buttons for managing your trades.
Close All : will close all open positions on the current chart Delete All : will delete any pending orders on the current chart SL + 1 : will move the stop loss 1 pip closer to the breakeven point on all open trades on the current chart Delete SL : will remove the stop loss for all open positions on the current chart
Useful for everyone who opens multiple positions on the same asset, where fast execution is essential.
FREE

Trend easy простой трендовый индикатор в виде гистограмы. окно индикатора разделено на две части верхняя гистограма движение в бай, нижняя гистограма движениие в сел. Кроме гистограмы, сигнал индикатора дублируется на графике стрелками. В меню индикатора имеется количество баров в истории индикатора
значения периода для определения тренда разрешение рисования стрелок на графике код и цвета стрелок алерты и отступ стрелок
FREE

#########################################################################################
WeekendGap EA opens pending orders in the first hour of the beginning of a new week. It trades the weekend gap. The pending orders are cancelled within 2 days if not caught. WeekendGap works on most currency pairs, but you may limit yourself to the majors. The lot size is increased automatically based on the MinimumLots, MaximumRisk and DecreaseFactor. #######################################################
FREE

This indicator is an utility for have always under control, how much time is left at the end of the bar setted.
The utility show on the lower right of the chart, the countdown to the end.
When the remaining seconds is = to the seconds set in the input, the color of remaining seconds on chart, change color and play a warning sound to warn you that the bar is about the end. When the remaining seconds is < to the seconds set in the input, the utility play a beep to warn you that the bar is in co
FREE

This Expert Advisor will change how you manage your risk forever.
The EA automatically calculates your position size by either looking at your balance or equity. You need simply type in how much risk you want to have on that particular trade, move your TP line and SL line and it does the rest. Click buy or sell and it enters the position and places your TP/SL for you. It does the same thing for pending buy limits or sell stops. Feel confident knowing your risk before entering your trade! Most
FREE

This script can generated a text file including Account information such as Account Number Account Name Account Leverage Account Balance MT4 Location Data Folder Location Demo / Real Account Stop Out Mode Stop Out Level etc. Enjoy the script. Please leave a comment or send me an email if you have any idea. The Script is developed by Steve Wan (Eamil: fxac01@gmail.com)
FREE

StrxInfoPanel is an essential tool for every trader It gives you an immediate idea about your account and realtime informations about the current symbol and timeframe you are analyzing Every information line can be hidden and shown via parameters, even panel position can be changed via input parameters Parameters list: Corner : the screen corner where you want the panel to be shown Left, Top, and Width : customizable position and panel dimensions BgColor : background color Show XXX : every infor
FREE

The indicator is based on a single Moving Average of a user-defined period. By analyzing the price movement of the price relative to this MA, and also by tracking all updates of the price Highs and Lows over the same period as the MA period, the indicator draws its own picture of the trend, avoiding the ever-breaking MA lines. Therefore, if the trend goes up, the line will also point upwards and will not change its direction even on small retracements, allowing to capture almost the entire trend
FREE

AR Canada is a fully automated trading robot optimized for USDCAD H1. This free version trades only a fixed lot with minimum volumes. No hedging, no martingale, no grid, no arbitrage, etc. The EA applies the trading algorithm based on crossing the moving averages. Take Profit and Stop Loss values are fixed and have a ratio of 1:4. Positions are closed by the EA when Take Profit or Stop Loss level is reached.
Parameters MagicNumber = 3 - unique EA magic number.
FREE

This expert is a utility to help any trader to find the right lot size according to the risk he wants to take. It calculates the lot size based on account equity and added stop loss.
The utility can't to open or close position.
Attach the expert in the same symbol as the one you want to open position.
PARAMETERS LossPips - Stop loss in pips for your position. RiskPercent - Risk of equity you want to get.
FREE
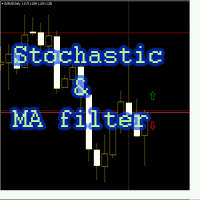
Советник "Stochastic and MA_filter" торгует по индикатору "Stochastic Oscillator", используя фильтр в качестве двух средних скользящих, по желанию Пользователя применяется мартингейл (количество умножения лота при серии убытков ограничивается), безубыток, трейлинг стоп, инвертирование сигнала, возможно настроить, как скальпирующий советник.
Для каждого валютного инструмента необходимо подбирать настройки. Настройки советника: Индикатор Stochastic Oscillator: Kperiod=5; период линии K Dpe
FREE

Overview The script displays information about the trade account: Account - account number and type (Real or Demo); Name - name of the account owner; Company - name of a company that provide the access to trading; Server - trade server name; Connection State - connection state; Trade Allowed - shows whether trading is allowed on the account at the moment; Balance - account balance; Equity - account equity; Credit - amount of credit; Profit - profit size; Free Margin - free margin on the account;
FREE

Trade Space PRO Профессиональная торговая панель для MT4. Главное ПРЕИМУЩЕСТВО - все настройки выведены на график символа. Запоминаются автоматически для каждого символа отдельно. Трейдинг/риски/блок контроля новостей и тайминга/панель сигналов . Вся важная информация отображается на панелях. Вам нужно только открыть позицию одним щелчком мыши. Управление открытой позицией так же просто, насколько это возможно: вы можете легко настроить уровни Стоп Лосса (S/L) и Тейк Профита (T/P). В о
FREE

Close All SELL Orders for MT4 script - closes absolutely all orders, whether pending or market ones.
Orders are closed at the current profit/loss indicators at the time of closing.
The script is suitable for moments when you need to quickly close all orders at the current indicators.
The script is very easy to use, just drag the script onto the chart and it will do its job.
Add me as a friend, I have many other useful products.
FREE

iRSI in iMA is indicator to change color in iMA if iRSI crosses level up (up trend) or crosses level down (down trend). It is a useful tool to track when the upside and the downside iRSI on iMA.
You can to get source code from here.
Parameters MA_Periods — Period for iMA. MA_Method — Method for iMA. RSI_Periods — Period for iRSI. RSI_ApliedPrice — Price used for iRSI. RSI_LevelsUp — Level iRSI for up trend. RSI_LevelsDN — Level iRSI for down trend. BarsCount — How many bars will show the line
FREE

This is the Free Version of "Just Copier Pro MT4" (Please check : https://www.mql5.com/en/market/product/34472) This free version is available to be used within 2 hours only, and it has limited features. Please also check this product at fxina.hostingerapp.com.
If you want to share your trading signal, but you dont want to distribute your investor password, this product is fit with you. "Just copier Pro" is designed to copy trading without any complicated settings. The copy can be done in o
FREE

The Netsrac Correlation Trade Indicator (NCTI) was created to trade correlations between different assets. NCTI offers five different strategies to do this. Five different correlation trading strategies with two or three assets Fast access your assets with one click via asset buttons Your profit/loss at a glance Configurable alerts via screen or mobile You can use the indicator with every timeframe. Higher timeframes give fewer but better signals. If you have some questions or suggestions - plea
FREE

Simply Parabolic SAR EA is an expert advisor that places orders in favor of the trend changes of the "Parabolic Stop And Reverse" indicator, placing its take profit, stop loss and trailing stop. You can see more of my products here: https://www.mql5.com/en/users/joaquinmetayer/seller
Inputs: Lots TakeProfit in points StopLoss in points TrailingStop distance in points Step PSAR Max PSAR
FREE

Information panel displaying traded lots for pairs, as well as the minimum margin level and maximum drawdown. The info panel will be indispensable when calculating the affiliate program and expert advisor tests. In the settings, you can add up to 10 of your favorite pairs, customize the panel display colors and its location. Check out my other products, maybe they will be useful to you.
FREE

MayaTradeManager is a pure & 100% manual trade orders management. MayaTradeManager doesn't have any indicators or signals to be used together since all trades are done by the user only. MayaTradeManager is an good tool usually for whoever that has a signal at the user disposal but don't have the one-stop-center to manage their trades conveniently. MayaTradeManager brings all of the trades management into one simple panel in a very convenient way.
Just a quick note Lot size box is an editable bo
FREE
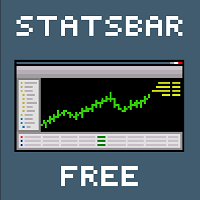
StatBar 1.6 Indicator showing balance, earnings for today, yesterday and the day before yesterday. The indicator also shows: - Server; - GMT; - Server time; - Shoulder; - Spread.
Description of variables: extern int Magic = "-1"; // Magic for statistics -1 = all 0 = manual extern string Symboll = "-1"; // Symbol for statistics -1 = all 0 = current EURUSD = for EURUSD
FREE

The principle of this indicator is very simple: detecting the candlestick pattern in D1 timeframe, then monitoring the return point of graph by using the pullback of High-Low of D1 Candlestick and finally predicting BUY and SELL signal with arrows, alerts and notifications. The parameters are fixed and automatically calculated on each time frame. Example:
If you install indicator on XAUUSD, timeframe D1: the indicator will detect the reversal, pullback, price action on this timeframe (for exam
FREE
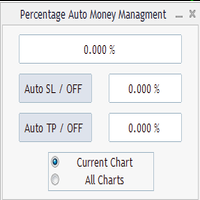
Percentage Auto MM sends automatic orders to close all positions immediately after reaching percentage SL/TP target, set by the User . Orders will be sent if the market is open and the SL / TP application buttons are pressed ( they can be used separately or together ) . It could be applied for current chart/all charts, depending on selected option. It works independently of SL and TP order settings for individual positions. SWAP, Commision can be also included ( look at input options ).
Atte
FREE

ONREX IV ONREX IV is a trading tool that be used to practise and enhance your manual trading skills. It's also Auto Trading Expert Advisor. Don't worry if your trades goes in the wrong direction, ONREX IV will take over and try to manage and control your risk management. ONREX IV offers a trading interface panel that allows traders to trade manually or opt FULL AUTO TRADING. It's also set to hide the Take Profit and Stop Loss. ONREX IV has its own Magic Number, please use trade button on the p
FREE

OrderSend Time - Automated Trading at Specified Time OrderSend Time is a convenient utility that allows you to schedule trade executions at specific times. Simply set the desired hour, minute, lot size, and order type (buy or sell), and the utility will automatically execute the trade at the designated time. IMPORTANT! Please note that this utility operates based on the broker's time in the 24-hour format, not your computer's time. Key Features: Select the hour, minute, lot size, and order type.
FREE

RaysFX Market Trend Histogram Il RaysFX Market Trend Histogram è un indicatore personalizzato per la piattaforma di trading MetaTrader 4. Utilizza il Commodity Channel Index (CCI) per identificare le tendenze del mercato e visualizza queste informazioni in un istogramma intuitivo. Caratteristiche principali: Identificazione delle tendenze: L’indicatore calcola il CCI per ogni periodo di tempo e lo utilizza per determinare se il mercato è in una tendenza al rialzo o al ribasso. Visualizzazione in
FREE

Traditional Moving Average (SMA, EMA, SMMA, LWMA...) is very useful for identifying trends, but what will you do when you want to trade on lower timeframe, and you need to identify the bigger trend by a higher timeframe; Of course, you can make it by dividing your chart in separated windows, but your analytics will not be clear and intuitive ... That's why we build the Multi Timeframe Moving Average indicator.
With Multi Timeframe Moving Average ( MTF_Moving Average ), you can determine the Mo
FREE
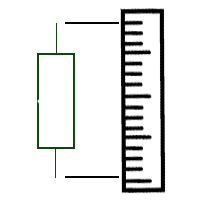
Индикатор отображает размер бара и его направление. ---------------------------------------- Цвета гистограммы: * Красный - Медвежий бар.
* Зелёный - Бычий бар.
* Серый - Цена открытия и цена закрытия равны. * Синяя линия - скользящая средняя.
---------------------------------------- Параметры: - Type of Calculation - Тип расчёта ( Low to High, Open to Close ) - Moving Avarage - Период скользящей средней
FREE
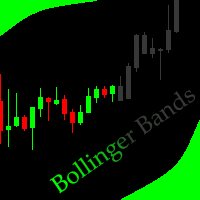
This indicator allows to hide Bollinger Bands (on all MT4 timeframes) from a date define by the user, with a vertical line (Alone) or a panel (with "Hidden Candles"). Indicator Inputs: Period Deviations Shift Apply To Color Style Width Information on "Bollinger Bands" indicator is available here: https://www.metatrader4.com/en/trading-platform/help/analytics/tech_indicators/bollinger_bands ************************************************************* Hey traders!! Give me your feeds! We are
FREE

Most of brokers make slippage for your orders (stop orders or market orders). When you make limit orders (Buy or Sell), they don't make slippage for you. Because it is for your advantage. This EA will resolve limit slippage problem for you with any brokers. Slippage Problem Example: The price now is 1.31450, you put sell limit at 1.31500. If the price jumps to 1.31550. The Broker will execute your sell limit at 1.31500 NOT 1.31550. If you put buy stop, the Broker will execute it at 1.31550 (or m
FREE

Mega Alert Level Indicator: A Simple Yet Valuable Tool The Mega Alert Level indicator provides sound, informational, push, and email notifications when the price of a currency pair touches or approaches standard support and resistance levels, as well as any other objects on the chart you select. Features: Notifications: Customize notifications to your preference—choose between Email, Popup, or Push. All settings are displayed in the upper right corner of the chart. Ease of Use: Simply attach th
FREE

Waddah Attar Mini Close Graphical Panel EA .
This EA does not Trade with built in Strategy .
It is shows you your orders information in a table mode . You can close any group of your orders with mouse click . The table contain : Type : Buy + : means all buy profit orders . Buy - : means all buy loss orders . Sum : means all buy orders .
Sell + : means all sell profit orders . Sell - : means all sell loss orders . Sum : means all sell orders .
Total : means all orders . North : means all or
FREE

TickChart Indicator plots the tick line on the main window of MetaTrader.
In the Lite version, the number of ticks is limited to 20 and the alert function described below is omitted. The "tick-line" shows the most detailed, fastest and real-time activities of the market, which are usually hidden in bars or candles longer than 1 minute. Usually, several new tick-line segments appear while a bar of M1 time frame is completed. After the release of an important economic indicator, the number of tic
FREE
MetaTrader市场提供了一个方便,安全的购买MetaTrader平台应用程序的场所。直接从您的程序端免费下载EA交易和指标的试用版在测试策略中进行测试。
在不同模式下测试应用程序来监视性能和为您想要使用MQL5.community支付系统的产品进行付款。
您错过了交易机会:
- 免费交易应用程序
- 8,000+信号可供复制
- 探索金融市场的经济新闻
注册
登录