MetaTrader 4용 무료 Expert Advisor 및 지표 - 43

Tele Notify can help you send notifications for opened & closed trades to a Telegram channel or your personal Telegram. (see Master Notify for more options of notifications: price, equity, profit, etc. Get more EAs here ) Update: Now you can check your account info anytime from your Telegram by simple command: /check. This option is only valid when you use your Telegram User ID on EA inputs
******************************************************************************************** HOW TO SET U
FREE
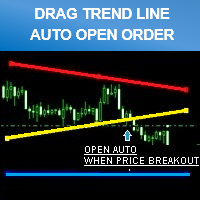
Smart tool system for opening orders by Trend Line automatic.
Just drag a Trend line to define your breakout point then click "Confirm Order" button. The EA will automatically opening order when price breakout Trend line that defined by you. Work on live and back test (Strategy Tester) Can modify trend line on real-time. Note : This demo version is for testing on CADCHF pair only. The full version can be found here: https://www.mql5.com/en/market/product/11202 Features
Drag trend line for open
FREE

A trading adviser that not only trades, but also has a built-in game. The EA trades on signaling bars and MACD and RSI indicators. The ATR indicator is used to determine volatility. Many other customizable options are available. An interesting feature is the built-in free game in which you need to control the ball and collect coins. The ball jumps along the line of the moving average, you need to control it with the arrows or the "w a s d" keys and not let it fall outside the playing area (2 re
FREE

FREE VERSION ONLY USE LOT SIZE 0.01 TO UNLOCK IT GO HERE https://www.mql5.com/en/market/product/61498
SuperMac EA is a trading robot for the trading on forex and trades Scalping Strategy and Tren Follower. This is a Trend Following system that trades in all session. It use Multi Complex Algorithm to determine tren behaviour. EA optimized on EURUSD, GBPUSD and NZDUSD (Use together) but can be use on other pair
Use PAIR can use 3 pairs (recommended to maximize profit) at the same time (
FREE

Currency Switcher Indicator
The "Currency Switcher" indicator is designed for MetaTrader 4 and allows users to quickly switch between different currency pairs and other trading instruments directly from the chart window. This indicator creates a series of buttons on the chart, each associated with a specific trading symbol. Users can click on these buttons to change the current chart symbol.
Key Features
- **Symbol Categories**: The indicator supports various symbol categories, including Maj
FREE

O indicador é uma ferramenta desenvolvida para o MetaTrader, projetada para auxiliar na análise detalhada do comportamento do preço em relação a uma média móvel específica. Ao ser anexado ao timeframe diário, o ele realiza cálculos e monitora, em timeframes menores, quantas vezes o preço toca determinados níveis de afastamento durante o dias além de calcular a média dos toques.
MT5: https://www.mql5.com/pt/market/product/111710
FREE

This indicator softens the value of the RSI (Relative Strength Index) and reduces its volatility. You can use this indicator in your expert advisors, indicators and strategies. With this indicator, you don't need to have two indicators on the chart at the same time. For example, an RSI indicator and a Moving Average indicator If you have any questions or concerns, contact me.
FREE

Индикатор сглаженного Moving Average (xMA)
Входные параметры: xMA Period - период усреднения xMA Method - метод усреднения ( 0-SMA | 1-EMA | 2-SMMA | 3 - LWMA) xMA Price - используемая цена ( 0 - CLOSE | 1 - OPEN | 2 - HIGH | 3 - LOW | 4 - MEDIAN | 5 - TYPICAL | 6 - WEIGHTED) xMA Color - цвет индикаторной линии xMA Width - толщина индикаторной линии
Принцип работы
Индикатор перерассчитывает стандартный технический индикатор Moving Average (дважды усредняет получаемые значения iMA). Период с
FREE

Price Trap Test
This is a free version of the Price Trap Full Expert Advisor designed to provide an opportunity for free testing of the algorithm on a live account, and not in the strategy tester. The trading signals algorithm is exactly the same here, the difference is that you cannot change the parameters, with the exception of GMToffset . Full version verified with broker just2trade Parameters
GMToffset - your broker's time difference and GMT.
FREE
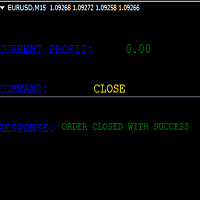
KEYBOARD CONTROL TRADING This script allows you to buy, sell or close positions using the keys on your keyboard. This allows you to create shortcuts to place buy or sell orders or to close an open position.
Setting:
LOT: To choose the lot size of your order.
TAKE PROFIT PIPS: To set your take profit in pips
STOP LOSS PIPS: To set the stop loss in pips
KEY FOR BUYING: To choose the keyboard touch to buy: -Up : To choose the UP direction key to place purchases -B : To choose the direction k
FREE

Индикатор показывает: открытые ордера по инструменту; количество ордеров; профит по Buy и Sell каждого инструмента; суммарный профит. Количество строк и столбцов по инструментам определяется автоматически, в зависимости от ширины окна. Индикатор обновляется по таймеру, время обновления задается в настройках. Устанавливать индикатор можно любой график вне зависимости от ТФ и пары. Клик по названию инструмента переключает текущий график на выбранный. Совместно со скриптом https://www.mql5.com/ru/
FREE

뉴스 필터를 사용하는 데 필요한 스크립트입니다. 이 스크립트는 필터링할 차트를 선택하고 입력을 뉴스 필터 프로그램으로 보냅니다. 모든 입력은 해당 차트에만 적용되므로 차트마다 다른 입력을 유연하게 설정할 수 있습니다. 뉴스 필터(무료 데모)에 대한 링크는 아래에서 확인할 수 있습니다: 뉴스 필터 가이드 + 다운로드 링크
뉴스 선택 뉴스 소스는 Forex Factory의 경제 캘린더에서 얻어집니다. USD, EUR, GBP, JPY, AUD, CAD, CHF, NZD 및 CNY와 같은 어떤 통화 기준으로 선택할 수 있습니다. Non-Farm (NFP), FOMC, CPI 등과 같은 키워드 식별을 기준으로 선택할 수도 있습니다. 저, 중, 고 영향을 가지는 뉴스를 필터링할 수 있도록 선택할 수 있습니다. 차트와 관련된 뉴스만 선택하는 자동 모드가 있습니다. 뉴스 소스는 최신 뉴스 데이터를 보장하기 위해 매 시간 자동으로 새로 고칩니다. 각 뉴스 영향 수준에 대한 별도의 입력이 제공되어
FREE
This is a medium-term conservative system. It tracks quote movements and defines entry points. The Expert Advisor is completely automated and features the unique algorithm. This demo version trades USDJPY.
Features It does not use Martingale; No grid; No scalping; No excessive parameters; Fixed lot; No complicated settings. Trades are usually opened infrequently. Orders may remain open for a few days for obtaining greater profit. Amount of trades per month is from 5 to 20. Deals are closed by T
FREE

Necessary for traders: tools and indicators Waves automatically calculate indicators, channel trend trading Perfect trend-wave automatic calculation channel calculation , MT4 Perfect trend-wave automatic calculation channel calculation , MT5 Local Trading copying Easy And Fast Copy , MT4 Easy And Fast Copy , MT5 Local Trading copying For DEMO Easy And Fast Copy , MT4 DEMO Easy And Fast Copy , MT5 DEMO
Strongly recommend trend indicators, automatic calculation of wave standard and MT5 ver
FREE

The WTR Dynamic Range Indicator is a powerful and deeply customizable range indicator that takes in account the average upward and downward movement of the price in the past trading days. This fully customizable indicator can be setted for a lot of uses and cases:
• Trend trading on level breakouts
• Spotting high probability targets for Take Profits
• Setting a multiple targets for position scaling out The WTR Dynamic Range Indicator calculates the average movements in the long side, then p
FREE

Hi New Update Available At Non Free Version. Its more profitable and saver than older one. Just Grab it fast. Every month price goes up
This Free version Only use Lot 0.01 cannot modify the Lot Size. If You wanna unlock the lot size you can buy Pro Version at https://www.mql5.com/en/market/product/49608 See EA Performance on Backtesting with low balance = https://youtu.be/8Wok_CTzcsQ
Mata Elang EA is a trading robot for the trading on forex and trades Scalping Strategy. This is a Trend
FREE
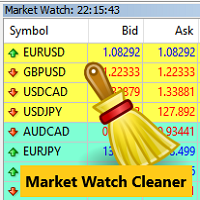
Clean up Market Watch from unused symbols.
If you use multiple advisors and terminals on the same account your Market Watch windows may get filled with unused symbols from orders and positions opened on other terminals. Every symbol in the Market Watch consumes cpu power and bandwidth to get constantly updated and if you are on a vps you want to minimize resources consumption. Market Watch Cleaner helps you with that by periodically cleaning your Market Watch window from unused symbols.
Param
FREE

Universal trading advisor "WOz" with a built-in trading panel
The EA's capabilities can be easily tested in the strategy tester in visual mode.
The EA can simulate real trading with the ability to move the SL and TP levels.
The EA has 5 modes of operation:
1. AUTOTRADING automatic trading mode on a set signal
2. ONLY SIGNAL mode of tracking the set signal without auto trading
3. RANGE MODUS mode of automatic placement of equidistant orders on Bayi Sell at a specified time
4. HAND MODUS
FREE

you can close all your positions in profit or lost when you use this robot. 1.you set your max profit and max lost for all your positions. 2.the robot show you in a window beside your chart. 3.when your equity reach your target close all your positions. 4.you can use one of them or both (profit or lost)togather. 5.this robot close all your positions. ((if you have any idea or want somthing i can help you)) i hope you win in all your times of life. best regard
FREE

This tool helps you to control the situation at other times and include them in your trades when analyzing the market This tool scans the market and reports the movement of the market at different times With the help of this tool, you can prevent many wrong analyzes With the help of this tool, you can have an overview of the market in the shortest time and save your time
FREE

This pointer is supplied of a double smoothing in such way to succeed to be more reactive of a blunt Moving Average but without tracing the noises of bottom of the market. Its use will have to be exclusively turned to the search and to the identification of the trend in action (even if graphically it could seem an indicator that indicates an inversion of the prices) because the first useful signal is had to the opening of the successive bar to that one that has made to invert the sense of the
FREE

Robot basado en indicadores para realizar operaciones de forma tendencial. Ideal para cuentas de cualquier capital, como un balance mínimo de 100$ Funciona con cualquier Timeframe. El bróker recomendado es Swissquote. Si desea utilizar el robot le recomendamos que se ponga en contacto con nosotros para asesorarle en la mejor configuración posible del sistema.
FREE

Fibonacci retracement is really one of the most reliable technical analysis tools used by traders. The main problem with using these levels in trading is that you need to wait until the end of the impulse movement to calculate the retracement levels, making difficult to take a position for limited retracement (0.236 or 0.382). Fibo Dynamic solves this problem. Once the impulse movement is identified the retracement levels are automatically updated allowing very dynamic trading in trends with onl
FREE
MT4 Alert Sender is a free ea tool that help you send the alert messengers in MT4 program for many different purpose with ease. Very simple and effective, you only need to input the alert content in a input box, then click a "Send Alert" button. The EA will send alert message. An alert pop-up shows your content in a new window pop-up.
You can combine of using MT4 Alert Sender EA with any other tools out there for your need. Thanks for your trust in my product.
FREE
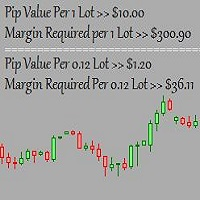
This is a basic tool that displays the Pip Value and Margin required for each symbol. It displays the same information for both a standard lot and the amount based on lot amount entered in the input section. It allows you to use different colors for each line Font Size FontType (Based on what fonts are installed in the system folder on the pc. Set to Ariel by default if the font entered is not available.) Allows X &Y coordinates so you can decide where on the chart the info is displayed.
FREE

SwapTrader is a simple Expert Advisor for swap trading at the end of the day. The EA scans the current chart instrument and instruments specified in the settings, looking for the currency and order with the positive swap. It opens positions with positive swaps after user-defined time and then closes these positions after user-defined time as soon as the specified profit is reached. The EA trades the current currency and instruments listed in the settings.
Expert Advisor Settings SymbolsList - l
FREE

Индикатор " AutoDiMA " рисует по графику в основном окне скользящую среднюю с динамическим периодом, рассчитываемым по стандартному индикатору " Average True Range (ATR) ". Когда " ATR " изменяется в диапазоне значений между верхним уровнем и нижним уровнем - тогда в заданном диапазоне меняется вариативный период скользящей средней. Принцип ускорения или замедления скользящей средней переключается в настройках параметром " FLATing ".
ВХОДНЫЕ ПАРАМЕТРЫ: - DRAWs : Количество баров для отображения
FREE

Introduction and Description
Colored candlesticks showing the trend based on two moving averages and the slope of the slow moving average. A trend is the overall direction of a market or an asset's price. In technical analysis, trends are identified by trendlines or price action that highlight when the price is making higher swing highs and higher swing lows for an uptrend, or lower swing lows and lower swing highs for a downtrend. Many traders opt to trade in the same direction as a trend, whil
FREE

고양이 추세는 정확하고 수익성있는 진입 신호를 가진 지속적으로 개선되는 지표입니다.
캣트렌드 브이지레터 라인은 트렌드 방향에 따라 색이 바뀌고,인디케이터는 가격 반전 포인트에서 화살표를 그립니다.
또한 고양이 트렌드 표시기는 화살표 모양에 대한 소리 및 텍스트 경고를 구현합니다.
중요:표시등이 다시 그려지지 않습니다.
고양이 트렌드의 주요 특징: 분석 기능
모든 통화 쌍 및 시간 프레임에서 사용할 수 있습니다; 표시기가 다시 그려지지 않습니다; 그것은 다른 지표에 큰 도움이됩니다; 입력 할 필터가 필요하지 않습니다; 그래픽 기능
차트의 최소 위치 수를 차지합니다; 유연한 팅크; 쉽게 배울 수;
고양이 트렌드의 주요 특징: 설정
길이 스무딩 깊이; 단계는 -100 내에서 변화하는 매개 변수입니다... +100,전환 프로세스의 품질에 영향을 미칩니다; 시프트-시간 축을 따라 표시기의 시프트; 입력 가격 세관-지표가 계산되는 가격 선택(0-"닫기",1-"열기",2
FREE

Break Even Line by MMD
The Break Even line is a useful indicator for people using strategies that allow simultaneous trades in both directions, such as the MMD methodology. This indicator is useful when playing statistical models and averaging positions in accumulation and distribution zones. The indicator draws levels by summing positions in three groups: positions included in BUY, positions included in SELL and all positions included.
Functionality description:
Show BUY BELine - shows or
FREE

Pivot Mean Oscillator (PMO) is a unbounded zero-centered oscillator that provides a quick and normalized measure of divergence between two spreads. Detailed description of the mathematical formulation along with some comments and experiments can be found in this article .
Trading aspects
This version of PMO is tuned on spreads relative to Close and Open price signals against their cumulative moving average (CMA). Positive PMO(m,n) values means that last (normalized) m Close prices are higher t
FREE
The NNFX ALGO TESTER is an tool designed to help the NNFX (No Nonsense Forex) traders develop, improve and test algorithms in a simpler, faster and more accurate way. This software reduces backtesting time from serveral days to only a few minutes! Please download the Demo instead of this Lite version. You can sill use the Lite but this version is now discontinued and it has much less functionality than the full version. The NNFX algo Tester software is too big (in terms of complexity) to be avai
FREE

This is the author's trading system.
Designed for intraday trading. Signals are not rewritten. Suitable for any instrument and timeframe. You can enable alerts. Easy to use. See screenshots. Simple settings! Everything has already been done for you! The basis is the analysis of the current trend. The indicator is looking for a way out of accumulation. If you have been looking for a good trading system for a long time, then it is in front of you! Subscribe to my telegram channel, where we discus
FREE

Introduction This Indicator Is Based On Average Price/Maximum Price Moves, And Using Moving Bollinger Bands And Moving Averages.
The Advantage Of Using It With YOUR own Analysis Will Confirm Potential Supports And Resistances While it Compliments With Your Analysis
The Indicator Is Non-Repainting
AND Along With Our Special Trend METRE that Changes With The Conditions OF A Bullish Or Bearish Trend....
Recommend Time-Frames: H1 H4 M15
Usage: The Indicator Is Very Profitable If Use
FREE
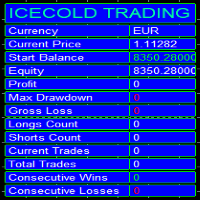
Icecold Trading OSD (On Screen Display) Is very Helpful and easy to use. Try Demo out today!
On Screen Display -Start Balance -Equity -Profit -Max Drawdown -Gross Loss -Longs count -Shorts count -Current Trades -Total Trades
*Know that in the Total Trades, Consecutive Wins & Consecutive Loss columns , those are ALL of the trades your account has done. It does not show 0 when loaded if you have completed trades already in Account History... Just note. To RESET just change Account history perio
FREE

This indicator is designed to detect the best divergences between price/MACD and price/RSI. MACD and RSI produce by far the best divergence signals therefore this indicator focus on those two divergences. This is the FREE version of the indicator: https://www.mql5.com/en/market/product/28375
Important Information How you can maximize the potential of the scanner, please read here: www.mql5.com/en/blogs/post/718074
The free version works only on EURUSD and GBPUSD! This indicator scans for you u
FREE

Free Scalping is a comprehensive manual system developed for the most efficient trading at any market conditions and time scale.
The system is based on two main blocks:
1. The block of trend determination that calculates dynamic support and resistance. The function of auto-optimization is available for this block.
2. The block of price deviation from its median based on the big set of regressions to get the statistically-valid result. Entry rules For buys:
1. The trend goes up
2. The price i
FREE
~*~*~*~* ~* ~* ~* ~* ~* ~*
*2023/07/19 Ncon1.91公開しました。 ~*~*~*~* ~* ~* ~* ~* ~* ~*
**************************************************************************************
ストラテジーテスターでトレードの練習を出来ます。 デモ口座でトレードの練習を出来ます。 動作保証はありません。 利益を保証するものではありません。
如何なる損失をしたとしても使用者の自己責任となります。
機能によってストラテジーテスターとデモ口座のどちらかで動かないものもあります。
**************************************************************************************
::主な設定項目:: マジックナンバー コメント 通貨ペア同期 コントロールボタンロック
ミニコントローラー ロットサイズ自動計算 リスクパーセント自動計算
最大ポジション数 最大スプレッド
FREE

FREE

The EA monitors positions for selected pairs, sets a break-even level and moves a trailing stop. When the trade is "n" points of profit (parameter dist_BEP), the stop loss is moved to the break-even point (the level of the trade opening price) plus the specified distance in points (parameter BEP) The EA checks all available (or filtered) trades for break-even and moves stop-loss levels if necessary. The EA also checks all available (or filtered) trades for trailing stop conditions and, if neces
FREE

The indicator represents 4 moving averages, shifted back. Created, like any moving average indicators, in order to see the approximate balance of volatility and the number of bulls and bears. The difference from other Moving Averages is that an attempt is made here to bring the moving averages of different periods to a common denominator, respectively, to bring the number of traders trading on different timeframes to a common denominator. The indicator is distributed as is.
MnojitelMA1, Mnojit
FREE
Machine translation of the following: This indicator is used to close or open the price and time scales.Select true to display scale and false to close scale.After the price scale is closed and then opened, it may show that it is not at all. But it can be solved by switching time cycle.This indicator has two tags, D and P, which can be opened or closed in real time by clicking.The related parameters can be modified by user, such as the name, position and coordinates of the label.
FREE

Trend easy простой трендовый индикатор в виде гистограмы. окно индикатора разделено на две части верхняя гистограма движение в бай, нижняя гистограма движениие в сел. Кроме гистограмы, сигнал индикатора дублируется на графике стрелками. В меню индикатора имеется количество баров в истории индикатора
значения периода для определения тренда разрешение рисования стрелок на графике код и цвета стрелок алерты и отступ стрелок
FREE

#########################################################################################
WeekendGap EA opens pending orders in the first hour of the beginning of a new week. It trades the weekend gap. The pending orders are cancelled within 2 days if not caught. WeekendGap works on most currency pairs, but you may limit yourself to the majors. The lot size is increased automatically based on the MinimumLots, MaximumRisk and DecreaseFactor. #######################################################
FREE

This indicator is an utility for have always under control, how much time is left at the end of the bar setted.
The utility show on the lower right of the chart, the countdown to the end.
When the remaining seconds is = to the seconds set in the input, the color of remaining seconds on chart, change color and play a warning sound to warn you that the bar is about the end. When the remaining seconds is < to the seconds set in the input, the utility play a beep to warn you that the bar is in co
FREE

This Expert Advisor will change how you manage your risk forever.
The EA automatically calculates your position size by either looking at your balance or equity. You need simply type in how much risk you want to have on that particular trade, move your TP line and SL line and it does the rest. Click buy or sell and it enters the position and places your TP/SL for you. It does the same thing for pending buy limits or sell stops. Feel confident knowing your risk before entering your trade! Most
FREE

Do you use dynamic ranges (like Bollinger Bands or Envelopes) in your trading? A fixed period is usually used for such calculations. But is such approach relevant to the very nature of the market? In fact, the price chart consists of a series of successive processes - trends and flats. In this case, we can talk about the internal development logic inside a single process only. Therefore, the nature of the market is better described by dynamic ranges designed for the processes occurring "here and
FREE

Description This scanner uses 3LZZ TRO ex4 and scans for Semafors at given “Shift” bar.
Scanner Detailed Settings: https://www.mql5.com/en/blogs/post/747456
Other Settings: Set Periods for Semafor 1,2,3 Set alerts on/off for Semafor 1,2,3 Shift bar (Bar on which semafor is scanned) Refresh After Ticks (Number of ticks when dash is refreshed) This scanner is pretty simplistic version. And a more detailed version with a different strategy is available here: https://www.mql5.com/en/market/product
FREE

This script can generated a text file including Account information such as Account Number Account Name Account Leverage Account Balance MT4 Location Data Folder Location Demo / Real Account Stop Out Mode Stop Out Level etc. Enjoy the script. Please leave a comment or send me an email if you have any idea. The Script is developed by Steve Wan (Eamil: fxac01@gmail.com)
FREE
StrxInfoPanel is an essential tool for every trader It gives you an immediate idea about your account and realtime informations about the current symbol and timeframe you are analyzing Every information line can be hidden and shown via parameters, even panel position can be changed via input parameters Parameters list: Corner : the screen corner where you want the panel to be shown Left, Top, and Width : customizable position and panel dimensions BgColor : background color Show XXX : every infor
FREE

The indicator is based on a single Moving Average of a user-defined period. By analyzing the price movement of the price relative to this MA, and also by tracking all updates of the price Highs and Lows over the same period as the MA period, the indicator draws its own picture of the trend, avoiding the ever-breaking MA lines. Therefore, if the trend goes up, the line will also point upwards and will not change its direction even on small retracements, allowing to capture almost the entire trend
FREE

AR Canada is a fully automated trading robot optimized for USDCAD H1. This free version trades only a fixed lot with minimum volumes. No hedging, no martingale, no grid, no arbitrage, etc. The EA applies the trading algorithm based on crossing the moving averages. Take Profit and Stop Loss values are fixed and have a ratio of 1:4. Positions are closed by the EA when Take Profit or Stop Loss level is reached.
Parameters MagicNumber = 3 - unique EA magic number.
FREE

This expert is a utility to help any trader to find the right lot size according to the risk he wants to take. It calculates the lot size based on account equity and added stop loss.
The utility can't to open or close position.
Attach the expert in the same symbol as the one you want to open position.
PARAMETERS LossPips - Stop loss in pips for your position. RiskPercent - Risk of equity you want to get.
FREE
Советник "Stochastic and MA_filter" торгует по индикатору "Stochastic Oscillator", используя фильтр в качестве двух средних скользящих, по желанию Пользователя применяется мартингейл (количество умножения лота при серии убытков ограничивается), безубыток, трейлинг стоп, инвертирование сигнала, возможно настроить, как скальпирующий советник.
Для каждого валютного инструмента необходимо подбирать настройки. Настройки советника: Индикатор Stochastic Oscillator: Kperiod=5; период линии K Dpe
FREE

Overview The script displays information about the trade account: Account - account number and type (Real or Demo); Name - name of the account owner; Company - name of a company that provide the access to trading; Server - trade server name; Connection State - connection state; Trade Allowed - shows whether trading is allowed on the account at the moment; Balance - account balance; Equity - account equity; Credit - amount of credit; Profit - profit size; Free Margin - free margin on the account;
FREE

Close All SELL Orders for MT4 script - closes absolutely all orders, whether pending or market ones.
Orders are closed at the current profit/loss indicators at the time of closing.
The script is suitable for moments when you need to quickly close all orders at the current indicators.
The script is very easy to use, just drag the script onto the chart and it will do its job.
Add me as a friend, I have many other useful products.
FREE

iRSI in iMA is indicator to change color in iMA if iRSI crosses level up (up trend) or crosses level down (down trend). It is a useful tool to track when the upside and the downside iRSI on iMA.
You can to get source code from here.
Parameters MA_Periods — Period for iMA. MA_Method — Method for iMA. RSI_Periods — Period for iRSI. RSI_ApliedPrice — Price used for iRSI. RSI_LevelsUp — Level iRSI for up trend. RSI_LevelsDN — Level iRSI for down trend. BarsCount — How many bars will show the line
FREE

Lord Info is an indicator for the financial market on the META TRADER 4 platform.
You can place Lord Info on any stock / currency pair on your platform.
Lord Info is able to show us the ATR report for the last (10) days or configurable, where we can see the base volatility of the pair, and its consequence.
The average true range (ATR) is an indicator of market volatility used in technical analysis. It is typically derived from the 14-day simple moving average from a series of real-range indi
FREE

LOOK AT THE FOLLOWING STRATEGY WITH THIS INDICATOR. Triple RSI is a tool that uses the classic Relative Strength Indicator, but in several timeframes to find market reversals. 1. ️ Idea behind the indicator and its strategy: In Trading, be it Forex or any other asset, the ideal is to keep it simple, the simpler the better . The triple RSI strategy is one of the simple strategies that seek market returns. In our experience, where there is more money to always be won, is in the marke
FREE

This is the Free Version of "Just Copier Pro MT4" (Please check : https://www.mql5.com/en/market/product/34472) This free version is available to be used within 2 hours only, and it has limited features. Please also check this product at fxina.hostingerapp.com.
If you want to share your trading signal, but you dont want to distribute your investor password, this product is fit with you. "Just copier Pro" is designed to copy trading without any complicated settings. The copy can be done in o
FREE

Indicators are professional data statistics, position orders, historical order analysis->>>>>> <This version is in Chinese -> English version please move> Necessary for traders: tools and indicators Waves automatically calculate indicators, channel trend trading Perfect trend-wave automatic calculation channel calculation , MT4 Perfect trend-wave automatic calculation channel calculation , MT5 Local Trading copying Easy And Fast Copy , MT4 Easy And Fast Copy , MT5 Local Trading copying For DEMO
FREE

Simply Parabolic SAR EA is an expert advisor that places orders in favor of the trend changes of the "Parabolic Stop And Reverse" indicator, placing its take profit, stop loss and trailing stop. You can see more of my products here: https://www.mql5.com/en/users/joaquinmetayer/seller
Inputs: Lots TakeProfit in points StopLoss in points TrailingStop distance in points Step PSAR Max PSAR
FREE

Information panel displaying traded lots for pairs, as well as the minimum margin level and maximum drawdown. The info panel will be indispensable when calculating the affiliate program and expert advisor tests. In the settings, you can add up to 10 of your favorite pairs, customize the panel display colors and its location. Check out my other products, maybe they will be useful to you.
FREE

MayaTradeManager is a pure & 100% manual trade orders management. MayaTradeManager doesn't have any indicators or signals to be used together since all trades are done by the user only. MayaTradeManager is an good tool usually for whoever that has a signal at the user disposal but don't have the one-stop-center to manage their trades conveniently. MayaTradeManager brings all of the trades management into one simple panel in a very convenient way.
Just a quick note Lot size box is an editable bo
FREE
StatBar 1.6 Indicator showing balance, earnings for today, yesterday and the day before yesterday. The indicator also shows: - Server; - GMT; - Server time; - Shoulder; - Spread.
Description of variables: extern int Magic = "-1"; // Magic for statistics -1 = all 0 = manual extern string Symboll = "-1"; // Symbol for statistics -1 = all 0 = current EURUSD = for EURUSD
FREE
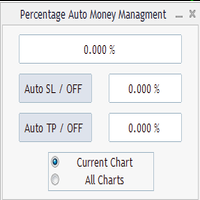
Percentage Auto MM sends automatic orders to close all positions immediately after reaching percentage SL/TP target, set by the User . Orders will be sent if the market is open and the SL / TP application buttons are pressed ( they can be used separately or together ) . It could be applied for current chart/all charts, depending on selected option. It works independently of SL and TP order settings for individual positions. SWAP, Commision can be also included ( look at input options ).
Atte
FREE

RaysFX Market Trend Histogram Il RaysFX Market Trend Histogram è un indicatore personalizzato per la piattaforma di trading MetaTrader 4. Utilizza il Commodity Channel Index (CCI) per identificare le tendenze del mercato e visualizza queste informazioni in un istogramma intuitivo. Caratteristiche principali: Identificazione delle tendenze: L’indicatore calcola il CCI per ogni periodo di tempo e lo utilizza per determinare se il mercato è in una tendenza al rialzo o al ribasso. Visualizzazione in
FREE
This indicator allows to hide Bollinger Bands (on all MT4 timeframes) from a date define by the user, with a vertical line (Alone) or a panel (with "Hidden Candles"). Indicator Inputs: Period Deviations Shift Apply To Color Style Width Information on "Bollinger Bands" indicator is available here: https://www.metatrader4.com/en/trading-platform/help/analytics/tech_indicators/bollinger_bands ************************************************************* Hey traders!! Give me your feeds! We are
FREE

Most of brokers make slippage for your orders (stop orders or market orders). When you make limit orders (Buy or Sell), they don't make slippage for you. Because it is for your advantage. This EA will resolve limit slippage problem for you with any brokers. Slippage Problem Example: The price now is 1.31450, you put sell limit at 1.31500. If the price jumps to 1.31550. The Broker will execute your sell limit at 1.31500 NOT 1.31550. If you put buy stop, the Broker will execute it at 1.31550 (or m
FREE

Waddah Attar Mini Close Graphical Panel EA .
This EA does not Trade with built in Strategy .
It is shows you your orders information in a table mode . You can close any group of your orders with mouse click . The table contain : Type : Buy + : means all buy profit orders . Buy - : means all buy loss orders . Sum : means all buy orders .
Sell + : means all sell profit orders . Sell - : means all sell loss orders . Sum : means all sell orders .
Total : means all orders . North : means all or
FREE
MetaTrader 마켓은 거래 로봇과 기술 지표들의 독특한 스토어입니다.
MQL5.community 사용자 메모를 읽어보셔서 트레이더들에게 제공하는 고유한 서비스(거래 시그널 복사, 프리랜서가 개발한 맞춤형 애플리케이션, 결제 시스템 및 MQL5 클라우드 네트워크를 통한 자동 결제)에 대해 자세히 알아보십시오.
트레이딩 기회를 놓치고 있어요:
- 무료 트레이딩 앱
- 복사용 8,000 이상의 시그널
- 금융 시장 개척을 위한 경제 뉴스
등록
로그인
계정이 없으시면, 가입하십시오
MQL5.com 웹사이트에 로그인을 하기 위해 쿠키를 허용하십시오.
브라우저에서 필요한 설정을 활성화하시지 않으면, 로그인할 수 없습니다.