适用于MetaTrader 4的免费EA交易和指标 - 23
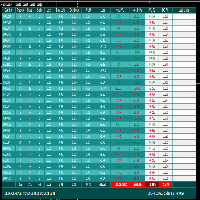
FCK Trade Report This indicator was developed by Fx Candle King. BEFORE CHOOSE CUSTOM PERIOD, GO TO TERMINAL WINDOW (ctrl+T), right click on ACCOUNT HISTORY and CHOOSE ALL HISTORY. This report searches the filtered data in your ACCOUNT CURRENT & HISTORY TRADE, Select your timespan for the report open and closed trades etc... Chose the report type - List only OPEN orders / List only CLOSED orders / List both OPEN and CLOSED orders
FREE
This EA opens orders based on trends. It sets a stop loss (SL) when the price moves negatively and a take profit (TP) when each order becomes profitable. The EA has a Martingale-like behavior, and it appears that SL might not always be set if the conditions aren't fully met. Users should be prepared for potential account wipeout, but the advantage is that the starting capital is only $1000. You can use this EA to work towards recovering your initial investment, then let it continue running. The
FREE

A reversed engineered and improved version of the extremely popular AFSID scalper ( afs-id.com ). Includes re-modeled versions of these 2 well received scalping programs: " AF-Fibo ", and " AF-TrendKiller". Take note that this is a high risk scalper Though improvements have been made to mitigate some of the risks, the risks inherent to martingale scalpers still exists, so use it at your own risk.
afsida Scalper (improved AFSID)
This is a simple martingale scalper which works on any pair (1
FREE

The Bullish and Bearish Engulfing Pattern Screener for MetaTrader 4 is a powerful tool designed for traders looking to identify key reversal patterns in the financial markets. This indicator scans price charts for bullish and bearish engulfing patterns, which signal potential trend reversals. Key Features: Real-time Scanning : Continuously analyzes price data to provide instant alerts when engulfing patterns are detected. Customizable Settings : Allows users to adjust parameters to fit their tra
FREE

This indicator is stand alone version from MP Pivot Levels (All in one) containing Demark's Pivots.
Calculations: PP = X / 4 R1 = X / 2 - LOWprev S1 = X / 2 - HIGHprev Uses: When the pair currency price may change the direction of movement. Possible constraints of support and resistance that creates plateaus for the currency pair prices. Tendency identification by comparing the present prices according to current day's pivot point and also the prior day's pivot points. ____________
FREE

概述:
彩色抛物线 SAR 指标 是一种视觉增强的交易工具,旨在简化趋势跟随和交易识别。这个可定制的指标通过图表上颜色编码的信号为多头(买入)和空头(卖出)趋势提供清晰的视觉提示,直接在您的 MT4 图表上显示。 主要特点: 颜色编码信号: 买入信号使用亮绿色 "o" 符号显示。 卖出信号使用红色 "o" 符号显示。 可自定义输入: 可调整的步长(Step)和最大值(Maximum)参数,用于精细调整抛物线 SAR 的计算。 可自定义线条宽度和颜色,以适应您的交易风格和图表外观。 简单且有效的可视化: 通过清晰的符号轻松识别多头和空头趋势,这些符号显示在价格蜡烛上方或下方。 让您一目了然快速评估市场状况。 兼容性: 支持所有 MT4 可用的交易品种和时间框架。 适合谁使用? 寻找将抛物线 SAR 简单集成到交易策略中的交易者。 适用于趋势跟随策略,或作为其他指标的确认工具。 输入参数: 步长(Step): 定义抛物线 SAR 的灵敏度(默认值:0.02)。 最大值(Maximum): 设置指标的最大值(默认值:0.2)。 线宽(Line Width): 调整绘制信号的线条厚度。 上涨
FREE

Free informative Indicator-helper. It'll be usefull for traders who trade many symbols or using grid systems (Averaging or Martingale). Indicator counts drawdown as percent and currency separate. It has a number of settings: Count deposite drawdown according equity value and send e-mail or notifications to user if DD more than set; Sending e-mail when max open orders reached; Shows price and remaining pips amount before MarginCall on current chart and Account generally; Display summary trade lot
FREE
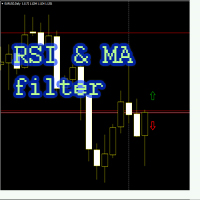
Советник "RSI and MA filter" торгует по индикатору RSI, использует фильтр в качестве двух средних скользящих (быстрая MA выше медленной MA - покупка, продажа - наоборот), по желанию Пользователя применяется мартингейл (количество умножения лота при серии убытков ограничивается), безубыток, трейлинг стоп, инвертирование сигнала. Настройки советника: Индикатор RSI: RSI_Period = 14; используемый период индикатора
RSI_Shift = 1; номер свечи выбранного графика, с которой советник берет сигнал, 0 -ор
FREE

The indicator My Big Bars can show bars (candles) of a higher timeframe. If you open an H1 (1 hour) chart, the indicator puts underneath a chart of H4, D1 and so on. The following higher timeframes can be applied: M3, M5, M10, M15, M30, H1, H3, H4, H6, H8, H12, D1, W1 and MN. The indicator chooses only those higher timeframes which are higher than the current timeframe and are multiple of it. If you open an M30 chart (30 minutes), the higher timeframes exclude M5, M15 and M30. There are 2 handy
FREE

the AK CAP toolbox free to use;
it includes the same indicators we use for our daily trading and we think the simpler the better. Lightweight indicator for use on all timeframes. that includes VWAP with vwap value indicator on top right. 3 EMA: FAST, MEDIUM, SLOW the candle timer to show how much time left in a candle.
colors and positions are fully customizable.
enjoy
FREE

Average daily range, Projection levels, Multi time-frame ADR bands shows levels based on the selected time-frame. Levels can be used as projections for potential targets, breakouts or reversals depending on the context in which the tool is used. Features:- Multi time-frame(default = daily) Two coloring modes(trend based or zone based) Color transparency
FREE
This indicator displays signals on the price chart based on the data of the classic indicator - the Money Flow Index (MFI). The volume is taken into account when calculating the MFI values. MFI can be used to determine overbought or oversold zones in the market. This indicator allows you to display three types of signals on the price chart: MFI exit from the overbought or oversold zone; MFI entry into the overbought or oversold zone; MFI crossing the middle between the overbought and oversold zo
FREE

Pivot levels is indicator showing 7 pivot levels. It is adjusted for major use, including: all standard time frames
choice of periods to show three popular calculation formulas (typical, median, weighted) 9 level Camarilla pivot
pivot day shift choice of properties for lines and labels choice of showing alerts when crossing pivot lines Parameters: ----------Main parameters----------- Timeframe - time frame for pivot levels
Number of periods to show - displays pivot levels for number of periods
FREE

Here is the provided text with line breaks:
This is the logic of a Forex EA.
This EA is very unique.
Normally, entries are made immediately based on overbought and oversold values of the RSI indicator.
However, this EA is different.
It is slightly modified.
It doesn't enter immediately once it becomes oversold.
Instead, it waits a bit after oversold conditions to see a reversal before entering.
The same theory applies to overbought conditions.
After it becomes overbought, it waits a w
FREE

Welcome to Gold Bloom World!
This forex robot, "Gold Bloom," is made for gold lovers around the world. The entry logic is sophisticated for the XAUUSD forex pair. The robot monitors the previous day's candle pattern and places a pending order in one direction. Take profit is determined by a trailing stop, while the stop loss is placed automatically based on the previous candle's price.
Simple input
Just enter initial lot size and set trailing stop.(points) For XAUUSD , please input points val
FREE

This is a simple Bollinger Band EA This works by activating a trade whenever the input parameters are met, including the Bollinger Band parameters The Bollinger Band Parameters determines when a buy or sell trade is opened: If the price is outside the lower bounds of the activated bollinger bands, a buy trade is opened (given that all other criteria are met) If the price is outside the upper bounds of the activated bollinger bands, a selltrade is opened (given that all other criteria are met)
K
FREE
LEADING AND LAGGING INDICATORS DASHBOARD https://www.mql5.com/en/users/earobotkk/seller#products P/S: If you like this indicator, please rate it with 5 stars in the review section, this will increase its popularity so that other users will be benefited from using it.
This dashboard scans all time frames(M1,M5,M15,M30,H1,H4,D1,W1,MN1) and shows up trend and down trend for MACD, PSAR, RSI, STOCHASTIC, MOVING AVERAGE, BOLLINGER BANDS by changing the colours of the relevant boxes. It also shows ca
FREE

Free EA for Trading EUR/USD on H1 Timeframe An easy-to-use automated trading system designed with risk management and beginner-friendliness in mind This Expert Advisor (EA) is created for traders who want to explore automated trading on the EUR/USD currency pair using the H1 timeframe . Whether you're just starting out or already have experience, this EA is designed to help you execute trades more consistently and with better control over risk. ️ Product Highlights : Completely Free to Downlo
FREE

简介:
此法则很简单,当一个交易单的浮动盈利大于某个数值时,会自动设置止损价到开仓价位。
设置说明:
Enter your order ID - 第一列的订单号
When Open Profit is over ($)_ , reset SL - 比如设置为100,意为当此交易单的未结利润达到$100时,自动设置止损价到此单的开仓价
注意事项及建议:
1. 请将此EA应用于活动订单,而不是待定订单。
2. 未结利润不应定得太小。
风险提示:
外汇/股票/大宗商品交易,尤其是杠杆交易有风险,交易请务必谨慎。
本法则的任何业绩结果均代表过去的业绩,并不是对未来业绩的保证。
本法则仅供学习交流使用,对于本法则造成的任何获利或者损失,本人不具有权力和义务。
FREE

The EU_H1_110155136_S_Bi_CF_SQ3 is an algorithmic trading strategy for MetaTrader, tested on EURUSD using the H1 timeframe from April 1, 2004, to April 24, 2024. There is no need to set up parameters, all settings are already optimized and fine-tuned.
Recommended broker RoboForex because of EET timezone.
You can find the strategy source code for StrategyQuant at the link: https://quantmonitor.net/eurusd-biggest-range-pulse/
Key details are:
Main Chart: Current symbol and timeframe Tradi
FREE

Are You Better than Monkey? Prove it...
The trade of this EA is based on random output with customizable lot size (use martingale or not), stop-loss, and take-profit levels. Easy to use and Simple Great for benchmarking tests against other EAs or manual trade. Works for ECN/Non-ECN brokers and 2-3-4-5 digit symbols Support us by open My recommended broker. Exness Tickmill robot monkey uses Adx trend filter for fair game no-trade unfavorable market ( you can turn off set adx = 0) . EA starts w
FREE
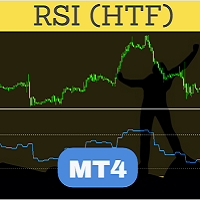
Perfected RSI (Relative Strength Index) HTF (Higher Time Frame) is perhaps the most advanced and reliable HTF indicator. Highly optimized in terms of execution, the indicator comes with standard settings of the RSI indicator which is supplied with the MT4 platform. Place the indicator on the chart, any timeframe. You may select a higher time frame in indicator inputs. The same indicator can be used on a chart multiple times to draw RSI from multiple timeframes or for different RSI period values
FREE
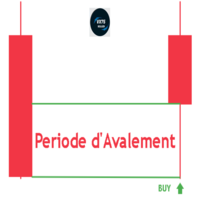
Engulfing Period V75Killed 指标(MT4)——精准掌控市场反转! (本指标为 私密 版本,仅供熟悉其价值的交易者使用。) Engulfing Period V75Killed 是一款适用于 MetaTrader 4 的强大工具,能够自动识别 多时间框架 下的 看涨(多头)和看跌(空头)吞没形态 ,并在图表上标出关键吞没区域,帮助交易者把握高概率交易机会。 主要功能: 多时间框架分析
支持 月线(MN)、周线(W1)、日线(D1)和4小时(H4) ,满足不同交易风格需求。 个性化显示
可自由调整颜色、字体、标签位置和大小,优化您的交易体验。 实时识别吞没形态
即时检测市场中的吞没信号,确保不错过任何交易机会。 新增十字星 & 锤子形态识别(v4.00更新!)
现在支持检测 十字星(Doji)和锤子线(Hammer) ,增强价格行为分析能力。 简单高效,操作便捷
界面简洁直观,无需繁琐的图表分析,即刻应用于交易决策。 为什么选择 Engulfing Period V75Killed? 节省时间 – 无需手动查找吞没形态,智能标记
FREE

本指标是根据黄金分割理论,分别获取过去22(默认)根K线高低价,并通过黄金分割系数计算得出支撑、压力曲线。 当价格第一次向上靠近压力线,或者多次靠近压力线时,会出现向下的箭头符合,提示有压力,适宜做空sell; 当价格第一次向下靠近支撑线,或者多次靠近支撑线时,会出现向上的箭头符合,提示有支撑,适宜做多buy; 在数据窗口,会提示各条支撑、压力线的价格数值,出现的箭头符合数值为up、down。
这个指标,适合在所挂的图表里做短线,也即进场开仓后,持仓几根K线柱,然后可以平仓。做多的话,止损可以在支撑线下方,止盈在压力线附近。做空的话,止损可以在压力线上方,止盈在支撑线附近。
本指标涉及的黄金分割系数分别为0.382、0.618、1.618、2.168、4.236,计算得到对应的支撑压力线。 由于MT4的指标数量有限,本指标分成了2个EX4文件,第一个的黄金分割系数为0.382、0.618、1.618,第二个为2.168、4.236,第二个文件名为“Golden Ratio Support Pressure Indicator extend”,可免费下载和使用。
FREE

Este indicador irá ajudá-lo a traçar as linhas do horizonte ( Marcelo Ferreira ) do Grafico semanal. Você poderá mudar trabalhar por exemplo em M5 ou M15. As linhas semanais permanecerão lá. Analisar as tendências em gráficos semanais antes de fazer uma entrada no mercado Forex é essencial para identificar a direção predominante do mercado a longo prazo. Esse tipo de análise ajuda a evitar decisões impulsivas baseadas em flutuações de curto prazo e fornece uma visão mais clara sobre o movimento
FREE
Simple SuperTrend indicator, similar to that of TradingView's.
Links: All-In-One Supertrend MT5 Version
It has buffers for buy and sell signal, if you want to integrate this into an EA.
It helps traders easily identify trends by providing clear buy and sell signals based on price movements. Designed for simplicity, it’s easy to use and integrates well with various trading strategies, making it a great option for traders of all levels.
Happy trading!
FREE

Three Sixty Dollar EA IC Market Recomment Broker
-THIS EA ONLY BUY
-only DE40 -minimum 3000$/€ ...Lot 1-5 -M1
-maximal 30min per Day Robot Worktime
Version 1 BUY only -this EA only BUY Trade only on the DE40 indices - Don't close trades the robot will close everything automatically on point. -The maximum working time of the robot is 30 minutes since the broker has a maximum of trading messages per day Test the trading news per day with your broker first with a demo account or read about it i
FREE

Looking for entry points along the local trend without repaint! Arrows indicate entry points. Based on classic indicators. The indicator is easy to use. Settings Наименование Описание Frequency factor Signal frequency. The less, the more often.
This affects the quality.
Recommendations Recommended for use on major currency pairs. Timeframe from m5, m15, m30 Subscribe to my telegram channel, where we discuss intraday trading, ideas, indicators, etc., a link in my profile contacts.
FREE

您是否希望将您的股票交易提升到一个新的水平?
凭借其智能算法和专家订单,您可以确保自己始终处于领先地位。 从上涨和下跌的市场中获利,轻松预测趋势,并保持投资组合的领先地位 - 有了 Stock Flow,一切皆有可能!
输入和输出订单由可以在任何 MT4 平台上找到的两个指标的组合给出:MACD 信号、动量指标和资金流量指标。
指标的周期和水平值以最佳组合进行调整,以获得最佳净利润。
它还包含止损和止盈,在波动性增加的时候提供资金安全。
Expert 测试了 2021 年 1 月 1 日至 2023 年 1 月的 GBPUSD M30 历史数据(在 MT4 上回测 2 年)。
请自行下载测试。
您还可以使用 Metatrader 4 平台中的优化功能来寻找更好的 EA 版本。
推荐:
ü MaxLotSize - 最大允许交易手数。 仅当您真正了解自己在做什么时才更改此参数。
ü TakeProfit - 以点数获利。
ü StopLoss – 止损点数。
ü EAMagic - EA 的幻数,它允许顾问仅使用其位置。 每个图表必须有不同的值。
ü 本E
FREE

Uses of EA - Trailingstop: Move stoploss continuously. - Breakeven: Move the stoploss once. Custom parameters: All OrderOpenTime: + true: acts on all order + false: only affect the order opened since EA run All OrderType: + true: acts on all order. + false: only the order is running (Buy, Sell) TraillingStop: true (Use), false (do not use) TrailingStop Save (Point) TraililngStop Distance (Point) BreakEven: true (Use), false (do not use) BreakEven Save (Point) Brea
FREE

The Sextet is an MT4 indicator that displays 6 levels of Moving Averages, where the second is the moving average of the first, the third of the second, and so on. It gives a signal when all the moving average levels align in order. Get a Free Sextet EA, and read discussions about using The Sextet Indicator on Forex Factory:
The Sextet EA @ Forex Factory Check out the The Sextet Scalper Pro for a more elaborate scalping strategy also with Free EA . Key Features: Is a Moving Average of a Movin
FREE
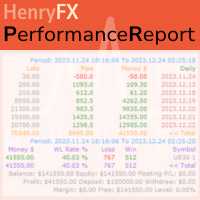
This Performance Report indicator is special design for some trader to analyst his/her performance.
FREE Version, included: - " Display Language "
- " Report Grouping "
- " Count Live Order "
- " Label Row Dis "
- " Label Font Size "
Performance Report Pro : : https://www.mql5.com/en/market/product/58287
Input Parameter: " Display Language "
:: [ English / Chinese ] Display language; " Report Title "
:: Show the report title as you want; " Report Grouping "
::
FREE

THE PRICE ACTION INDICATOR! This program finds candlestick absorption patterns and a false breakdown, after which it draws the entry points with arrows.
Input parameters:
1. PPR_Arrow The On parameter/Off display of the absorption model arrows. By default, it is set to true.
2. FB_Arrow Everything is the same as the first parameter, only for false breakdown models. By default, it is set to true.
Sincerely, Novak Production.
FREE
How To Trade
Execute your trades in 3 Easy Steps!
Step 1: Trade Setup Entry Buy in Signal Arrow color DodgerBlue. Entry Sell in Signal Arrow color RED. Success Rate ≥ 75% 100:25 Step 2: Set Stop Loss Stop loss BUY ----> You can set stop loss on Line RECTANGEL color DodgerBlue. Stop loss SELL ----> You can set stop loss on Line RECTANGEL color RED. Step 3: Set Take Profit Take profit BUY on RECTANGEL color RED. Take profit SELL on RECTANGEL color DodgerBlue. Strategy SIMPLE Day trading / Swing
FREE

Free version of BBarsio Expert Advisor, which is intended only for AUDCAD pair. Works with a fixed minimum lot ! The Expert Advisor uses a weighted scalping strategy.
Currency pair: AUDCAD.
Timeframe: M5-M15.
The advisor's strategy:
the advisor finds possible reversal / trend continuation points; filters out some of the false signals; entry into the deal with only one order !!! exit from a trade by take profit or by a signal of a possible reversal; Default settings for M5.
The Expert Advis
FREE

The indicator is designed for displaying the following price levels on the chart: Previous day's high and low. Previous week's high and low. Previous month's high and low. Each of the level types is customizable. In the indicator settings, you set line style, line color, enable or disable separate levels. The version of the exact same indicator but only with sound alerts there - Time Levels with Alerts .
Configurations ----Day------------------------------------------------- DayLevels - enable/
FREE

Discover our brand new trading robot, IT Fractals EA , a revolution in the world of automated trading. Our EA pushes the boundaries by utilizing the fractals indicator for exceptional performance.
Key Features :
Fractals Strategy : IT Fractals EA stands out by adopting an innovative strategy based on the fractals indicator. This clever approach allows you to pinpoint market reversal points with precision, thus identifying optimal trading opportunities. Advanced Management : Our EA comes equip
FREE

this indicator Construction on Gann angles and it,s very effective .you can use it as (Support and resistance)
it,s very successful and easy to use.if candle Cross through level thats mean price is going ti next level
but with on condition. The price cames from a previous level
There is a variable of angles for frames the best is 1h frame and stander variable.........
FREE

An “inside bar” pattern is a two-bar price action trading strategy in which the inside bar is smaller and within the high to low range of the prior bar, i.e. the high is lower than the previous bar’s high, and the low is higher than the previous bar’s low. Its relative position can be at the top, the middle or the bottom of the prior bar.
The prior bar, the bar before the inside bar, is often referred to as the “mother bar”. You will sometimes see an inside bar referred to as an “ib” and its m
FREE
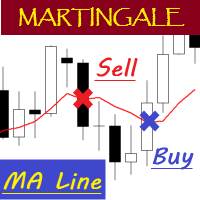
EA "MA Line" with martingale feature
To see how EA works, please watch the video below. In the video, I perform parameter optimization and do a backtest. The parameters that are optimized are: - MA Period - Stop Loss - Take Profit
For the future, I will try to optimize and test EA, especially the expert advisors in the mql5 community. hopefully it can be useful for colleagues in the mql5 community.
FREE

在您的平台上提供新版 MT4 标准指标的目的,是在子窗口里显示多时间帧的相同指标。参看下面例中的图片。 但是它的显示不像简单的多时间帧指标。它是指标在其时间帧的实际显示。 在 FFx 指标里提供了一些选项: 选择显示的时间帧 (M1 至 每月) 定义每个时间帧箱体的宽度 (柱线数量) 提示弹出/声音/邮件/推送 (RSI 穿进/出超买超卖 (OBOS) 区域) 直接在图表上激活/停用提示 修改所有颜色 ... 当然还有所有标准指标的常用设置 如何设置提示: 在弹出的参数设置 : 选择您希望的提示和模式 (弹出、声音、邮件或推送通知) 之后在图表上 : 选择铃铛图标 (双击) 然后将其拖拽到任意位置。在下一个报价来临,它将恢复它的原始位置,但用不同颜色信号改变它的状态。红到绿意为它现在已激活 … 绿到红意为它现在未激活。
FREE
Forex and Gold OBI is an innovative indicator based on a study of price and market dynamics, utilizing the RSI indicator. This indicator helps you find the best moment to enter the forex market by signaling when the market is in overbought or oversold conditions. Moreover, The indicator calculates two possible targets and the stop loss for each trade, allowing you to optimize your risk/reward ratio. Price This indicator is easy to use and set up, working with any currency pair and timeframe. If
FREE

EA Protrader Pivot is a automate and semi-automate Expert Advisor based on candlestick charts. Each order set stop loss with 200points and take profit 250 points. If one of two orders reach stop loss the new order open with new lot size (start lot is 0.01 and max lot is 0.08 ). This EA was backtested with XAUUSD in time frame M15 and spread 20 point. Automate - EA open buy and sell orders based on levels of candlestick chart with the first volume is 0.01 if this order touch stop loss EA cont
FREE
Search for an entry with low risk for trading by Lisek Moving Average Indicator. There are many ways to trade with Lisek Moving Average Indicator: Trend continuation (Trend trading). Trade pullbacks (Range trading). Trade breakouts. Trade reversals. Take profits or set stop-loss based on your MA.
Moving Averages are a frequently used technical indicator in forex trading, especially over 10, 50, 100, and 200 periods. Moving Averages are lagging indicators, which means they don't predict where p
FREE
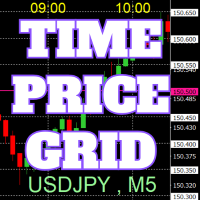
On the chart, draw grids for price and time at round numbers for easy reference.
"Parameter Input" allows for setting price intervals for each period. The grid lines for significant numbers (round numbers) are thicker and more prominent than other lines, making them easily distinguishable. The grid lines for significant numbers (round numbers) can be set to a different color than other lines. Colors at various points can be individually configured. Symbols and timeframes can be displayed, and t
FREE

This versions is free because a dangerous strategy is used.
If you want to see my full and best product (not dangerous), check it out : https://www.mql5.com/en/market/product/82662
I'm sharing with you a scalping strategy who is designed especially on GBPNZD timeframe M5 . Scalping GBPNZD is a scalper who is not spread sensitive. Scalping GBPNZD 's backtest is around 70% of winrate. Scalping GBPNZD is very easy to use. Scalping GBPNZD is using a dangerous strategy. Scalping GBPNZD is a
FREE

What is The Commitment of Traders (COT)? The Commitment of Traders (COT) report is a weekly publication of net positions in the future market that is released on Fridays by CFTC commission. It is an outline for the commitment of the classified traders as commercial traders, speculators (non-commercial traders), and non-reportable traders. We use this report to understand the dynamics of the market. The commitment of commercial traders is not important for us because they take a position to he
FREE

Trader Family EA use multiple custom indicators to determine entry orders and exits. Every order uses a pending order and always uses a take profit and stop loss with a risk reward of 1:1.5, everything is calculated automatically. This EA is suitable for beginners and advanced traders, this EA can be customized according to the risk profile of the trader himself. Requirements and Recommendations Trader Family EA specifically for the USDJPY pair on the H1 timeframe. ( will be optimized for other
FREE

Hello everyone,
Today I want to share with you a sclaping strategy who can works on many currency pair timeframe M1 .
Multicurrency Scalper is not a spread sensitive scalper . Multicurrency Scalper is an expert with a backtest around 67% of winrate . Multicurrency Scalper is very easy to use . Multicurrency Scalper do not use any dangerous strategy . Multicurrency Scalper can work on XAUUSD, EURUSD, GBPUSD, USDJPY, AUDCAD, EURCHF and many others.
This expert is free because results are variab
FREE
The ChannelSgnals Indicator for MT4 is an effective Forex trading tool designed to track market movements. The MT4 signal point indicator effectively detects trend reversals after they have already occurred. The ChannelSgnals Indicator is a fully automated technical tool that includes a number of parameters to track market trends. It automatically examines the ever-changing price dynamics of the market, compares the information with earlier data and generates a trading signal. Because the
FREE

NOTE!: The trend vote and the buy sell option shall match to the same direction before you put a trade!!
Indicator that uses Kalman filters (same as used on autonomous vehicles for data fusion between different sensors / technologies such as RADAR, LIDAR and Camera with Artificial Intelligence for object detection) by using the high and low price in order to identify buy and sell signals as indicated on the graph.
This indicator can be used on any timeframe with any currency or symbol.
This i
FREE

PLEASE HELP REVIEW/ SUPPORT/ SHARE THIS OTHER INDICATOR HERE https://www.mql5.com/en/market/product/51637 AS YOU DOWNLOAD THIS ONE FOR FREE. THANKS.
This Indicator is based on four moving averages and the PIVOT points. The indicator provides clarity to trading, especially in ranging markets when price is very slow and tight. You can trade intensively daily, every day with this indicator. You may decide to trade with this indicator alone and get the maximum out of the market. The indicator wa
FREE
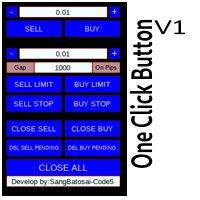
Simple button panel of trade on your chart with OneClick V1 Trial version. This trade panel will make it easier for you.
Equipped with several functions that make it very easy for you. More tools on OneClick VZ version, see here.
This version includes: Open Order Buy Open Order Sell Open Pending Order [Buy Limit - Buy Stop - Sell Limit-Sell Stop] Close ALL orders
Close Order Buy Close Order Sell Delete Pending Order [Buy Limit - Buy Stop - Sell Limit-Sell Stop] ENJOY IT!!! ONE CLICK V1 [TRIAL
FREE

A powerful trend analysis tool for traders of all levels Super Trend Analyzer is a technical analysis tool that uses the Relative Strength Index (RSI) and Moving Average (MA) indicators to identify trends in the market. It is a versatile tool that can be used by traders of all levels of experience.
How does it work An uptrend begins when the main trend line and the auxiliary trend line cross from below and the lower minor oscillator is on the rise. A downtrend begins when the main trend line an
FREE

RaysFX Trade Info Ciao a tutti, sono entusiasta di presentarvi il nostro ultimo indicatore, RaysFX Trade Info . Questo strumento è stato progettato per fornire informazioni dettagliate sulle vostre operazioni di trading direttamente sul vostro grafico MT4. Caratteristiche principali Informazioni in tempo reale : RaysFX Trade Info fornisce informazioni in tempo reale sulle vostre operazioni aperte e chiuse. Potete vedere il profitto in punti, in valuta e in percentuale. Personalizzabile : L’in
FREE

FOREXBOB AUTO CLOSER is a very handsome tool for manual traders who doing :- Scalping Correlation Hedging Those who use averaging methods etc. As this utility tool will help you by closing all your running trades when the universal floating P/L reaches a certain value that you will put in inputs. You may enable and disable the alert message on your mobile phone when auto closer close all the running deals on specified profit. You may add any message you want in notification. This tool consid
FREE

一键平仓:高效的交易管理工具 产品描述 一键平仓是一款功能强大且易于使用的交易助手,旨在提升您在 MetaTrader 平台上的交易效率。通过简单直观的界面,您可以快速管理所有仓位,轻松应对市场变化。 主要功能 一键平多头仓位 :瞬间关闭所有多头持仓。 一键平空头仓位 :快速关闭所有空头持仓。 一键全平 :一键关闭所有持仓,省时省力。 一键平盈利单 :关闭所有当前盈利的仓位,锁定收益。 一键平亏损单 :关闭所有当前亏损的仓位,控制风险。 一键平挂单 :立即撤销所有未成交的挂单。 中英文切换 :支持中英文界面,自由选择使用语言。 为什么选择一键平仓? 高效快捷 :无需逐一操作,批量管理仓位,提高交易效率。 简单易用 :友好的用户界面,适合新手和专业交易者。 灵活控制 :根据需求选择平仓类型,更好地掌控交易策略。 风险管理 :快速应对市场波动,及时调整仓位。 提升您的交易体验,立即下载一键平仓!
FREE

Having trouble marking where the various forex sessions start and end? Or perhaps your strategy requires you trade only in a specific session, then this is for you.
The session indicator shades the session you require in a certain color so that you can identify it easily. The sessions shown include: London session, New York session, Asian Session, Asian - London overlap and London - New York Overlap.
Difference source give varying time ranges for the various session, mostly differing by not mo
FREE

TimeBar TimeBar 是一個簡單的資訊指示器,顯示柱關閉之前的剩餘時間,以及柱打開以來經過的時間和當前時間。 為了便於感知,增加了兩種顯示方式:以圖形左上角註釋的形式,或以圖形物件的形式。
優點 字體選擇 字體大小。 您可以設定任何一項。 評論的時候太小了 您可以移動物體。 雙擊滑鼠可以選擇任何時間並移動到圖表上的任何位置,它將照常繼續更新 視覺警報。 您可以設定指定的秒數,直到目前柱關閉,達到該時間後,時間將變成設定中指定的警告顏色 設定 選擇顯示的時間 每次的顏色(對於圖形物件) 一則警報,通知您酒吧即將關閉 使用 TimeBar 指標作為您交易系統的補充
使用連結嘗試我在市場上的其他產品 https://www.mql5.com/ru/users/capitalplus/seller
FREE

Are you ready to take your trading game to new heights? Introducing Quantum Fx, the ultimate Expert Advisor designed to enhance your trading strategy and maximize your profit potential in the forex market. In this groundbreaking video, we unveil the remarkable features and benefits of Quantum Fx, empowering you to trade with confidence and precision. Whether you're a novice trader or an experienced investor, this EA is tailored to cater to your unique trading goals. Key Features of Quantum Fx: A
FREE

Unlock Your Trading Potential with Our Smart and Advanced EA!
Unleash the power of our high-tech Expert Advisors to refine your trading strategy and supercharge your overall performance. Witness maximum profit potential and minimized risks. Our EAs seamlessly integrate with various account types and trading platforms. Enjoy the flexibility to incorporate our EA into your existing strategy without any hassle.
Tap into the potential of artificial intelligence for market analysis. Our EAs con
FREE
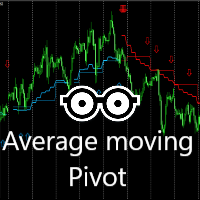
该指标对于每天交易非常有效。
结合移动平均线和2X轴点计算,每天都能产生令人信服的信号。
蓝色表示购买机会。 按照箭头可能的购买点。 蓝色枢轴和平均线是可能的支撑。 红色表示卖出机会。 按照箭头可能的卖点。 红色枢轴和平均线是可能的阻力。 最好在15分钟,30分钟或1小时的时间范围内使用。
Gāi zhǐbiāo duìyú měitiān jiāoyì fēicháng yǒuxiào.
Jiéhé yídòng píngjūn xiàn hé 2X zhóu diǎn jìsuàn, měitiān dū néng chǎnshēng lìng rén xìnfú de xìnhào.
Lán sè biǎoshì gòumǎi jīhuì. Ànzhào jiàntóu kěnéng de gòumǎi diǎn. Lán sè shū zhóu hé píngjūn xiàn shì kěnéng de zhīchēng. Hóngsè biǎoshì mài chū jīhuì. Ànzhào jiàntóu kěnéng de màidiǎn. Hóngsè s
FREE

Never miss a trend change again! This indicator uses various calculation methods based on price action to detect changes in the direction of the trend. It can be used on high timeframes (from H1 to D1) and is most suitable for H4 and Daily timeframe. This indicator is compatible with all broker symbols (forex, indices, CFD, commodities, crypto…). It is also possible to open the indicator on several charts to follow several symbols at the same time. In addition, you don't have to stand by your P
FREE
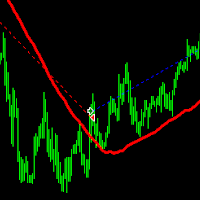
This expert advisor is very simple and easy to understand, it is based on the single Moving Average. The indicator settings is fully customized.
Recommended Pairs: - EURUSD - GBPUSD - AUDUSD - NZDUSD Expert Advisor Inputs: - Timeframe : Default value = current - Ma_Period : Default value = 50 - Ma_Method : Default value = MODE_SMA - Ma_Applied_Price : Default value = PRICE_CLOSE - Ma_Shift : Default value = 10 - Shift : Default value = 0 - Buffer_Candle : Default value = 1 - Auto_Lot : De
FREE

This is a multitimeframe RSI indicator defining trends, oversold/overbought zones, as well as all intersections of signal lines from different timeframes on a single chart using arrows and audio alerts. When working with standard RSI, we often need to examine data from all necessary timeframes simultaneously. RSI 7TF solves this issue. If you are only interested in audio signals when signal lines are crossed, then have a look at RSI Alerts . Attention! The indicator uses seven timeframes - M5, M
FREE

️ Ultimate Account Protection for Serious Traders
The Equity Protector Pro is a professional-grade safety system that automatically safeguards your trading capital using advanced multi-level profit protection logic. Designed for traders using any strategy (manual or automated), this EA acts as your 24/7 risk manager to lock in gains and prevent account blowouts. Key Features:
3-Stage Protection System Level 1: Base equity floor protection Level 2: Dynamic trailing stop Level 3:
FREE

Circuit Expert Advisor. EA uses arbitrage system of entering both direction of the market. In addition EA has built in Filter Engine for triggering the trades. All trades covered by fixed Stop Loss & Take Profit. No Grid, No Martingale, Works with high spread. This EA operates only once per bar opening. Fast methods of strategy testing and optimization are valid. User can test / optimize by model: (control point) / (open prices only) developed, tested and optimized on " Vantag
FREE

GMMA indicator that looks like a cloud. The GMMA indicator is easy to read, but to make it even more visually pleasing, we made it look like an Ichimoku Chart cloud. Colors have been changed where short-term and long-term overlap.
My other products https://www.mql5.com/ja/users/studiotam/seller
Please reduce the character limit a bit. I have nothing more to write.
FREE

This is my First Project to create EA. Simple MA Cross Fast and Slow with additional High Time Frame Filter. You can set manually to get optimum Result. It's suit for swing Trader that Trade on High Time Frame. ex. H1 / H4 with D1 Filter. Or you can modify It that follow your strategy.
Give me good feedback to improve for better version. Cheers!!
Hurry up FREE download for Limited Time!!
Please test It on Demo account or strategy tester before applied on Live Account
FREE

The indicator rely on The Toby strategy >> The mother candle which is bigger in range than the previous six candles.
A vertical line shows the last Toby Candle with the targets shown up and down. The strategy is about the closing price out of the range of the toby candle to reach the 3 targets..The most probable to be hit is target1 so ensure reserving your profits and managing your stop lose.
FREE
MetaTrader 市场 - 在您的交易程序端可以直接使用为交易者提供的自动交易和技术指标。
MQL5.community 支付系统 提供给MQL5.com 网站所有已注册用户用于MetaTrade服务方面的事务。您可以使用WebMoney,PayPal 或银行卡进行存取款。
您错过了交易机会:
- 免费交易应用程序
- 8,000+信号可供复制
- 探索金融市场的经济新闻
注册
登录