适用于MetaTrader 4的免费EA交易和指标 - 15

The indicator looks for market Highs and Lows. They are defined by fractals, i.e. the market creates the indicator algorithm and structure, unlike ZigZag having a rigid algorithm that affects the final result. This indicator provides a different view of the price series and detects patterns that are difficult to find on standard charts and timeframes. The indicator does not repaint but works with a small delay. The first fractal level is based on the price, the second fractal level is based on t
FREE

!!!在 [CodeBase] 中,我发布了 Mql4 指标代码。免费下载代码!!! (您必须在更新终端时调整代码)。
该指标是交易者的工具。它显示了所有周期和符号上的随机指标的运动:М1, М5, М15, М30, Н1, Н4 每分钟(从当前到 -240 分钟的时间尺度,即过去 4 小时)。
Step_Stoch 克服了随机指标的缺点——滞后。例如,在 H1(或 M30)下跌后的上升可以在 H1 的 60 分钟后或 M30 的 30 分钟后在通常的随机指标上看到。该指示器会在一分钟内显示此信息,让您获得更好的结果。
您可以将所有随机指标组合在一起并分析它们的走势,以立即做出最佳交易决策,这可能会导致在关闭交易时损失利润或延迟开盘,此时利润(大部分)的可能性已经丧失. Step_Stoch 线可帮助您更快地看到趋势反转过程的开始。
该指标会自动调整为 4 位和 5 位报价、屏幕 DPI、图表的时间刻度。
输入值
KPeriod, DPeriod, Slowing, Mode_, - 标准随机参数。
ColorBack - 背
FREE

Emulate TradingView drawing experience with magnet snap to the nearest price.
Supported drawing tools: Vertical Line Horizontal Line Trend Line Horizontal Ray (Angle Trend Line) Fibonacci Retracement Rectangle
Input:
Threshold (px) : The distance in pixel unit to snap the crosshair to the nearest price.
Feel free to write the review, request more features or report bugs.
FREE
WONNFX iN M5 - Arrow indicator for Forex and Binary Options. Reliable signal algorithm. Indicator not repaint. Indicator working hours: 21:55-23:00. GMT+2. Average winrate = 60-70%.
Recommendations: Timeframe: M5. Expiration: 2-3 candles (1 candle = 5 minutes) Symbol: EURUSD, USDJPY, EURAUD, GBPAUD, EURJPY, AUDUSD, USDCAD, NZDUSD, AUDCAD, AUDCHF, AUDJPY, AUDNZD, CADJPY, EURCAD, EURGBP, GBPUSD, GBPCAD, NZDJPY, CADJPY, XAUUSD
FREE

please leave 5 stars to me A support level is a level where the price tends to find support as it falls. This means that the price is more likely to "bounce" off this level rather than break through it. However, once the price has breached this level, by an amount exceeding some noise, it is likely to continue falling until meeting another support level. A resistance level is the opposite of a support level. It is where the price tends to find resistance as it rises. Again, this means t
FREE

Concept
Crypto Trend is a system that identify the safest cryptocurrency price trends.
This system is focused on a long-term stable growth .
It does not need to be constantly updated as it adapts naturally to varied market conditions.
No martingale, no grid, no hedge, no other dangerous strategy. Only strict rule-based approach to trading, allowing to maximise return while having risks under control . As a free version, this EA just opens sell orders and the lotsize is limited to 0.01.
FREE

VR Assistant Charts 是交易者在 MetaTrader 交易终端窗口中处理图形对象的便捷工具。该程序允许您一键单击鼠标即可更改 MetaTrader 终端中趋势线、斐波那契水平、江恩扇形和其他图形元素的颜色、样式、粗细和其他特征。 设置、设置文件、演示版本、说明、问题解决,可以从以下位置获取 [博客]
您可以在以下位置阅读或撰写评论 [关联]
版本为 [MetaTrader 5] 该实用程序极大地简化了交易者使用图形对象分析金融工具的单调工作。所有操作均使用计算机鼠标直接在图表上执行。该程序以 MetaTrader 4 和 MetaTrader 5 交易平台的技术指标的形式实现,这使得它可以与其他指标、顾问和脚本同时使用。 使用计算机鼠标进行控制: 通过点击趋势线可以打开属性,点击图表则隐藏图形对象的属性。使用对象属性,交易者可以将光束设置为左侧或右侧,更改颜色、样式、宽度,添加或删除多级对象(例如斐波那契和江恩)中的级别。 该指标的开发是为了减少交易者在标记图表时的操作次数。该实用程序对于初学者和专业人士都很有用。 由于交易平台 MetaTrader 4 和
FREE

Augment is an EA designed to take advantage of sharp movements in the market. Using an array of approaches, including candlestick ranges, the EA is designed for turbulence. Aside from using candlesticks as part of its entry, Augment has the ability to determine the best price action levels that a martingale system can be the most efficient. The EA has been programmed for the market conditions from 2017 to current day. To use this EA, it is recommended to have a starting balance of $3,000 per .01
FREE

Mega Alert Level : A Simple yet Invaluable Indicator This assistant delivers sound, informational, push, and email notifications of your choice when the currency pair's price touches or approaches standard support and resistance levels or any other objects on the chart that you select. The indicator attaches to horizontal support and resistance lines or any other objects on the chart that you choose, plotted on the chart using the terminal's standard tools. In the settings window, you only need
FREE
POSITION SIZE CALCULATOR EASY As the name suggests it is the most easy-to-use position size calculator available on the market. this indicator calculates the lot size within a fraction of a second and the best part is that it is very flexible and easy to use. you can use money or percentage to calculate the lot size. you can use equity or balance to calculate the lot size.
FREE
Highly configurable Trader Dynamic Index (TDI) indicator.
Features: Highly customizable alert functions (at levels, crosses, direction changes via email, push, sound, popup) Multi timeframe ability (higher and lower timeframes also) Color customization (at levels, crosses, direction changes) Linear interpolation and histogram mode options Works on strategy tester in multi timeframe mode (at weekend without ticks also) Adjustable Levels Parameters:
TDI Timeframe: You can set the lower/higher
FREE

This indicator calculates and draws lines over the chart. There are two types of trends: Trend A: the line is drawn using local lows for uptrends and local highs for downtrends Trend B: the line is drawn using local highs for uptrends and local lows for downtrends There are a few conditions, which have to be fulfilled and can be changed by the parameters (see also picture 4): MinBarAge : the count of bars to the last base point of a line is called BarAge and has to be greater than the parameter
FREE

The indicator is designed for displaying the following price levels on the chart: Previous day's high and low. Previous week's high and low. Previous month's high and low. Each of the level types is customizable. In the indicator settings, you set line style, line color, enable or disable separate levels. The version of the exact same indicator but only with sound alerts there - Time Levels with Alerts .
Configurations ----Day------------------------------------------------- DayLevels - enable
FREE

Lord Auto Fibonnaci is a free indicator for Meta Trader, in order to show the most famous chart in the financial market known as "Fibonnaci".
As we can see in the images below, the fibonnaci table will automatically analyze the graph for you, with trend factors through percentage, almost infallible use, you can always work when the percentage is low or high, start shopping and sales on time, great for analyzing entries!
In the images below we can see an example in gold in H4, where we are a
FREE
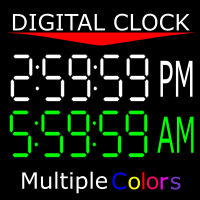
显示您所在服务器的时间以及您所在时区的当前时间。 12小时时钟格式(上午12:00:00至晚上11:59:59) 1-5分钟的图表以小时:分钟:秒格式表示 图表从15分钟到1个月以小时为单位:分钟格式“ 您还可以将时钟颜色更改为MT4 提供的任何颜色。 这是由谷歌翻译翻译。 我不会说这种语言。 //------------------------------------------------------------- 顯示您所在服務器的時間以及您所在時區的當前時間。 12小時時鐘格式(上午12:00:00至晚上11:59:59) 1-5分鐘的圖表以小時:分鐘:秒格式表示 圖表從15分鐘到1個月以小時為單位:分鐘格式“ 您還可以將時鐘顏色更改為MT4 提供的任何顏色。 這是由谷歌翻譯翻譯。 我不會說這種語言。
FREE

The indicator is a 15-minute signal indicator for all types of traders. Meaning, you could make lots of profits trading two different signals in one indicator.
NOTE: Both indicators are channels for achieving the same result. RED ARROW -- Sell Signal BLUE ARROW -- Buy Signal
Purchase now to be part of our community. We offer standard chart setups for both novice and intermediate traders. Trade with ease!
FREE

Metatrader 4 的 R Inside Bar 指标提供了基于内部条形图的简单易用的价格突破水平。
它适用于纯价格行为,不会重新绘制任何内容,并以实际内柱上方和下方的 2 条彩色水平线的形式在主 MT4 图表窗口中弹出。
绿色水平线作为阻力,红线作为支撑。
多空交易理念 如果烛台收于绿色内柱线上方且整体趋势向上,则打开买单。 如果烛台收于红色内柱线下方且整体趋势向下,则打开卖单。 R Inside Bar 指标同样适用于所有货币对(主要货币对、次要货币对和外来货币对),如果使用得当,它会显示出可喜的结果。
提示
随意使用您自己喜欢的交易入场、止损和获利方法与 R Inside Bar 指标进行交易。
与往常一样,根据整体趋势进行交易,并首先在模拟账户上进行练习,直到您完全理解该指标。
请注意,即使是最好的交易指标也无法在长期内产生 100% 的胜率。
规格和输入 交易平台:Metatrader 4 (MT4)
货币对:适用于任何货币对
时间范围:适用于(1-M、5-M、15-M、30-M、1-H) 交易风格:适用于剥头皮交易、日内交易和
FREE

This indicator will show yesterday and today high low, very useful to understand the market sentiment. To trade within the range/ break out. Previous day low- can act as support- can used for pull back or break out Previous day high- can act as resistance- can used for pull back or break out The previous day high low breakout strategy refers to the day trading technique that provides traders with multiple opportunities to go either long or short . The main idea is to identify the trend in its m
FREE

Donchian channels are a tool in technical analysis used to determine the relative volatility of a market and the potential for price breakouts.
Can help identify potential breakouts and reversals in price, which are the moments when traders are called on to make strategic decisions. These strategies can help you capitalize on price trends while having pre-defined entry and exit points to secure gains or limit losses. Using the Donchian channel can thus be part of a disciplined approach to manag
FREE
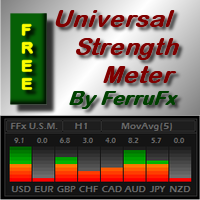
PRO version is available here: https://www.mql5.com/en/market/product/12648 FFx Universal Strength Meter is more than a basic strength meter. Instead of limiting the calculation to price, it can be based on any of the 19 integrated strength modes + 9 timeframes. With the FFx USM, you are able to define any period for any timeframe. For example, you can set the dashboard for the last 10 candles for M15… Full flexibility! Very easy to interpret... It gives a great idea about which currency is weak
FREE

This is yet another non-parametric ZigZag. Its every upward edge continues until next bar's high is formed below highest low of its bars, and every downward edge continues until next bar's low is formed above lowest high of its bars. In addition to zigzag itself (shown in orange color), the indicator shows signal marks on those bars where zigzag direction changes. The blue arrow up denotes that new bullish edge is started (but not yet completed), whereas the red arrow down denotes that new beari
FREE
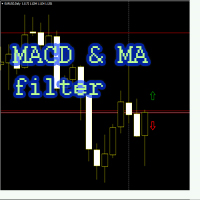
The MACD and MA filter EA trades on the MACD indicator, uses the filter as two moving averages (fast MA is higher than slow MA - buy, sell - contrary), the Martingale is applied at the request of the User (the amount of lot multiplication for a series of losses is limited), breakeven, trailing stop, inverting the signal. In EA version 1.4. added closing an order by a reverse signal, separately by the MACD indicator (parameter Close_By_Reverse_MACD_Signal), separately by moving averages (paramete
FREE

"Capture the sleeping and waking alligator." Detect trend entrance/exit conditions - this indicator can also be tuned according to your trading style. You can adjust a confidence parameter to reduce false positives (but capture less of the trend). This is based on a modification of the Alligator indicator by Bill Williams, an early pioneer of market psychology. 2 main strategies: either the " conservative" approach to more frequently make profitable trades (at a lower profit), or the " high r
FREE

Defining Range ( DR ) and Implied Defining Range ( IDR ) indicator
Show DR and IDR ranges on the chart for Regular , Overnight and After Sessions
for more information how DR and IDR work and the high probability watch : https://www.youtube.com/@themas7er or https://twitter.com/IamMas7er
Remember to set set your chart TimeZone when you attach indicator to the chart under indicator settings / inputs
Volume Imbalance : https://www.mql5.com/en/market/product/91165?source=Site+Pr
FREE

The DE_30_803015187_S_Ke_CF_SQX is an algorithmic trading strategy for MetaTrader, tested on DAX using the M30 timeframe from December 7, 2017, to June 2, 2023. There is no need to set up parameters, all settings are already optimized and fine-tuned.
Recommended broker RoboForex because of EET timezone.
You can find the strategy source code for StrategyQuant at the link: http://quantmonitor.net/listing/dax-keltner-channel-breaker/
Key details are:
MagicNumber: 803015187 Main Chart: C
FREE
Product Name: Trailing Stop and Breakeven Management EA Description:
This EA (Expert Advisor) is designed to set trailing stops and breakeven levels for trades based on input parameters and a magic number in MT4. It can be used to manage trades placed manually or by any other EA. The EA allows customization of various settings to suit your trading strategy. General Settings: Enable Magic Number (ENABLE_MAGIC_NUMBER): Enable to use a magic number for trades. Set to false for manual trades. Magic
FREE

The HedgeFund Experiment This is a basic version of the professional version; The HedgeFund Manager https://www.mql5.com/en/market/product/85241 It is a multi-currency EA that needs only to be loaded in one chart. It will access all Forex pairs or CFD provided by your broker and will only trade those with a spread less than or equal to MaxSpread specified in the settings. It uses standard Metatrader4 indicators to generate signals but with a customized trend filter to pick which pairs to includ
FREE

When prices breakout resistance levels are combined with Larry Williams' Percentage Range "WPR" oscillator breaks out its historical resistance levels then probability emerges to record farther prices. It's strongly encouraged to confirm price breakout with oscillator breakout since they have comparable effects to price breaking support and resistance levels; surely, short trades will have the same perception. Concept is based on find swing levels which based on number of bars by each side
FREE
It's a two (2) pairs correlation system to use 3 currencies to make 2 pairs to open hedge orders on those.
The expert starts opening four orders for each couple (2 plus and 2 minus) and wait to move prices in one direction to make a grid of orders.
The expert can use a maximum of 5 currencies to make 10 pairs and make 30 couples.
It is important the order of currencies is from the strongest to the weakest.
Strongest... EUR/GBP/AUD/NZD/USD/CAD/CHF/JPY ...weakest.
Canto inputs minimum o
FREE

This indicator monitors the vital constants of your trading account to keep it healthy and away from excessive risks. It monitors all trades, absolute exposure, account floating point and leverage currently in use, using different color codes for your interpretation. [ Installation Guide | Update Guide | Troubleshooting | FAQ | All Products ] Amazingly easy to understand The indicator is clean and simple It calculates exposure by pairs and currencies Keep your used leverage controlled at all ti
FREE

The BinaryFortune indicator has been developed and adapted specifically for trading short-term binary options. The algorithm of the indicator analyzes numerous factors before generating a signal. The indicator is installed in the conventional way. The indicator consists of an information window, which displays the name of the trading instrument, support and resistance levels, and the signal itself ( BUY , SELL or WAIT ). A signal is accompanied by a sound and a pop-up Alert. Advantages of the in
FREE

Session Standard Deviation Date Range Analyzer: Evaluate the standard deviation of each bar's price (high, low, close, open, weighted, median, and typical) within defined trading sessions and date ranges, providing detailed insights into price volatility and market behavior. **Note:** When the trading platform is closed, the indicator may not load correctly. To ensure it works, you may need to load the indicator, unload it, and then load it again. **Note:** This indicator can only be used with
FREE
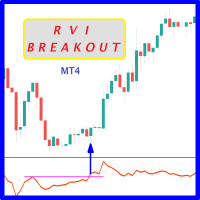
Probability emerges to record higher prices when RVi breaks out oscillator historical resistance level. It's strongly encouraged to confirm price breakout with oscillator breakout since they have comparable effects to price breaking support and resistance levels; surely, short trades will have the same perception. As advantage, a lot of times oscillator breakout precedes price breakout as early alert to upcoming event as illustrated by 6th screenshot. Furthermore; divergence is confirmed in case
FREE

Moving Average Cloud draws 4 MAs on chart simultaneously in histogram style. Indicator uses 4 MAs: slow sma & ema 200 and fast sma & ema 50. the range between 2 slows MAs and Fasts, represented by histograms on the MAs boundaries - creating kind of "cloud" that can be traded by all kind of MA strategies like support & resistance or other... Change of color of the same histogram points to momentum changing.
Combined with other market analysis, can greatly improve trading results.
FREE

With this system you can spot high-probability trades in direction of strong trends. You can profit from stop hunt moves initiated by the smart money!
Important Information How you can maximize the potential of the scanner, please read here: www.mql5.com/en/blogs/post/718109 Please read also the blog about the usage of the indicator: Professional Trading With Strong Momentum This FREE Version of the indicator works only on EURUSD and GBPUSD. The full version of the indicator can be found here:
FREE

Identification of support and resistance areas
A useful indicator for traders
completely free
Can be used in all symbols
Can be used in all time frames
It has three different trends: short term, medium term, long term
Settings:
Clr1,2: You can change the color of the lines
Type Trend: You can determine the trend
Message me for questions, criticism and suggestions
FREE

FREE TopClock Indicator: This indicator is an Analog Clock That Shows: Local Time Of Pc or Time Of Broker Server or sessions(Sydney -Tokyo London -NewYork)Time or custom Time( with GMT -Base) this can shows Candle Time Remainer with Spread live. You can run this indicator several times for different times and move it to different places on the chart. If you would like, this indicator can be customized for brokers and their IB based on customer needs. For more information contact us if you
FREE

How the Indicator Works:
This is a Multi-timeframe MA multimeter indicator which studies if price is above or below a particular EMA range and shows Red/Green/Yellow signals. Red: Price Below EMA range Green: Price above range Yellow: Price within range
Indicator Properties:
EMA Settings: - Default Period is 200. You can change all MA Settings like Period, MA Method (SMA, EMA, etc) or MA Applied Price (Close, Open, etc).
- EMA Range list is a comma separated value list for different timefr
FREE

This indicator calculates gann support and resistance prices with use gann pyramid formulation and draw them on the chart. And If you want, Indicator can alert you when the current price arrive these pivot levels. Alert Options: Send Mobil Message, Send E-mail, Show Message and Sound Alert Levels: S1, S2, S3, S4, S5, R1, R2, R3, R4, R5 Inputs: GannInputPrice: Input price for gann pyramid formulation. GannInputDigit: How many digit do you want to use for calculation formula. (The number and the
FREE

RoundNumbers indicator is a simple and powerful psychological price levels. Trader usually use these levels as a Support and Resistance (SnR). Indicator Input: Levels - Numbers of levels drawn on chart. Default 30 levels. BoxSize - Box size drawn on each levels, indicate buffers around levels. Default value 1pips (10point) above and below each levels. ZoneSize - Distance between each levels, default value 10pips (100point). Style & Colours - User inputs customization.
For MT5 version, please r
FREE

This indicator uses a different approach from the previous version to get it's trendlines. This method is derived from Orchard Forex, and the process of making the indicator is demonstrated in there video https://www.youtube.com/watch?v=mEaiurw56wY&t=1425s .
The basic idea behind this indicator is it draws a tangent line on the highest levels and lowest levels of the bars used for calculation, while ensuring that the lines don't intersect with the bars in review (alittle confusing? I kno
FREE

The Investment Castle Chances indicator will show signals on the chart for entering a buy or sell trade. There are 2 types of signals for each direction as follows: Buy / Sell (Orange colored candlesticks) Strong Buy (Green colored candlesticks) / Strong Sell (Red colored candlesticks) You may place a buy trade once you see the Buy arrow or vise versa, or you might prefer to wait for a further confirmation “Strong Buy” / “Strong Sell”. This indicator works best with the high time frames H1, H
FREE
Daily Monitoring : The indicator automatically calculates and displays the daily drawdown on your trading chart, allowing you to see how well you're performing on a daily basis. Risk Management : By monitoring daily drawdown, traders can better manage their risk. It helps to keep daily losses within acceptable limits. Real-Time Information : Daily drawdown is updated in real-time, providing accurate and up-to-date information about your trading performance. How to Use: Activate the "Daily Drawd
FREE

FREE

The utility places a grid of pending orders. You can select the number of orders in the grid, the step between orders, multiplier for the order size, SL and TP levels and the magic number. MT5 version of the utility is avaliable by the link - https://www.mql5.com/en/market/product/73489 If you like this utility, take a look at my other products - https://www.mql5.com/en/users/nina_yermolenko/seller
FREE

The UNIVERSAL DASHBOARD indicator will eliminate the need of using dozens of indicators on dozens of charts. From one place you can monitor all the pairs and all the timeframes for each of the following indicators: MACD STOCHASTIC WPR RSI CCI You can also use any Custom indicator in the dashboard as long as it has a readable buffer. With a single click you can quickly navigate between charts, pairs and timeframes. Alerts will provide clear indication about what happens for your favorite pairs on
FREE

This indicator allow you to measure Profit/Loss of current, closed or future trade in account currency and estimate margin level at the trade close point. Profit/Loss indicator is based on MT4 native Crosshair instrument and has following inputs: Trade Direction = Buy/Sell Lot size = 0.1 Font size = 8 Font color = DeepSkyBlue Offset horizontal Offset vertical
FREE

This SMART Expert Advisor trades SAFE and STEADY a nd manages all position's risk.
This is why we call it Smart Safe Steady .
Features Scalper: It is Scalper EA, but does not accept risk a lot to trade over sized, although you can bypass it's default setting in your own risk. Conservative: It is not going to keep trades open in high volatile market so it is SAFE and would close the trades even in zero profit. Martingale: This is not loss accepting so in case of loss, it runs special type of M
FREE

Average Session Range MT4: Calculate and Average the Sessions High-Low Range of Specific Time Sessions Over Multiple Days. The Session Average Range is a sophisticated and precise tool designed to calculate the volatility of specific time sessions within the trading day. By meticulously analyzing the range between the high and low prices of a defined trading session over multiple days, this tool provides traders with a clear and actionable average range. **Note:** When the trading platform is cl
FREE

This EA (Expert Advisor) is based on the logic of the ADX and utilizes the strength of trends as entry signals.
The most crucial factor here is the success rate of these entries.
By increasing the success rate, even with smaller profits for each individual trade, it becomes possible to accumulate substantial gains when trading across numerous currency pairs.
This EA primarily operates on longer timeframes because it makes it easier to determine whether the trend is upward or downwar
FREE

The Robot's Logic
Check the longer time frame range, and if the price breaks that range, it opens an entry.
BUY and SELL entries are decided based on RSI overbought and oversold conditions.
The logic is very simple, but longer time frames such as H4 give the best performance. Please attach EA on the TF H4 and buy and sell entry is closed with profit target which is auto calculation.
FREE
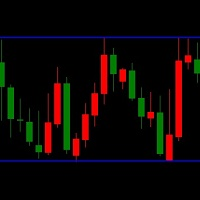
LT Triple Support Resistance Screen Method is a kind of levels indicator that consist of three SR lines. It is built by MQL4 programming language and can be used to MT4 platform. A free version indicator to determine the support and resistance levels easily This indicator works based on the screen method to calculate the most appropriate value for each buffer. A complex algorithm based on long research is applied to this free custom indicator. But this indicator has limited features and simpler
FREE

该 Pz 振荡器 是一款非常平稳和灵敏的加速计,它提供了很多有用的信息,并自动检测背离。它可以用来识别趋势的方向和强度,以及确认。它被设计用于我们的交易工具的补充。
趋势方向 该振荡器绘制两条均线来显示趋势的方向。如果快速均线上穿慢速均线, 市场行情处于涨势,并且多头交易可下单。同样地,如果快速均线下穿慢速均线,市场行情处于跌势,空头交易可下单。 其它识别市场行情趋势的方式是通过直方图的绝对值。如果直方图的值高于零轴, 市场行情为涨势。如果直方图的值低于零轴, 市场行情为跌势。
趋势强度 趋势强度 (或速度) 由直方图描述。一根蓝色柱线代表多头冲量,而红色柱线代表空头冲量。如何处理这些任意给定时刻的信息,取决于市场的趋势。如果在跌势当中出现多头冲量,它意味着跌势衰竭,并且停止加速。同样地,如果在涨势当中出现空头冲量,它意味着涨势衰竭,并且停止加速。
背离 该指标自动检测并绘制常规和隐藏的背离, 并在它们出现时可用于交易, 但并非意味着 立即 交易。若要背离交易成功,您必须一并考虑趋势方向和强度,解释如上所述。以下是一个空头背离的完美情况: 振荡器的快速均线高于零轴 振荡器显
FREE

This outside bar indicator is the opposite of the inside bar. So what this MT4 outside bar indicator does is identifies outside bars for you as they form on your charts. Outside bar is a famous trading pattern in which the bar carry higher high and lower low compared with the previous bar, also known as mother bar. To trade based on Outside Bars, simply place buy stop order above the high price level of a bullish Outside Bar, and sell stop order should be placed below the low price level of a be
FREE

Diversify the risk in your trading account by combining our Expert Advisors. Build your own custom trading system here: Simple Forex Trading Strategies
The expert advisor opens trades when EMAs cross and the Average Directional Index is above 25. The Stop Loss, Take Profit, and Trailing Stop are calculated based on the ATR indicator. The recommended currency pair is GBPAUD. The recommended timeframe to operate and to do backtests is D1. This Expert Advisor can be profitable in any TimeFrame
FREE

该指标分析分形的价格结构并确定市场动态的可能反转点。与其他类型的指标结合使用时非常完美。
好处:
适用于所有仪器和时间序列, 不重绘结果, 指示器元素的可定制颜色, 适用于任何趋势策略, 调整分形的强度。
MT5 version -> HERE / Our news -> HERE
Strategy:
AW Flexible Fractals is an indicator that indicates signals not instantly, but with a delay, due to the structure of the fractal.
To detect a signal in the " Number of candles on each side of the fractal " variable, you can adjust the number of bars on each side from the central point of the fractal. In the default settin
FREE

The Delta is one of the best MT4 EA which is not using dangerous methods like Martingale or grid.
Working on Multi chart: CADCHF;GBPCHF;GBPJPY;GBPUSD;NZDCAD;USDCHF;USDJPY;EURGBP;AUDCHF Just One chart setup is enough for all those pairs at same time.
Has been tested on ICMarkets (Raw account). For other broker choose ECN, Which mean spread should be low as much as possible. The EA working well on all Timeframe but recommended is M30 BackTest from 2000 until now
Features: No martingale
FREE
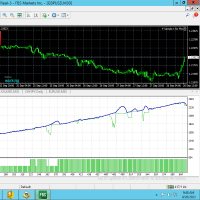
It's only good works on EURUSD M30 Timeframe. This robot is profitable. This robot requires minimum deposit of $1000 for small DD . You can get good results with it. You can test it first. You can increase the equity percentage. It will increase the volume in a certain ratio as the equity increases. You don't need to increase the volume by yourself. For the first few days, use the equity volume setup in this robot and then test and increase the equity setting. Another Same MT5 Product link: htt
FREE
Download the USDJPY free version here.
Scalping Strategy
BUY SELL
Having a strategy in the market is one of the main conditions for trading. The presence of various and complicated indicators and tools sometimes makes trading difficult, and the user gets confused after trying various methods and gets stuck in a loss cycle, the result of which is usually clear. This indicator is a simple strategy based on the detection of pivots and short-term trends, which helps you to easily trade i
FREE

VR 网格指示器 设计 用于创建具有用户定义设置的图形网格。与 标准网格 不同,VR 网格用于构建 圆形关卡 。根据用户的选择,轮次级别之间的步长可以是任意的。此外,与其他指标和实用程序不同,即使时间段发生变化或终端重新启动,VR Grid 也能保持网格的位置 。 设置、设置文件、演示版本、说明、问题解决,可以从以下位置获取 [博客]
您可以在以下位置阅读或撰写评论 [关联]
版本为 [MetaTrader 5] 垂直级别 基于实际时间间隔并 忽略缺失 或不存在的周期。因此,级别之间的步长严格对应于用户选择的值。 使用 VR 网格指标时,交易者 可以更改任何级别的垂直线和水平线的样式 、颜色和粗细。这使您可以控制金融工具的 回合水平 。 整数位是 以两个或多个零结尾 的价格(例如:1.23500、5.65900、1923.200)。人们相信,这样的水平 经常充当 作为支撑或阻力的强点。 Horizontal line settings Horizontal line step Horizontal line color Horizontal line style Horizon
FREE

SmartStochasticMt4 is a universal indicator for making trading decisions. An indispensable tool for novice traders, as it has no settings and is ready to work after installation.
Advantages of the indicator:
1. Works with any trading symbol
2. Works on any time period
3. Has no configurable parameters
4. Provides a complete picture of the trading situation from different time periods
5. Not late
Working with the indicator
1. To set the indicator
2. To exclude from the time of the rel
FREE

Indicator draws Round Number lines by distance of pips. 1. You can enable / disable indicator to show / hide the lines. 2. You can set distance of pips between the lines. 3. You can edit the number of lines. 4. You can edit properties of lines by inputs (style (DASH, DOT, SOLID, ...) , width (1 for DASH, DOT, 2 is not for DASH, DOT, it only SOLID), color). When indicator is deleted from the chart, the lines will be removed.
FREE

(谷歌翻译) 标准 Heikin Ashi 蜡烛图的开放值相当于 指数 总价 的移动平均线(EMA) , EMA 的 alpha 值是固定的 0.5(相当于 EMA 周期 3.0)。 在这个动态版本中,周期可以更改为您希望使用的任何值,这也允许您 近似多时间框架分析,或使用低值或高值作为一种追踪止损。 的穿越 Heikin Ashi 开盘价的实际 收盘价 也可以用作价格变化的信号 趋势方向。
此外,除了标准 EMA 之外,此版本还可以选择使用 几乎零滞后的 EMA 相反,它可以更快地检测趋势方向的变化,尤其是在使用较长时间的 平均。
将指标附加到图表时,您还可以选择自动将图表切换到 折线图模式 并可选择在 折线图 中隐藏真实的 收盘价 ,但是, 没有它,您将无法看到实际 收盘价 和实际价格之间的交叉信号 Heikin Ashi 开放价值观。 (谷歌翻譯) 標準 Heikin Ashi 蠟燭圖的開放值相當於 指數 總價 的移動平均線(EMA) , EMA 的 alpha 值是固定的 0.5(相當於 EMA 週期 3.0)。 在這個動態版本中,週期可以更改為您希望使用的任何值,這也允
FREE
显示每秒更新的当前市场信息。 传播尺寸; 掉期大小:短仓和长仓; 本地时间(可选); 我的#1助手 :包括38+功能/ 如果您有任何问题 ,请与我联系 在指示器的设置中,您可以配置: 字体大小; 文字颜色; 选择定位:图表的左/右角; 本地时间:开/关; 程序文件必须放在"Indicators"目录下。 .................................................................................................................................................................
FREE

此脚本旨在根据可自定义的条件自动为所有未平仓的交易设置止损 (SL) 和止盈 (TP) 水平。与传统脚本只运行一次并退出不同,此脚本会持续监控您的交易,并对符合指定条件的任何新订单应用 SL 和 TP。它非常适合那些希望确保风险管理策略始终应用于所有交易的交易者。 主要功能包括持续监控、自定义 SL/TP 水平,以及选择性地应用于买单、卖单或两者。脚本还可以配置为仅修改具有特定魔术号码或评论的订单。您可以将脚本限制为仅修改当前交易品种的订单,或将更改应用于所有交易品种。此外,您还可以选择基于订单的开盘价或当前市场价格来计算 SL/TP。脚本还支持对挂单应用 SL/TP 设置(如果需要),并且您可以调整运行间隔,以控制脚本检查新交易的频率。 此脚本最适合那些需要将风险管理规则持续应用于多个交易的用户。在将脚本用于真实账户之前,建议在模拟账户中测试脚本,以确保其按预期运行。 免责声明:此脚本不提供任何保证。用户应自行承担风险,强烈建议在真实交易环境中使用前在模拟账户中彻底测试。
FREE
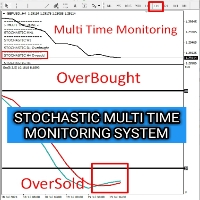
I made this Stochastic Indicator into multi time frame monitoring to monitor the occurrence of OverBuy and OverSell in real time on one monitor screen. My hope is that this indicator can help friends in the analysis process and also take trading moments with the system that friends have If this indicator is useful, friends can help me by giving likes to my channel and 5 stars on this indicator
Indicator Stochastic ini saya buat menjadi multi time frame monitoring untuk memantau terjadi nya
FREE
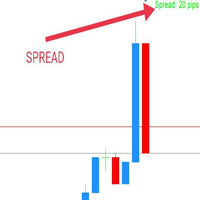
WaSpread MT4 Indicator shows the current spread in pips with color.
* Set the Spread Threshold and the color to identify when the current spread is below or above the Spread Threshold.
* Set X axis and Y axis and chose the Corner and the Anchor to position the Spread Label on the chart.
* Write the font and the font size for more confort.
* Activate alert if the current spread is above the spread threshold.
* For more precision, the user can choose to show the decimal numbers.
* The
FREE

This indicator is based on the ADX indicator and indicates the trend very easily.
You can customize the indicator to your needs: ADXPeriod ADXSignal_Level BarWidth CandleWith HeikenAshi
The Adx color candles indicator is fully FREE and compatible with the other part of the system; the Acc arrow >>>> https://www.mql5.com/en/market/product/33770 ENJOY and check out my other indicator: https://www.mql5.com/en/market/product/32111
FREE

Custom Pattern Detector Indicator
This indicator lets you define your own custom pattern instead of the typical candlestick patterns. Everybody already knows about common candlestick patterns like the Doji pattern. This indicator is different though. The pattern you will define is a custom pattern based on CANDLE FORMATIONS . Once the indicator knows the pattern you want it to look for, then it will go through history on the chart and find matching patterns, make them visible to you, and calcul
FREE

此脚本允许您将任何类型的绘图对象(如趋势线、斐波那契回撤等)复制到一个或多个其他图表。
默认情况下,脚本会将当前图表(即应用脚本的图表)上的所有对象复制到当前加载的相同交易品种的任何其他图表。
设置
目的地时间表 当设置为除 PERIOD_CURRENT 以外的任何值时,它会将对象复制到与应用脚本的图表具有相同交易品种的任何打开图表。 如果您将值设置为特定的时间范围,例如 PERIOD_D1,则只会更新具有相同交易品种和周期的图表。 复制对象类型 您可以将其设置为您希望复制的特定类型的对象,然后只有该类型的对象将被复制到其他图表。 复制指标窗口对象 当设置为 True 时,指示器窗口上的对象也将被复制。这依赖于第二张图表具有与源图表相同的指标,并且顺序相同。
在图表之间复制对象让您满意!
FREE
MetaTrader市场是独有的自动交易和技术指标商店。
阅读MQL5.community用户备忘更多地了解我们提供给交易者的独特的服务:复制交易信号,自由职业者开发的自定义应用程序,通过支付系统完成的自动付款和MQL5云网络。
您错过了交易机会:
- 免费交易应用程序
- 8,000+信号可供复制
- 探索金融市场的经济新闻
注册
登录