适用于MetaTrader 4的免费EA交易和指标 - 14

MA MTF Overlay Chart is software that allows you to overlay the candlestick chart of a financial instrument with a second candlestick chart of the same one, or of another, financial instrument, by setting a different timeframe from that of the basic chart. The software is very simple to use and the input parameters are listed below.
Input parameters: Overlay chart set-up Financial instrument : financial instrument that you want to overlay on the base chart Time period : secondary instrum
FREE

1、此跟单系统为本地跟单系统,即发射端和接收端必须在同一电脑操作,因为MT4/5账号可以在多台电脑同时登录,所以只需要把只读账号密码发给客户即可跟单。本地跟单因为不涉及网络跟单速度很快,非常稳定。 2.当前为发射端,加载到图表就可以正常工作,另外需要安装接收端来接收订单,然后在参数列表里输入发身端的mt5帐号。 3.支持一跟多 多跟一 多跟多,只要你电脑可以运行多个MT4/MT5,就可以运行多少个跟单,同一个平台可以用复制安装后的文件夹来实现同时登陆多个账号。 4.支持mt4接收端接收mt5发射端,实现mt4跟单mt5,也支持mt5跟单mt5. 5.功能介绍:
支持同平台/跨平台跟单
支持一跟多、多跟一、多跟多
支持正向跟单
支持固定单量跟单
支持比例单量跟单
支挂四种工作模式 : 1.mt4跟单mt4 2.mt4跟单mt5 3.mt5跟单mt4 4.mt5跟单mt5 注意:需要配合接收端,才能正常工作。 mt5 接收 端: https://www.mql5.com/zh/market/product/74023 mt4 接收 端: https://w
FREE

The three white soldiers and the three black crows candlestick patterns are reversal patterns that predict a change in the direction of a trend. The pattern consists of three consecutive long-bodied candlesticks that open within the previous candle's real body and a close that exceeds the previous candle's. It's important to note that both formations are only valid when they appear after a strong uptrend or a downtrend, while their efficiency decreases in choppy markets.
Inputs AlertOn - e
FREE

Expert advisor based on your own personal moving average strategy. Whatever your strategy is, it's him. You can use it on all parities. No restrictions. Settings : Buy Settings 1.Moving Average Period 1.Moving Average Method 2.Moving Average Period 2.Moving Average Period Buy Lot Size Buy Stop Loss Level Buy Take Profit Level
Sell Settings 3.Moving Average Period 3.Moving Average Method 4.Moving Average Period 4.Moving Average Period Sell Lot Size Sell Stop Loss Level Sell Take Profit Level
FREE

The XR Gartley Pattern MT4 is an indicator which displays and alerts Gartley pattern detected on the candlestick chart. It also displays potential trade with calculated Take Profit and Stop Loss, Timeframe H1. After purchasing XR Gartley Pattern, you can immediately download this indicator from the MT4-MT5 Market and start using it because all features are set to default, is not necessary to change any parameter. In addition, we have created a private group for customers who have purchased one
FREE

VANEXIO USES THE TREND WAVE INDICATOR AND IT CAN IDENTIFY THE BEGINNING AND THE END OF A NEW WAVE TREND MOVEMENT.
AS AN OSCILLATOR, THE INDICATOR IDENTIFIES THE OVERBOUGHT AND OVERSOLD ZONES.
IT WORKS GREAT TO CATCH THE SHORT TERM PRICE REVERSALS AND USES A MARTINGALE STRATEGY TO CLOSE ALL TRADES IN PROFIT.
USE DEFAULT SETTINGS ON H1 OR HIGHER TIME FRAME ON ANY PAIR FOR MORE ACCURATE TRADES
WHY THIS EA :
Smart entries calculated by 5 great strategies The EA can be run on even a $20000
FREE

The Candle Scalper EA is a fully automated Expert Advisor that trades based on price action. The EA trades using market orders and uses averaging to safely turn otherwise negative trades positive. This EA works best on EURUSD using the M5 timeframe. A VPS is advisable when trading this system. Check the comments for back test results and optimized settings. Please note: I have made the decision to give this EA away and many more for free with limited support so that I can concentrate on Custom E
FREE

Fractal is one of the main indicators in a number of strategies. Volume Fractals has expanded the functionality of the standard indicator version. The product features fractals sorting and displaying fractals representing both price and volume extreme points.
Application Stop losses Reversal signals Placing pending orders for a fractal breakout
Options Bars of history - number of chart bars the indicator is displayed for Left side minimum bars - minimum number of bars to the left of the frac
FREE

Introducing Free Version Of Candle Strike EA , the groundbreaking MQL5 expert advisor that's transforming the way you trade your favorite pairs! Developed by a team of experienced traders with trading experience of over 10 years. What we Got in Free Version: In this version you cannot change the Lot size anda cannot use compound feature. The default lot size is 0.01 Real-time results can be viewed here . Presets for EA here *Promotional Price: $50. The price will increase $25 with every
FREE

The Trade Grid bot simplifies trading by executing multiple orders with a single click, as specified by the user. These orders are initiated instantly using the EA buttons on the chart and can be closed simultaneously using the close button also located on the chart. Additionally, Trade Grid efficiently manages trades by automatically closing them once they reach a predefined profit or loss threshold.
FREE

The "Yesterday High Low" indicator for the MetaTrader 4 (MT4) trading platform is a powerful tool designed to help traders identify key price levels from the previous trading day. This indicator provides a visual representation of the high prices, low prices, high/low price averages, and intermediate average levels on the chart.
Primarily used by institutional and professional traders, this indicator offers an instant view of price levels that are often considered crucial in financial markets
FREE

工作逻辑
止损实用程序是一个简单但非常方便的指标,显示离止损水平还剩多少点 /
它的好处在于,许多交易者在追求利润时故意高估交易风险,最大限度地使用可用保证金,对于这种情况,知道经纪人可以在哪里强行平仓非常重要。
只需将指标放在图表上,根据买入或卖出的未平仓头寸,您将在图表上看到此交易价格的边界标记。
在您开仓之前,该线在图表上不可见。 推荐机器人黄牛 - https://www.mql5.com/en/market/product/77108
变量
字体大小 - 标签中的字体大小
边缘缩进 - 从边缘缩进
线条颜色 - 线条颜色
文字颜色 - 文字颜色 如果您喜欢该指标,请留下您对该产品的评论和评分。我将不胜感激!谢谢! 也看看我的其他产品,你会发现很多对交易有用的!
FREE

指标适用于趋势跟随者! 三条均线构建的交易系统.顺势交易,让利润奔 跑. 交易实用必备工具指标 波浪自动计算指标,通道趋势交易 完美的趋势-波浪自动计算通道计算 , MT4版本 完美的趋势-波浪自动计算通道计算 , MT5版本 本地跟单复制交易 Easy And Fast Copy , MT4版本 Easy And Fast Copy , MT5版本 本地跟单复制交易 模拟试用 Easy And Fast Copy , MT4 模拟账号运行 Easy And Fast Copy , MT5 模拟账号运行 强烈推荐趋势指标, 波浪的标准自动计算 和 波浪的标准自动计算MT5版本 升级版蜡烛图颜色可变 合作QQ:556024" 合作wechat:556024" 合作email:556024@qq.com" 专业EA指标定制编写. 首先,我们要明白,所有的移动均线都是滞后指标,它们只能事后告诉你市场已经转向,即使它们提供了有价值的信息并且帮助你建立了头寸,不能协助在利润最大化方面发挥太多作用,所以要配合均线价值回归区域使用,价格可以根据重要支撑线的指示,不是滞后的,当市场从目前的隧道
FREE

TrendExpert Indicator Overview
The TrendExpert indicator is designed to identify and visualize trend zones in financial markets. It utilizes zigzag high and low points to determine support and resistance levels, providing insights into potential market reversals and continuation patterns.
Features - Detection of support and resistance zones based on price action. - Strength categorization (Proven, Verified, Untested, Turncoat, Weak) based on historical testing. - Adjustable parameters fo
FREE
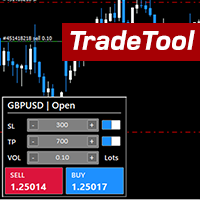
GENERAL DESCRIPTION
TradeTool is a basic order management solution, and an extension of MetaTrader's One Click Trading feature that allows Stop Loss and Take Profit levels to be automatically placed based on set POINTS distance.
Adjustable Trade Parameters: Volume, SL Points, TP Points, Pending Order
EA INPUTS Default Volume - EA's default volume Default SL Points - Stop Loss default points distance from current market price Default TP Points - Take Profit default points distance from curre
FREE

Check my p a id tools they work perfect please r ate Adjustable PIN BAR indicator is usefull tool alowing to search for pin bars you wish to find on the price chart, it has 2 parameters to filter out what type of pin bars you wish to search for: 1) MinTailProc 75% (default) which means to show pin bars that has minimum size of the Nose (Tail) as 75% of full candle size. If Upper Nose (Tail) size of the candle is minimum 75% of the candle size fully than candle is painted in RED. If Lower Nose
FREE

Heiken Ashi Button Heiken-Ashi , often spelled Heikin-Ashi, is a Japanese word that means "Average Bar." The Heiken-Ashi approach can be used in conjunction with candlestick charts to spot market trends and forecast future prices. It's useful for making candlestick charts easier to read and analysing patterns. Traders can use Heiken-Ashi charts to determine when to stay in trades while the trend continues and close trades when the trend reverses. The majority of earnings are made when markets a
FREE

NATS (Niguru Automatic Trailing Stop) will help you achieve more profits, by setting the trailing stop automatically. Pair this NATS application with EA, or can also be used as a complement to manual trading. A trailing stop is a powerful tool in trading that combines risk management and profit optimization.
A trailing stop is a type of market order that sets a stop-loss at a percentage below the market price of an asset, rather than a fixed number. It dynamically adjusts as the asset’s pric
FREE

This indicator show candle time remaining. The remaining time of the candle is calculated every 200 milliseconds. 1. You can set x (horizontal), y (vertical) of text. 2. You can set font, color, size of text. 3. You can remove the text without having to remove the indicator from the chart. The remaining time of the candle depends on the timeframe of the chart with the indicator.
FREE

THE_____ IIIREX_CLAW_vs_CLUSTER_EAIII______ Set1: Price Offset 100, Stopp Loss 100-1000, Take Profit 2000
Set2: Price Offset 200, Stopp Loss 100-1000, Take Profit 2000
Set3: Price Offset 100, Stopp Loss 100-1000, Take Profit 1000
Set4: Price Offset 200, Stopp Loss 100-1000, Take Profit 1000
Set5: PriceOffset 100-1000 (Recomment 200) higher is lower Risk, Stopp Loss 500 Take Profit 1000, 2000, or 3000 it is the same Target
Set it to your Moneymanagement
Indize: DE40
“IC Market” Rec
FREE

The indicator is a T3 and Rsi based oscillator with color change.
The indicator repaints.
Check out my indicators and Expert Advisors - https://www.mql5.com/en/users/ptr777/seller
The values and colors can be changed as preferred.
Please play around with the settings to get better signals.
The fast line gives earlier signals but if you want confirmation wait for the cross or slow line to change color also.
Buy when lines is closer to the 20 line and sell closer to the 80 line.
Sy
FREE

Metatrader 4 的 R Inside Bar 指标提供了基于内部条形图的简单易用的价格突破水平。
它适用于纯价格行为,不会重新绘制任何内容,并以实际内柱上方和下方的 2 条彩色水平线的形式在主 MT4 图表窗口中弹出。
绿色水平线作为阻力,红线作为支撑。
多空交易理念 如果烛台收于绿色内柱线上方且整体趋势向上,则打开买单。 如果烛台收于红色内柱线下方且整体趋势向下,则打开卖单。 R Inside Bar 指标同样适用于所有货币对(主要货币对、次要货币对和外来货币对),如果使用得当,它会显示出可喜的结果。
提示
随意使用您自己喜欢的交易入场、止损和获利方法与 R Inside Bar 指标进行交易。
与往常一样,根据整体趋势进行交易,并首先在模拟账户上进行练习,直到您完全理解该指标。
请注意,即使是最好的交易指标也无法在长期内产生 100% 的胜率。
规格和输入 交易平台:Metatrader 4 (MT4)
货币对:适用于任何货币对
时间范围:适用于(1-M、5-M、15-M、30-M、1-H) 交易风格:适用于剥头皮交易、日内交易和
FREE

Draw and Sync Objects Multiple Charts 1. Draw objects by key press. ( You must: 1. Press Function key => 2. Click where you want to draw => 3. Draw it => 4. Press ESC to complete). (If you don't want to draw after pressing function key, you must press ESC to cancel). 2. Developing : Sync selected objects to multiple charts by button. 3. Developing: Hide objects that do not belong to the current symbol (Objects drawn with this indicator will belong to the symbol they are plotted
FREE

This indicator allow you to measure Profit/Loss of current, closed or future trade in account currency and estimate margin level at the trade close point. Profit/Loss indicator is based on MT4 native Crosshair instrument and has following inputs: Trade Direction = Buy/Sell Lot size = 0.1 Font size = 8 Font color = DeepSkyBlue Offset horizontal Offset vertical
FREE
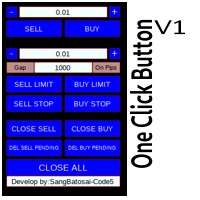
Simple button panel of trade on your chart with OneClick V1 Trial version. This trade panel will make it easier for you.
Equipped with several functions that make it very easy for you. More tools on OneClick VZ version, see here.
This version includes: Open Order Buy Open Order Sell Open Pending Order [Buy Limit - Buy Stop - Sell Limit-Sell Stop] Close ALL orders
Close Order Buy Close Order Sell Delete Pending Order [Buy Limit - Buy Stop - Sell Limit-Sell Stop] ENJOY IT!!! ONE CLICK V1 [TRI
FREE

CPR Pivot Lines It Will Draw Pivot Point R1,R2,R3 S1,S2,S3 Tc Bc Best Part Is That You Can Even Add Values Of High,Low,Close Manually Also To Get Your All Levels On Chart. So If Your Broker Data Of High ,Low ,Close Is Incorrect Then You Don’t Have To Depend On Them Anymore. You Can Even Modify All Lines Style. It Will Show Line In Floating Style And Not Continues Mess.
FREE
Tipu Trader is a part of Tipu Panel ecosystem that was developed out of need for quick and simple trading. Tipu Trader is an easy to use trade panel for commonly used trade functions. Create you own signals with Tipu Panel and trade along with Tipu Trader, a simple and easy to use trade panel.
Features An easy to use trade panel for most commonly used trade functions. Create your own personal trade signals with Tipu Panel , and trade with Tipu Trader. Customizable Panel. The panel can be moved
FREE

The Pivot Indicator is a vital tool for technical analysis used by traders in the financial markets. Designed to assist in identifying potential reversal points or trend changes, this indicator provides valuable insights into key levels in the market. Key features of the Pivot Indicator include: Automatic Calculations: The Pivot Indicator automatically calculates Pivot Point, Support, and Resistance levels based on the previous period's high, low, and close prices. This eliminates the complexity
FREE
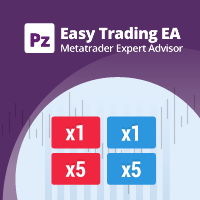
一个简单的交易助手,允许以所需的杠杆轻松买卖。它是为最终交易者或新手交易者创建的,并受到 eToro 或 Binary.com 等流行的基于网络的交易平台的启发。它具有一组实现不同杠杆选项的交易按钮,以及一个用于关闭所有交易的附加按钮。所有交易均根据所使用的杠杆设置止损。这对于从其他平台迁移到 Metatrader 的交易者特别有用。 直观的界面
对短期交易特别有用
使用键盘快捷键快速交易 资金管理变得容易 EA实行严格的杠杆控制机制,将防止损失超过账户资金。
使用键盘快捷键进行交易
Double B:按 B 两次,EA 将买入 双 S:按 S 两次,EA 将卖出 双 C:按 C 两次,EA 将关闭当前图表中的所有交易
输入参数 幻数:用于进行交易的幻数。 滑点:关闭交易时使用的期望滑点。 每笔交易的风险:每笔交易的风险以可用保证金的百分比表示。默认值为 5%。最大值为 100%。 手动点值:交易品种的点值。零意味着 EA 将自动计算它。 杠杆:使用键盘快捷键进行交易时使用的默认杠杆
支持 我很乐意提供免费产品,但鉴于我的时间有限,它们没有任何形式的支持。我很
FREE

Entry Logic The EA (Expert Advisor) will monitor price movements (M5, M15, H1, H4) during the specified input period. If these price movements exceed the input parameters, an entry will be executed. Take Profit (TP) = 50 pips Stop Loss (SL) = 50 pips Maximum Order Quantity = 1 To facilitate profit loss recovery, the robot offers the option to increase the lot size in the next entry (True/False choice).
The best pair GBPUSD / EURUSD
TF M5
Set file (default)
FREE

Gloxen FX USES THE TREND WAVE INDICATOR AND IT CAN IDENTIFY THE BEGINNING AND THE END OF A NEW WAVE TREND MOVEMENT.
AS AN OSCILLATOR, THE INDICATOR IDENTIFIES THE OVERBOUGHT AND OVERSOLD ZONES.
IT WORKS GREAT TO CATCH THE SHORT TERM PRICE REVERSALS AND USES A MARTINGALE STRATEGY TO CLOSE ALL TRADES IN PROFIT.
USE DEFAULT SETTINGS ON H1 OR HIGHER TIME FRAME ON ANY PAIR FOR MORE ACCURATE TRADES
WHY THIS EA :
Smart entries calculated by 5 great strategies The EA can be run on even a $200
FREE

The Keltner Channel is a volatility-based technical indicator composed of three separate lines. The middle line is an exponential moving average (EMA) of the price. Additional lines are placed above and below the EMA. The upper band is typically set two times the Average True Range (ATR) above the EMA, and the lower band is typically set two times the ATR below the EMA. The bands expand and contract as volatility (measured by ATR) expands and contracts. Since most price action will be encompasse
FREE

This tools is design to easily forecast the projection of the current trend through the inputs of Zigzag and get out of the market when the trend do not the ability to maintain it's volatility to go further... the indicator gets the initial and final price from the value of zigzag automatically by adjusting the intdepth of zigzag. You can also switch from Projection to Extension from the inputs tab of indicator.
FREE
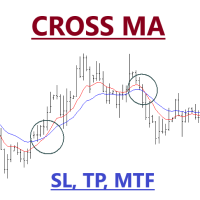
Expert Advisor of Cross two moving averages accompanied by stop loss, take profit and multi timeframes on each moving averages. You can change all the parameters contained in the moving averages
Please use as appropriate, hopefully can be useful and assist you in the transaction Don't forget to give a review if this product helps you
MA Method 0 = simple 1 = exponential 2 = smoothed 3 = LW
FREE
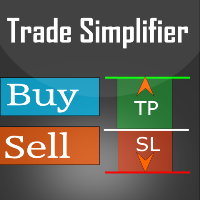
Trade simplifier is a trade panel that simplifies trade opening. It is simple and easy to understand, with key features to ease trading. Features include:
Order type selection Fixed lot entry from the chart user interface Easy Take profit entry field on the chart user interface Visual take profit selection and adjustment via the line that appears when you click the Take Profit button Easy Stop loss entry field in points on the chart user interface Visual Stop Loss selection and adjustment vi
FREE

Lisek Stochastic oscillator indicator with Alarm, Push Notifications and e-mail Notifications. The Stochastic indicator is a momentum indicator that shows you how strong or weak the current trend is. It helps you identify overbought and oversold market conditions within a trend. The Stochastic indicator is lagging indicator, which means it don't predict where price is going, it is only providing data on where price has been !!!
How to trade with Stochastic indicator: Trend following: As lon
FREE

A simple and effective trend indicator. It will be a good assistant when trading. A minimum of understandable settings. Put it on a chart and set it up Good to combine with other indicators. I will post another trend indicator soon. The combination of these two indicators gives good results. Works on all timeframes. Suitable for any couple. Experiment, adjust, observe. Filter by higher timeframes.
FREE

The product Divergence Mom Stoch Adx Bears Bulls is designed to find the differences between indicators and price. It allows you to open orders or set trends using these differences. The indicator has 4 different divergence features.
Divergence types Class A Divergence Class B Divergence Class C Divergence Hidden Divergence
Product Features and Rec ommendations There are 5 indicators on the indicator Indicators = Momentum Stochastic Adx Bears Bulls 4 different divergence types are used
FREE

It's a multi-currency grid and martingale system that can trade all input pairs from one chart. The expert will close all orders for each pair using a profit level. The expert has the possibility to trade up to 100 pairs.
Information
Chose a broker with fast execution and low spreads for effective results. Please make some tests on a demo account to see how the expert works before using it on a real account. For 0.01 lot size and leverage 1:500, you need an initial balance of at least 10,000
FREE

Flex Recovery EA is meant to be almost all the time in the game – everything, but not a boring strategy. It is a countertrend strategy taking trades on the borders of a market volatility channel, combined with highly effective loss compensating algorithm. This strategy is suitable for traders with high risk profile … do not forget that “highly profitable – low risk strategy” is an oxymoron concept. If you want to beat the market at any coast, you must be all in, using aggressive money management
FREE

A Fractal with Grid Trading Expert Advisor (EA) for MetaTrader 4 (MT4) is an automated trading system that combines the use of fractals and grid trading strategies to execute trades in the financial markets. Here's a description of how such an EA typically operates: Fractals : Fractals are geometrical formations on a price chart that indicate potential reversal points in the market. In this EA, fractals are used as a primary signal generator. A bullish fractal occurs when there is a low point wi
FREE

Manually backtesting your strategy or trading system on MT4 Strategy Tester like you do on TradingView, but with free offline history data provided by MT4 or your broker, which means more resposive and much more lower timeframe data available. Because MT4 Strategy Tester doesn't detect mouse events, we will use the MT4 Horizontal Line tool and Arrows tool to modify the TP/SL/Entry and etc. on the screen.
Features:
70% TradingView backtesting user experience, due to the Strategy Tester's li
FREE

Custom Pattern Detector Indicator
This indicator lets you define your own custom pattern instead of the typical candlestick patterns. Everybody already knows about common candlestick patterns like the Doji pattern. This indicator is different though. The pattern you will define is a custom pattern based on CANDLE FORMATIONS . Once the indicator knows the pattern you want it to look for, then it will go through history on the chart and find matching patterns, make them visible to you, and calcul
FREE

This robot is equipped with trend-following logic. Specifically, it detects trends using the Parabolic Indicator and identifies when prices move significantly compared to normal fluctuations. You can input a desired number of pips (Price GAP pips) to determine at what price fluctuation the entry should occur. In case the trend reverses, all open orders will be closed. The number of simultaneous orders you can hold is customizable. Additionally, if you have multiple orders, they will all close o
FREE

One Click Close MT4 is an EA which allows you close orders quickly. EA display on chart two buttons. The first button "Close All Positions" is using to close all opened orders. The second button "Close Profit Positions" is using to close only profitable orders. EA is closing orders for all available symbols, not only for chart symbol. In EA params you can set distance from upper chart frame (Y Offset) and from left chart frame (X Offset). For installation EA it is only need to copy One Click Clo
FREE
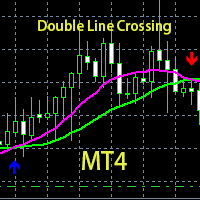
这是基于双均线交叉和箭头标识下单的自定义指标。 当出现蓝色箭头向上时做多单。 当出现红色箭头向下时做空单。 当粉红色线向上穿过绿色线交叉时,粉红色线在上方,绿色线在下方,出现金叉,会出现蓝色箭头。 当粉红色线向下穿过绿色线交叉时,粉红色线在下方,绿色线在上方,出现死叉,会出现红箭头。
这是经典的双线交叉金叉死叉很好的实现,并且用箭头标识出下单点,准确率较高,然后编写出来根据线颜色和箭头很好标识下单方向的指标,无时间,货币对限制。 当前指标最好在30分钟,1小时,4小时上工作,效果较好。 当前指标不建议用在1分钟或5分钟或15分钟或1day以上时间周期,虽然然指标是无限制的,但是效果不太好。 本指标工作平台最好选择点差比较小的交易商。 由于外汇交易是24小时运行,手工下单的话容易受到个人时间和情绪的影响,如果时间不够多的话,建议选择我基于当前指标编写的EA来交易。 基于当前指标编写的EA:https://www.mql5.com/zh/market/product/37133
FREE
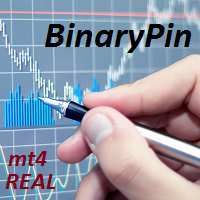
BinaryPin is an indicator developed and adapted specifically for trading short-term binary options. The indicator's algorithm, before issuing the signal, analyzes many factors, such as market volatility, searches for the PinBar pattern, calculates the probability of success when making a deal. The indicator is set in the usual way. The indicator itself consists of an information window where the name of the trading instrument is displayed, the probability of making a successful transaction, the
FREE

I like a simple Robot and I will share with you. I can provide some information about using Simple Moving Average (SMA) as a trading strategy in Forex. SMA is a commonly used technical analysis tool in Forex trading. It calculates the average price of a currency pair over a specified period of time, and the resulting line can be used to identify trends in the market. Traders often use the crossover of different time period SMAs (e.g. 50-day and 200-day) to identify potential buy or sell signals.
FREE

Defining Range ( DR ) and Implied Defining Range ( IDR ) indicator
Show DR and IDR ranges on the chart for Regular , Overnight and After Sessions
for more information how DR and IDR work and the high probability watch : https://www.youtube.com/@themas7er or https://twitter.com/IamMas7er
Remember to set set your chart TimeZone when you attach indicator to the chart under indicator settings / inputs
Volume Imbalance : https://www.mql5.com/en/market/product/91165?source=Site+Pr
FREE

!!!在 [CodeBase] 中,我发布了 Mql4 指标代码。免费下载代码!!! (您必须在更新终端时调整代码)。
该指标是交易者的工具。它显示了所有周期和符号上的随机指标的运动:М1, М5, М15, М30, Н1, Н4 每分钟(从当前到 -240 分钟的时间尺度,即过去 4 小时)。
Step_Stoch 克服了随机指标的缺点——滞后。例如,在 H1(或 M30)下跌后的上升可以在 H1 的 60 分钟后或 M30 的 30 分钟后在通常的随机指标上看到。该指示器会在一分钟内显示此信息,让您获得更好的结果。
您可以将所有随机指标组合在一起并分析它们的走势,以立即做出最佳交易决策,这可能会导致在关闭交易时损失利润或延迟开盘,此时利润(大部分)的可能性已经丧失. Step_Stoch 线可帮助您更快地看到趋势反转过程的开始。
该指标会自动调整为 4 位和 5 位报价、屏幕 DPI、图表的时间刻度。
输入值
KPeriod, DPeriod, Slowing, Mode_, - 标准随机参数。
ColorBack - 背
FREE

ATR Volatility plots the ATR-based volatility, and triggers alerts when it crosses user-defined upper and lower thresholds (purple and tan lines, please see screenshots). Circles are painted when ATR volatility crosses either above the upper threshold, or below the lower threshold. This is a small tool custom-built by our group, by specific request of one of our customers. We hope you enjoy! Do you have an indicator you would like to see designed? Feel free to send us a message! Click here for m
FREE

結合BinaryMiner和Root-Diamond最佳設置的全自動交易平台
內置配置。
1.從存款中自動計算深淵。
2.從多頭或空頭頭寸的結算水平只開一個頭寸
3,在逆勢趨勢下實現無損失的安全性
4個二元指標過濾市場,並確定市場走勢附近的波動。
所有合併配置均保證了長期收入
// ---------可配置參數---------- //
工作頻率M1
1.交易保證金百分比-默認設置為100%
2.自動計算交易量-默認設置為false-如果為true,則顧問將計算全部存款的交易量
3.手動計算交易量-默認設置1-1手/最小手,請諮詢數據提供商
4. LEVEL-交易水平-默認設置1-推薦從10到59
// ----------二進制指標---------- // BOOL_F&BEAR_F-默認設置0-兩種力的推薦設置0-可以採用-20至+20的值
該指示器可預測下一個波動。
BOOL_N&BEAR_N-默認設置0-兩種力的推薦設置5-可以取0到30之間的值
該指示器指示反作用力的強度。
BOOL_C&BEAR_C
FREE

This trend scanner indicator is using two main indicators to identify trends. Frist the EMAs to provide a view on Bullish / Bearish momentum. When the shorter EMA (calculated off more recent price action) crosses, or is above, the slower moving EMA (calculated off a longer period of price action), it suggests that the market is in an uptrend. Second the Stochastic RSI, When RSI is < 20 it is considered oversold, and when > 80 it is overbought. These conditions suggests that momentum is very str
FREE

O Touch VWAP é um indicador que permite calcular uma Média Ponderada por Volume (VWAP) apenas apertando a tecla 'w' no seu teclado e após clicando no candle do qual deseja realizar o calculo, clicando abaixo do candle é calculada a VWAP baseado na minima dos preços com o volume, clicando sobre o corpo do candle é calculado uma VWAP sobre o preço medio com o volume e clicando acima do candle é calculado uma VWAP baseado na máxima dos preços com o volume, voce tambem tem a opção de remover a VWAP
FREE

This indicator is designed for calculating the value of points for the specified lot sizes. The MT5 version is here https://www.mql5.com/en/market/product/29230 Description by lines Line 1 - deposit currency. Line 2 - lot size (10 input parameters) . All further values are calculated into columns below each lot size. Line 3 - calculation of value for one point. Line 4 - calculation of value for spread. All subsequent lines - calculation of value for points (20 input parameters) . All you need t
FREE

图表覆盖 指标在同一张图表上显示几种工具的价格走势,使您能够评估货币对相对彼此波动的差异。 [ 安装指南 | 更新指南 | 故障排除 | 常见问题 | 所有产品 ]
轻松找到超买或超卖的货币对 在同一图表上绘制最多六个货币对 必要时显示倒置符号 适应图表大小,缩放和时间表 自动价格水平计算 可定制的价格水平密度 可自定义的颜色和尺寸
什么是反向货币对? 反转货币对意味着显示两种货币之间的汇率,从而反转交易的主要货币。例如,如果要将EURUSD,GBPUSD和USDJPY绘制到同一覆盖图中,则有必要反转USDJPY以使价格反映反向汇率:JPYUSD。这样,日元/美元价格将与覆盖图的其他两个符号呈正相关关系移动,从而使图表更易于研究。
测试指标 该指标使用来自多个交易品种的价格数据绘制单个图表。由于MetaTrader 4测试仪(在撰写本文时)不支持多货币回溯测试,因此该指标无法回溯测试,因为它将不会收到来自其他本应覆盖的交易品种的报价。要测试它,请租用一个月。
输入 符号设置-键入要在覆盖图上显示的货币对或符号的名称。您需要至少输入其中之一,以便覆盖图具有两个货币对
FREE
Highly configurable Moving average indicator.
Features: Highly customizable alert functions (at levels, crosses, direction changes via email, push, sound, popup) Multi timeframe ability Color customization (at levels, crosses, direction changes) Linear interpolation option Works on strategy tester in multi timeframe mode (at weekend without ticks also) Parameters:
MA Timeframe: You can set the lower/higher timeframes for Ma. MA Bar Shift: Y ou can set the offset of the line drawing. MA Perio
FREE

The EU_H1_110155136_S_Bi_CF_SQ3 is an algorithmic trading strategy for MetaTrader, tested on EURUSD using the H1 timeframe from April 1, 2004, to April 24, 2024. There is no need to set up parameters, all settings are already optimized and fine-tuned.
Recommended broker RoboForex because of EET timezone.
You can find the strategy source code for StrategyQuant at the link: http://quantmonitor.net/listing/eurusd-biggest-range-pulse/
Key details are:
Main Chart: Current symbol and time
FREE

The Supertrend Line indicator shows you the trend using calculation based on the ATR.
How does it work? The Supertrend draws a line following the current trend, this line is the result of calculation made with the ATR. A Line under the candle means a likely bullish trend A Line above the candle means a likely bearish trend
How to trade with CSL indicator Buy when the Supertrend line is below the price, Sell when the Supertrend line is above the price. It is strongly suggested to use this ind
FREE

The Currency Strength Lines (CSL) indicator is a very useful tool for both beginners and experienced traders. It is able to calculate the strength of single currencies and show them on a chart, so that you can see the trend and spot trading opportunities.
How does it work? The CSL Indicator will run calculations on all the 28 pairs, resulting in the overall strength across the market of individual currencies at any given moment. You can use this data to spot currencies that are strong, getting
FREE

The HedgeFund Experiment This is a basic version of the professional version; The HedgeFund Manager https://www.mql5.com/en/market/product/85241 It is a multi-currency EA that needs only to be loaded in one chart. It will access all Forex pairs or CFD provided by your broker and will only trade those with a spread less than or equal to MaxSpread specified in the settings. It uses standard Metatrader4 indicators to generate signals but with a customized trend filter to pick which pairs to includ
FREE

MT4 Candlestick Pattern Alert Indicator: Stay Ahead of Trading Opportunities Overview The MT4 Candlestick Pattern Alert Indicator is a robust tool designed to empower traders by detecting candlestick patterns and delivering timely alerts through notifications, emails, and pop-up alerts. This invaluable tool saves traders precious time, allowing focused analysis on patterns and potential profitable trades. Importance of Candlestick Patterns Candlestick patterns are pivotal in technical analysis,
FREE
Arrow Indicator Trade EA is an Expert Adviser who trades based on custom indicators. When the indicator shows an arrow up, EA will enter into an OP BUY order. Likewise, when the indicator shows an arrow down, EA will make an OP SELL entry. Features: 1. Stop Loss and Manual and Auto TP based on the ATR indicator. 2. Auto Lot and Fixed Lot. 3. Close By Loss and Close By Profit features. 4. Target Profit Balance and Minimum Stop Balance 5. Easy to use. EA does not generate its own signals but gener
FREE

BeST_ Classic Pivot Points is an MT4 Indicator that is based on the widely known and definitely classic Pivot Point of a market prices activity. A pivot point is calculated as an average of significant prices (high,low,close) from the performance of a market in the prior trading period. If the market in the following period trades above the pivot point it is usually evaluated as a bullish sentiment, whereas trading below the pivot point is seen as bearish. A pivot point and the associated suppo
FREE

Общие сведения Для начала торговли достаточно небольшого депозита. Идеален для быстрого разгона депозита!!! Подходит для мультивалютной торговли. Невосприимчивость к большой задержке и величине спреда.
Принцип работы После запуска советника на графике советник запоминает уровень открытия первого ордера. Выше уровня открытия первого ордера советник выставляет сеть ордеров на Sell . Ниже уровня открытия первого ордера советник выставляет сеть ордеров на Buy . Если общая прибыль ордеров на поку
FREE
The Fractal LVL AM indicator analyzes the price patterns that form on the candlestick chart and display the turning points of the market trend. A fractal consists of candles, the middle of which is either the highest (upward fractal) or the lowest (downward fractal) of all the candles taken for analysis. Unlike the original indicator where fractals are formed by five candles (maximum/minimum in the center and two candles with smaller/larger maximum/minimum values on each side), the proposed ve
FREE

This indicator is a simple tool to spot a possible trend.
When the ribbon below the price bars, It will turn to Green color and the trend is seen to be bullish When the ribbon above the price bars, it will turn to Red color and the trend is seen to be bearish. It can be used a either Entry Signal Exit Signal or trailing stop, so it is very versatile. By default color : Green is UP trend and Red is Down trend and this work perfect with Bar4Colors.ex4
FREE
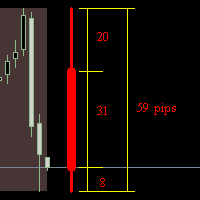
The indicator 'draws' a daily, weekly or monthly candlestick on the current chart. Shows in points the sizes of the upper and lower shadows, the body and the entire candlestick. Real time work. Works in the strategy tester. Indicator parameters: How_much_to_show - how many blocks to show. Block_period - block period (day / week / month) Shift - shift from the edge of the chart in bars. language - language selection.
FREE

Advanced grid - Просто советник с минимальными настройками, позволяющий вести торговлю с помощью сетки ордеров. Советник не использует индикаторов.
Настройки : Period - Таймфрейм графика. LotRisk - Автоматическое определение лот. Если LotRisk =0, то не работает. Lot - Фиксированный лот. Level - Ценовой уровень между ордерами ( в пунктах). OrdersClose - Частичное закрытие ордеров. Параметр от 0 до 3. OrdersClose =0 - Отключено. OrdersClose =1 - Для всех типов ордеров. Закрываем один ордер
FREE

This indicator evaluates the market sentiment using raw price action measurements, and it is an amazing trading confirmation. It can be used to take a trend-trade approach or a contrarian approach using reversal patterns. [ Installation Guide | Update Guide | Troubleshooting | FAQ | All Products ] Find early reversals Confirm short-term trades Detect indecision on the market Take contrarian trades near support and resistance levels Trade inside bars confirmed by overall direction of the market T
FREE
MetaTrader市场是 出售自动交易和技术指标的最好地方。
您只需要以一个有吸引力的设计和良好的描述为MetaTrader平台开发应用程序。我们将为您解释如何在市场发布您的产品将它提供给数以百万计的MetaTrader用户。
您错过了交易机会:
- 免费交易应用程序
- 8,000+信号可供复制
- 探索金融市场的经济新闻
注册
登录