在图表上快速检验交易理念
简介
第六届自动交易锦标赛终于升起帷幕。在最初的兴奋过去后,我们终于可以稍微放松一点,研究提交的交易机器人。我决定做一点调查研究,找出现代交易机器人最显著的特征,并明确什么是我们可以从它们的交易活动所期待的。
事实证明,这相当困难。因此,我的计算不能说是毫发无差或尽善尽美,毕竟我有的只是“EA 交易”的说明和开发人员寥寥数语的注释。然而,我们仍然能够得出结论,下面是我的计算结果:锦标赛共计有 451 例参赛“EA 交易”,但只有其中的 316 例包含有意义的说明。其余“EA 交易”的说明尽是对开发人员的朋友和家人的问候、对地外文明的问候或自我赞许。
ATC 2012 最受欢迎策略:
- 使用各种图形结构(重要价格水平、支撑位和阻力位、通道)交易– 55;
- 价格变动分析(针对各种时间表)– 33;
- 趋势追踪系统(我猜,这些大话隐藏了一些过度乐观的移动平均线组合,但也许是我错了):)- 31;
- 统计价格模式 – 10;
- 仲裁、交易品种相关分析 – 8;
- 波动分析 – 8;
- 神经网络 – 7;
- 烛形分析 – 5;
- 平均线 – 5;
- 策略包 – 5;
- 交易时段时间 – 4;
- 随机数生成器 – 4;
- 交易新闻 – 3;
- 艾略特波浪 – 2。
当然,指标策略照惯例是最受欢迎的。很难定义每个特定指标在一个特定“EA 交易”中的角色,但估计它们使用的绝对数量是可能的:
- 移动平均线 – 75;
- MACD – 54;
- 随机摆动 – 25;
- RSI – 23;
- 布林带 – 19;
- 分形 – 8;
- CCI、ATR – 各 7 个指标;
- 峰谷、抛物线转向 – 各 6 个指标;
- ADX – 5;
- 动量 – 4;
- 自定义指标(相当引人入胜 :))- 4;
- Ichimoku、AO – 各 3 个指标;
- ROC、WPR、StdDev、交易量 – 各 2 个指标。
数据表明了下述结论 - 大部分参赛者使用交易跟随策略和指标。或许,我在收集数据时有所疏漏,我们将见证自动交易领域中杰出人物的横空出世 - 但目前似乎是不可能的。我认为主要的问题在于,受市场吸引而来的新人被灌输的多是规则而不是知识。
例如,这些是使用 MACD 的规则,这些是信号 - 现在,最优化参数和赚钱!多动一点脑筋怎么样?多此一举!标准已经建立!为什么要推倒重来?然而,我们常常忘记,现在如此流行的指标也是像您我这样的交易人员所开发!他们也有自己的标准和权威。也许,以您的名字冠名的新指标在数十年后也会成为标准。
我愿意分享我的交易理念探寻方法,以及用于快速检验这些理念的方法。
方法说明
所有技术分析都基于一个简单的道理 - 价格反映一切。但有一个问题 - 这种说法缺乏力度。我们将目光转向图表并看到一个静态图像:价格实际上反映了所有一切。然而,我们希望知道价格在未来某个时期内将反映什么以及它的走向,这样我们就能盈利。源于价格的指标正是设计用于预测可能的未来变动。
我们从物理学得知,量值的一阶导数是速率。因此,指标计算当前价格的变化速率。我们还知道,较大的量级具有较大惯性,在无相当大的外力干涉下,可阻止速率的值大起大落。这就是我们逐渐接近趋势 - 在外力(新闻、中央银行的政策等)未影响市场的时段内当其一阶导数(速率)保持其值时的价格状态 - 概念的方式。
但是,让我们返回我们的起点 - 价格反映一切。要探寻新的理念,我们应研究同一时间间隔的价格的行为及其派生物。只有仔细研究价格图表,才能将您的交易从盲目跟风上升到真正理解的程度。
这可能不会为交易结果带来立竿见影的效果,但解答无数为什么问题的能力迟早将起到积极作用。此外,对图表和指标的视觉分析将使您找到一些价格和指标之间的全新的相关性 - 这是它们的开发者完全没有预料到的。
假设您发现一个似乎对您有利的新的相关性。下一步做什么呢?最简单的方法是编写一个“EA 交易”并用历史数据对其进行测试,确保您的设想是正确的。如果事实并非如此,我们需要选择一种常用的最优化参数的方法。最糟糕的就是,我们无法回答这个为什么问题。为什么我们的“EA 交易”最后亏损/盈利?为什么会有如此巨大的亏损?没有答案,您无法有效地实现您的想法。
可执行下述操作以看到从图表获得的相关性的结果:
- 创建或更改必要指标,以使其生成一个信号:-1 为卖出,1 为买入。
- 连接显示进入点和退出点的余额指标到图表。该指标还显示当处理信号时,余额和资产净值(点位)的变更。
- 分析在何种情形和状况下假设成立。
该方法具有一定的优势。
- 首先,余额指标完全使用 OnCalculate 方法计算,该方法具有最大计算速度并自动在输入计算数组中提供历史数据。
- 其次,添加信号至现有指标是通过向导创建“EA 交易”和创建自己的“EA 交易”的过渡步骤。
- 再次,可以在单个图表上查看想法和最终结果。当然,该方法也有一些局限性:信号与柱的收盘价相关联、余额的计算针对固定手数、未提供使用挂单交易的选项。然而,所有这些局限性可轻松解决/改善。
实现
我们开发一个简单的信号指标以了解它是如何工作的,并评估该方法的便捷性。我很早就听说过烛形模式。所以,为什么不检查一下它们的实际工作情况?我选择“锤线”和“射击之星”反向模式分别作为买入和卖出信号。下图显示了它们的示意外观:
图 1. “锤线”和“射击之星”烛形模式
现在,我们来定义当“锤线”模式出现时的市场进入规则。
- 烛形的最小值应小于前五个烛形的最小值;
- 烛形的主体不应超过它的总高度的 50%;
- 烛形的上影线不应超过它的总高度的 0%;
- 烛形的高度不应小于前五个烛形的平均高度的 100%。
- 模式的收盘价应小于 10-周期移动平均线。
如果满足这些条件,我们应建立买入持仓。针对“射击之星”模式的规则是一样的。惟一的区别是我们应建立卖出持仓:
- 烛形的最大值应大于前五个烛形的最大值;
- 烛形的主体不应超过它的总高度的 50%;
- 烛形的下影线不应超过它的总高度的 0%;
- 烛形的高度不应小于前五个烛形的平均高度的 100%。
- 模式的收盘价应大于 10-周期移动平均线。
对于我在图形上使用的未来可进行最优化的参数,我用粗体进行了标示(如果模式显示可接受的结果)。我希望实施的限制允许我们从具有不恰当外观的信号 (pp.1-3) 以及无法视作信号的已知弱信号清除模式。
此外,我们应确定退出时机。由于提到的模式作为趋势反向信号出现,适当烛形出现时趋势存在。因此,追逐价格的移动平均线也将出现。退出信号通过穿越价格及其 10-周期移动平均线形成。
现在,是时候编写一些代码了。我们在 MQL5 向导中开发一个新的自定义指标,将其命名为 PivotCandles 并说明它的功用。让我们定义返回值以连接余额指标:
- -1 – 卖出仓位开仓;
- -2 – 买入仓位平仓;
- 0 - 无信号;
- 1 – 买入仓位开仓;
- 2 – 卖出仓位平仓。
就像您所知道的那样,真正的程序员不会寻找简单的方法,他们寻找最简单的方法。:) 我也不例外。一边通过耳机聆听音乐,一边品尝香浓的咖啡,我完成了包含要在指标和“EA 交易”(我打算基于指标开发它的情形)中实施的类的文件。也许,甚至可以对它进行修改以用于其他烛形模式。代码本身乏新可陈。我相信代码所附的注释涵盖了任何可能的问题。
//+------------------------------------------------------------------+
//|                                            PivotCandlesClass.mqh |
//|                        Copyright 2012, MetaQuotes Software Corp. |
//|                                              http://www.mql5.com |
//+------------------------------------------------------------------+
#property copyright "Copyright 2012, MetaQuotes Software Corp."
#property link      "http://www.mql5.com"
//+------------------------------------------------------------------+
//| Input parameters                                                 |
//+------------------------------------------------------------------+
input int      iMaxBodySize            = 50;  // Maximum candle body, %
input int      iMaxShadowSize          = 0;   // Maximum allowed candle shadow, %
input int      iVolatilityCandlesCount = 5;   // Number of previous bars for calculation of an average volatility
input int      iPrevCandlesCount       = 5;   // Number of previous bars, for which the current bar should be an extremum
input int      iVolatilityPercent      = 100; // Correlation of a signal candle with a previous volatility, %
input int      iMAPeriod               = 10;  // Period of a simple signal moving average
//+------------------------------------------------------------------+
//| Class definition                                                 |
//+------------------------------------------------------------------+
class CPivotCandlesClass
  {
private:
   MqlRates          m_candles[];              // Array for storing the history necessary for calculations
   int               m_history_depth;          // Array length for storing the history
   int               m_handled_candles_count;  // Number of the already processed candles

   double            m_ma_value;               // Current calculated moving average value
   double            m_prev_ma_value;          // Previous calculated moving average value
   bool              m_is_highest;             // Check if the current candle is the highest one
   bool              m_is_lowest;              // Check if the current candle is the lowest one
   double            m_volatility;             // Average volatility
   int               m_candle_pattern;         // Current recognized pattern

   void              PrepareArrayForNewCandle();        // Prepare the array for accepting the new candle
   int               CheckCandleSize(MqlRates &candle); // Check the candle for conformity with patterns
   void              PrepareCalculation();
protected:
   int               DoAnalizeNewCandle();              // Calculation function
public:
   void              CPivotCandlesClass();

   void              CleanupHistory();                  // Clean up all calculation variables
   double            MAValue() {return m_ma_value;}     // Current value of the moving average
   int               AnalizeNewCandle(MqlRates& candle);
   int               AnalizeNewCandle( const datetime time,
                                       const double open,
                                       const double high,
                                       const double low,
                                       const double close,
                                       const long tick_volume,
                                       const long volume,
                                       const int spread );
  };
//+------------------------------------------------------------------+
//| CPivotCandlesClass                                               |
//+------------------------------------------------------------------+
//| Class initialization                                             |
//+------------------------------------------------------------------+
void CPivotCandlesClass::CPivotCandlesClass()
  {
   // History depth should be enough for all calculations
   m_history_depth = (int)MathMax(MathMax(
      iVolatilityCandlesCount + 1, iPrevCandlesCount + 1), iMAPeriod);
   m_handled_candles_count = 0;
   m_prev_ma_value = 0;
   m_ma_value = 0;

   ArrayResize(m_candles, m_history_depth);
  }
//+------------------------------------------------------------------+
//| CleanupHistory                                                   |
//+------------------------------------------------------------------+
//| Clean up the candle buffer for recalculation                     |
//+------------------------------------------------------------------+
void CPivotCandlesClass::CleanupHistory()
  {
   // Clean up the array
   ArrayFree(m_candles);
   ArrayResize(m_candles, m_history_depth);

   // Null calculation variables
   m_handled_candles_count = 0;
   m_prev_ma_value = 0;
   m_ma_value = 0;
  }
//+-------------------------------------------------------------------+
//| AnalizeNewCandle                                                  |
//+-------------------------------------------------------------------+
//| Preparations for analyzing the new candle and the analysis itself |
//| based on candle's separate parameter values                       |
//+-------------------------------------------------------------------+
int CPivotCandlesClass::AnalizeNewCandle( const datetime time,
                                          const double open,
                                          const double high,
                                          const double low,
                                          const double close,
                                          const long tick_volume,
                                          const long volume,
                                          const int spread )
  {
   // Prepare the array for the new candle
   PrepareArrayForNewCandle();

   // Fill out the current value of the candle
   m_candles[0].time          = time;
   m_candles[0].open          = open;
   m_candles[0].high          = high;
   m_candles[0].low           = low;
   m_candles[0].close         = close;
   m_candles[0].tick_volume   = tick_volume;
   m_candles[0].real_volume   = volume;
   m_candles[0].spread        = spread;

   // Check if there is enough data for calculation
   if (m_handled_candles_count < m_history_depth)
      return 0;
   else
      return DoAnalizeNewCandle();
  }
//+-------------------------------------------------------------------+
//| AnalizeNewCandle                                                  |
//+-------------------------------------------------------------------+
//| Preparations for analyzing the new candle and the analysis itself |
//| based on the received candle                                      |
//+-------------------------------------------------------------------+
int CPivotCandlesClass::AnalizeNewCandle(MqlRates& candle)
  {
   // Prepare the array for the new candle
   PrepareArrayForNewCandle();

   // Add the candle
   m_candles[0] = candle;

   // Check if there is enough data for calculation
   if (m_handled_candles_count < m_history_depth)
      return 0;
   else
      return DoAnalizeNewCandle();
  }
//+------------------------------------------------------------------+
//| PrepareArrayForNewCandle                                         |
//+------------------------------------------------------------------+
//| Prepare the array for the new candle                             |
//+------------------------------------------------------------------+
void CPivotCandlesClass::PrepareArrayForNewCandle()
  {
   // Shift the array by one position to write the new value there
   ArrayCopy(m_candles, m_candles, 1, 0, m_history_depth-1);

   // Increase the counter of added candles
   m_handled_candles_count++;
  }
//+------------------------------------------------------------------+
//| CalcMAValue                                                      |
//+------------------------------------------------------------------+
//| Calculate the current values of the Moving Average, volatility   |
//|   and the value extremality                                      |
//+------------------------------------------------------------------+
void CPivotCandlesClass::PrepareCalculation()
  {
   // Store the previous value
   m_prev_ma_value = m_ma_value;
   m_ma_value = 0;

   m_is_highest = true; 	// check if the current candle is the highest one
   m_is_lowest = true;  	// check if the current candle is the lowest one
   m_volatility = 0;  	// average volatility

   double price_sum = 0; // Variable for storing the sum
   for (int i=0; i<m_history_depth; i++)
     {
      if (i<iMAPeriod)
         price_sum += m_candles[i].close;
      if (i>0 && i<=iVolatilityCandlesCount)
         m_volatility += m_candles[i].high - m_candles[i].low;
      if (i>0 && i<=iPrevCandlesCount)
        {
         m_is_highest = m_is_highest && (m_candles[0].high > m_candles[i].high);
         m_is_lowest = m_is_lowest && (m_candles[0].low < m_candles[i].low);
        }
     }
   m_ma_value = price_sum / iMAPeriod;
   m_volatility /= iVolatilityCandlesCount;

   m_candle_pattern = CheckCandleSize(m_candles[0]);
  }
//+------------------------------------------------------------------+
//| CheckCandleSize                                                  |
//+------------------------------------------------------------------+
//| Check if the candle sizes comply with the patterns               |
//| The function returns:                                            |
//|   0 - if the candle does not comply with the patterns            |
//|   1 - if "hammer" pattern is detected                            |
//|   -1 - if "shooting star" pattern is detected                    |
//+------------------------------------------------------------------+
int CPivotCandlesClass::CheckCandleSize(MqlRates &candle)
  {
   double candle_height=candle.high-candle.low;          // candle's full height
   double candle_body=MathAbs(candle.close-candle.open); // candle's body height

   // Check if the candle has a small body
   if(candle_body/candle_height*100.0>iMaxBodySize)
      return 0;

   double candle_top_shadow=candle.high-MathMax(candle.open,candle.close);   // candle upper shadow height
   double candle_bottom_shadow=MathMin(candle.open,candle.close)-candle.low; // candle bottom shadow height

   // If the upper shadow is very small, that indicates the "hammer" pattern
   if(candle_top_shadow/candle_height*100.0<=iMaxShadowSize)
      return 1;
   // If the bottom shadow is very small, that indicates the "shooting star" pattern
   else if(candle_bottom_shadow/candle_height*100.0<=iMaxShadowSize)
      return -1;
   else
      return 0;
  }
//+------------------------------------------------------------------+
//| DoAnalizeNewCandle                                               |
//+------------------------------------------------------------------+
//| Real analysis of compliance with the patterns                    |
//+------------------------------------------------------------------+
int CPivotCandlesClass::DoAnalizeNewCandle()
  {
   // Prepare data for analyzing the current situation
   PrepareCalculation();

   // Process prepared data and set the exit signal
   int signal = 0;

   ///////////////////////////////////////////////////////////////////
   // EXIT SIGNALS                                                  //
   ///////////////////////////////////////////////////////////////////
   // If price crosses the moving average downwards, short position is closed
   if(m_candles[1].close > m_prev_ma_value && m_candles[0].close < m_ma_value)
      signal = 2;
   // If price crosses the moving average upwards, long position is closed
   else if (m_candles[1].close < m_prev_ma_value && m_candles[0].close > m_ma_value)
      signal = -2;

   ///////////////////////////////////////////////////////////////////
   // ENTRY SIGNALS                                                 //
   ///////////////////////////////////////////////////////////////////
   // Check if the minimum volatility condition is met
   if (m_candles[0].high - m_candles[0].low >= iVolatilityPercent / 100.0 * m_volatility)
     {
      // Checks for "shooting star" pattern
      if (m_candle_pattern < 0 && m_is_highest && m_candles[0].close > m_ma_value)
         signal = -1;
      // Checks for "hammer" pattern
      else if (m_candle_pattern > 0 && m_is_lowest && m_candles[0].close < m_ma_value)
         signal = 1;
     }

   return signal;
  }
//+------------------------------------------------------------------+
我们可以看到,整个计算部分由 CPivotCandlesClass 类执行。大家普遍认为将计算部分和可视化部分分开是一个良好的编程习惯,我会尽力遵循这一建议。好处即可体现出来 - 下面是指标本身的代码:
//+------------------------------------------------------------------+
//|                                                 PivotCandles.mq5 |
//|                        Copyright 2012, MetaQuotes Software Corp. |
//|                                              http://www.mql5.com |
//+------------------------------------------------------------------+
#property copyright "Copyright 2012, MetaQuotes Software Corp."
#property link      "http://www.mql5.com"
#property version   "1.00"
#property indicator_chart_window

// Use four buffers, while drawing two
#property indicator_buffers 4
#property indicator_plots   2
//--- plot SlowMA
#property indicator_label1  "SlowMA"
#property indicator_type1   DRAW_LINE
#property indicator_color1  clrAliceBlue
#property indicator_style1  STYLE_SOLID
#property indicator_width1  1
//--- plot ChartSignal
#property indicator_label2  "ChartSignal"
#property indicator_type2   DRAW_COLOR_ARROW
#property indicator_color2  clrLightSalmon,clrOrangeRed,clrBlack,clrSteelBlue,clrLightBlue
#property indicator_style2  STYLE_SOLID
#property indicator_width2  3

#include <PivotCandlesClass.mqh>
//+------------------------------------------------------------------+
//| Common arrays and structures                                     |
//+------------------------------------------------------------------+
//--- Indicator buffers
double   SMA[];            // Values of the Moving Average
double   Signal[];         // Signal values
double   ChartSignal[];    // Location of signals on the chart
double   SignalColor[];    // Signal color array
//--- Calculation class
CPivotCandlesClass PivotCandlesClass;
//+------------------------------------------------------------------+
//| Custom indicator initialization function                         |
//+------------------------------------------------------------------+
int OnInit()
  {
//--- indicator buffers mapping
   SetIndexBuffer(0,SMA,INDICATOR_DATA);
   SetIndexBuffer(1,ChartSignal,INDICATOR_DATA);
   SetIndexBuffer(2,SignalColor,INDICATOR_COLOR_INDEX);
   SetIndexBuffer(3,Signal,INDICATOR_CALCULATIONS);

//--- set 0 as an empty value
   PlotIndexSetDouble(1,PLOT_EMPTY_VALUE,0);

   return(0);
  }
//+------------------------------------------------------------------+
//| Custom indicator iteration function                              |
//+------------------------------------------------------------------+
int OnCalculate(const int rates_total,
                const int prev_calculated,
                const datetime &time[],
                const double &open[],
                const double &high[],
                const double &low[],
                const double &close[],
                const long &tick_volume[],
                const long &volume[],
                const int &spread[])
  {
   // If there have not been calculations yet or (!) the new history is uploaded, clean up the calculation object
   if (prev_calculated == 0)
      PivotCandlesClass.CleanupHistory();

   int end_calc_edge = rates_total-1;
   if (prev_calculated >= end_calc_edge)
      return end_calc_edge;

   for(int i=prev_calculated; i<end_calc_edge; i++)
     {
      int signal = PivotCandlesClass.AnalizeNewCandle(time[i],open[i],high[i],low[i],close[i],tick_volume[i],volume[i],spread[i]);
      Signal[i] = signal;
      SMA[i] = PivotCandlesClass.MAValue();

      // Signals are processed, display them on the chart
      // Set the location of our signals...
      if (signal < 0)
         ChartSignal[i]=high[i];
      else if (signal > 0)
         ChartSignal[i]=low[i];
      else
         ChartSignal[i]=0;
      // .. as well as their color
      // Signals have a range of [-2..2], while color indices - [0..4]. Align them
      SignalColor[i]=signal+2;
     }

   // Set the Moving Average value similar to the previous one to prevent it from sharp fall
   SMA[end_calc_edge] = SMA[end_calc_edge-1];

//--- return value of prev_calculated for next call
   return(end_calc_edge);
  }
//+------------------------------------------------------------------+
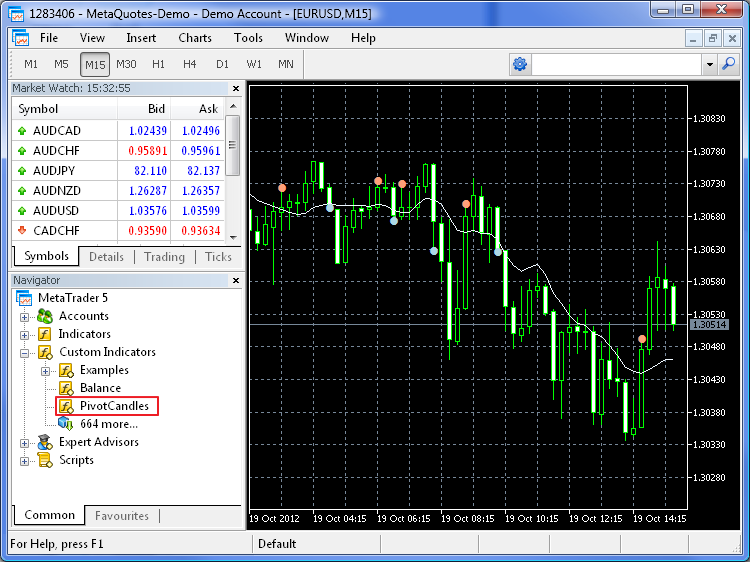
指标准备就绪。现在,让我们在任意图表上对其进行测试。为此,在图表上配置编译过的指标。之后,我们将看到与下图所示类似的画面。

图 2. “锤线”和“射击之星”烛形模式指标
彩色标注的点表示可能的市场进入和退出点。色彩代表的意义如下所示:
- 深红 – 卖出;
- 深蓝 – 买入;
- 浅红 – 买入持仓平仓;
- 浅红 – 卖出持仓平仓。
平仓信号在每次价格到达其移动平均线时形成。如果在那一刻没有仓位,该信号被忽略。
现在,让我们回到本文的主题。我们具有含信号缓冲区的指标,这些缓冲区仅生成某些特定信号。我们在同一图表的单独窗口中显示如果实际追踪,这些信号将如何盈利/亏损。该指标正是针对这种情形而开发。它可连接至其他指标,并基于输入信号开仓/平仓虚拟仓位。
类似于上一个指标的处理方式,我们应将代码分为两部分 - 计算部分和可视化部分。下面是一个不眠之夜的结果,但我希望它是值得的。 :)
//+------------------------------------------------------------------+
//|                                                 BalanceClass.mqh |
//|                        Copyright 2012, MetaQuotes Software Corp. |
//|                                              http://www.mql5.com |
//+------------------------------------------------------------------+
#property copyright "Copyright 2012, MetaQuotes Software Corp."
#property link      "http://www.mql5.com"
//+------------------------------------------------------------------+
//| Common structures                                                |
//+------------------------------------------------------------------+
// Structure for returning calculation results
// using only return command;
struct BalanceResults
  {
   double balance;
   double equity;
  };
//+------------------------------------------------------------------+
//| Common function                                                  |
//+------------------------------------------------------------------+
//  Function for searching for the indicator handle by its name
int FindIndicatorHandle(string _name)
  {
   // Receive the number of open charts
   int windowsCount = (int)ChartGetInteger(0,CHART_WINDOWS_TOTAL);

   // Search all of them
   for(int w=windowsCount-1; w>=0; w--)
     {
      // How many indicators are attached to the current chart
      int indicatorsCount = ChartIndicatorsTotal(0,w);

      // Search by all chart indicators
      for(int i=0;i<indicatorsCount;i++)
        {
         string name = ChartIndicatorName(0,w,i);
         // If such an indicator is found, return its handle
         if (name == _name)
            return ChartIndicatorGet(0,w,name);
        }
     }

   // If there is no such an indicator, return the incorrect handle
   return -1;
  }
//+------------------------------------------------------------------+
//| Base calculation class                                           |
//+------------------------------------------------------------------+
class CBaseBalanceCalculator
  {
private:
   double            m_position_volume; // Current open position volume
   double            m_position_price;  // Position opening price
   double            m_symbol_points;   // Value of one point for the current symbol
   BalanceResults    m_results;         // Calculation results
public:
   void              CBaseBalanceCalculator(string symbol_name = "");
   void              Cleanup();
   BalanceResults    Calculate( const double _prev_balance,
                                const int    _signal,
                                const double _next_open,
                                const double _next_spread );
  };
//+------------------------------------------------------------------+
//| CBaseBalanceCalculator                                           |
//+------------------------------------------------------------------+
void CBaseBalanceCalculator::CBaseBalanceCalculator(string symbol_name = "")
  {
   // Clean up state variables
   Cleanup();

   // Define point size (because we will calculate the profit in points)
   if (symbol_name == "")
      m_symbol_points = SymbolInfoDouble(Symbol(), SYMBOL_POINT);
   else
      m_symbol_points = SymbolInfoDouble(symbol_name, SYMBOL_POINT);
  }
//+------------------------------------------------------------------+
//| Cleanup                                                          |
//+------------------------------------------------------------------+
//| Clean up data on positions and prices                            |
//+------------------------------------------------------------------+
void CBaseBalanceCalculator::Cleanup()
  {
   m_position_volume = 0;
   m_position_price = 0;
  }
//+------------------------------------------------------------------+
//| Calculate                                                        |
//+------------------------------------------------------------------+
//| Main calculation block                                           |
//+------------------------------------------------------------------+
BalanceResults CBaseBalanceCalculator::Calculate(
                                       const double _prev_balance,
                                       const int _signal,
                                       const double _next_open,
                                       const double _next_spread )
  {
   // Clean up the output structure from the previous values
   ZeroMemory(m_results);

   // Initialize additional variables
   double current_price = 0; // current price (bid or ask depending on position direction)
   double profit = 0;        // profit calculated value

   // If there was no signal, the balance remains the same
   if (_signal == 0)
      m_results.balance = _prev_balance;
   // the signal coincides with the direction or no positions are opened yet
   else if (_signal * m_position_volume >= 0)
     {
      // Position already exists, the signal is ignored
      if (m_position_volume != 0)
         // Balance is not changed
         m_results.balance = _prev_balance;
      // No positions yet, buy signal

      else if (_signal == 1)
        {
         // Calculate current ASK price, recalculate price, volume and balance
         current_price = _next_open + _next_spread * m_symbol_points;
         m_position_price = (m_position_volume * m_position_price + current_price) / (m_position_volume + 1);
         m_position_volume = m_position_volume + 1;
         m_results.balance = _prev_balance;
        }
      // No positions yet, sell signal
      else if (_signal == -1)
        {
         // Calculate current BID price, recalculate price, volume and balance
         current_price = _next_open;
         m_position_price = (-m_position_volume * m_position_price + current_price) / (-m_position_volume + 1);
         m_position_volume = m_position_volume - 1;
         m_results.balance = _prev_balance;
        }
      else
         m_results.balance = _prev_balance;
     }
   // Position is set already, the opposite direction signal is received
   else
     {
      // buy signal/close sell position
      if (_signal > 0)
        {
         // Close position by ASK price, recalculate profit and balance
         current_price = _next_open + _next_spread * m_symbol_points;
         profit = (current_price - m_position_price) / m_symbol_points * m_position_volume;
         m_results.balance = _prev_balance + profit;

         // If there is a signal for opening a new position, open it at once
         if (_signal == 1)
           {
            m_position_price = current_price;
            m_position_volume = 1;
           }
         else
            m_position_volume = 0;
        }
      // sell signal/close buy position
      else
        {
         // Close position by BID price, recalculate profit and balance
         current_price = _next_open;
         profit = (current_price - m_position_price) / m_symbol_points * m_position_volume;
         m_results.balance = _prev_balance + profit;

         // If there is a signal for opening a new position, open it at once
         if (_signal == -1)
           {
            m_position_price = current_price;
            m_position_volume = -1;
           }
         else
           m_position_volume = 0;
        }
     }

   // Calculate the current equity
   if (m_position_volume > 0)
     {
      current_price = _next_open;
      profit = (current_price - m_position_price) / m_symbol_points * m_position_volume;
      m_results.equity = m_results.balance + profit;
     }
   else if (m_position_volume < 0)
     {
      current_price = _next_open + _next_spread * m_symbol_points;
      profit = (current_price - m_position_price) / m_symbol_points * m_position_volume;
      m_results.equity = m_results.balance + profit;
     }
   else
      m_results.equity = m_results.balance;

   return m_results;
  }
//+------------------------------------------------------------------+
计算类准备就绪。现在,我们来实现指标的显示,以查看它是如何工作的。
//+------------------------------------------------------------------+
//|                                                      Balance.mq5 |
//|                        Copyright 2012, MetaQuotes Software Corp. |
//|                                              http://www.mql5.com |
//+------------------------------------------------------------------+
#property copyright "Copyright 2012, MetaQuotes Software Corp."
#property link      "http://www.mql5.com"
#property version   "1.00"
#property indicator_separate_window

#property indicator_buffers 4
#property indicator_plots   3
#property indicator_level1  0.0
#property indicator_levelcolor Silver
#property indicator_levelstyle STYLE_DOT
#property indicator_levelwidth 1
//--- plot Balance
#property indicator_label1  "Balance"
#property indicator_type1   DRAW_COLOR_HISTOGRAM
#property indicator_color1  clrBlue,clrRed
#property indicator_style1  STYLE_DOT
#property indicator_width1  1
//--- plot Equity
#property indicator_label2  "Equity"
#property indicator_type2   DRAW_LINE
#property indicator_color2  clrLime
#property indicator_style2  STYLE_SOLID
#property indicator_width2  1
//--- plot Zero
#property indicator_label3  "Zero"
#property indicator_type3   DRAW_LINE
#property indicator_color3  clrGray
#property indicator_style3  STYLE_DOT
#property indicator_width3  1

#include <BalanceClass.mqh>
//+------------------------------------------------------------------+
//| Input and global variables                                       |
//+------------------------------------------------------------------+
input string   iParentName        = "";             // Indicator name for balance calculation
input int      iSignalBufferIndex = -1;            // Signal buffer's index number
input datetime iStartTime         = D'01.01.2012';  // Calculation start date
input datetime iEndTime           = 0;             // Calculation end date
//--- Indicator buffers
double   Balance[];       // Balance values
double   BalanceColor[];  // Color index for drawing the balance
double   Equity[];        // Equity values
double   Zero[];          // Zero value for histogram's correct display
//--- Global variables
double   Signal[1];       // Array for receiving the current signal
int      parent_handle;   // Indicator handle, the signals of which are to be used

CBaseBalanceCalculator calculator; // Object for calculating balance and equity
//+------------------------------------------------------------------+
//| Custom indicator initialization function                         |
//+------------------------------------------------------------------+
int OnInit()
  {
   // Binding indicator buffers
   SetIndexBuffer(0,Balance,INDICATOR_DATA);
   SetIndexBuffer(1,BalanceColor,INDICATOR_COLOR_INDEX);
   SetIndexBuffer(2,Equity,INDICATOR_DATA);
   SetIndexBuffer(3,Zero,INDICATOR_DATA);

   // Search for indicator handle by its name
   parent_handle = FindIndicatorHandle(iParentName);
   if (parent_handle < 0)
     {
      Print("Error! Parent indicator not found");
      return -1;
     }

   return(0);
  }
//+------------------------------------------------------------------+
//| Custom indicator iteration function                              |
//+------------------------------------------------------------------+
int OnCalculate(const int rates_total,
                const int prev_calculated,
                const datetime &time[],
                const double &open[],
                const double &high[],
                const double &low[],
                const double &close[],
                const long &tick_volume[],
                const long &volume[],
                const int &spread[])
  {
   // Set the borders for calculating the indicator
   int start_index = prev_calculated;
   int end_index = rates_total-1;

   // Calculate balance and equity values
   for(int i=start_index; i<end_index; i++)
     {
      // Check if the balance calculation corresponds the interval
      if (time[i] < iStartTime)
        {
         Balance[i] = 0;
         Equity[i] = 0;
         continue;
        }
      if (time[i] > iEndTime && iEndTime != 0)
        {
         Equity[i] = (i==0) ? 0 : Equity[i-1];
         Balance[i] = Equity[i];
         continue;
        }

      // Request a signal from the parent indicator
      if(CopyBuffer(parent_handle,iSignalBufferIndex,time[i],1,Signal)==-1) // Copy the indicator main line data
        {
         Print("Data copy error: " + IntegerToString(GetLastError()));
         return(0);  // Finish the function operation and send indicator for the full recalculation
        }

      // Initialize balance and equity calculation
      // Since the signal is formed when the candle is closing, we will be able
      //   to perform any operation only at the next candle's opening price
      BalanceResults results = calculator.Calculate(i==0?0:Balance[i-1], (int)Signal[0], open[i+1], spread[1+1]);

      // Fill out all indicator buffers
      Balance[i] = results.balance;
      Equity[i] = results.equity;
      Zero[i] = 0;
      if (Balance[i] >= 0)
         BalanceColor[i] = 0;
      else
         BalanceColor[i] = 1;
     }

   // Fill out buffers for the last candle
   Balance[end_index] = Balance[end_index-1];
   Equity[end_index] = Equity[end_index-1];
   BalanceColor[end_index] = BalanceColor[end_index-1];
   Zero[end_index] = 0;

   return rates_total;
  }
//+------------------------------------------------------------------+
终于结束了!让我们对其进行编译并查看结果。
使用说明
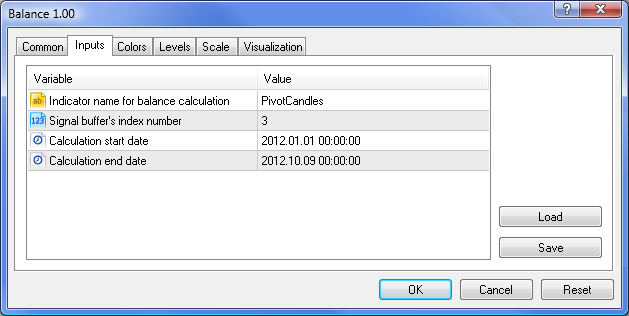
要评估我们新开发指标的操作,将其附加至包含至少一个信号指标的图表。如果您完成了所有步骤,那么我们已经有了这样一个指标 – PivotCandles。因此,我们需要配置输入参数。看看我们要指定哪些内容:
- Indicator name for balance calculation(用于余额计算的指标名称)(字符串)– 我们应牢记余额指标的绑定通过名称执行。因此,该字段是必填的。
- Signal buffer's index number(信号缓冲区的索引编号)(整型)– 另一个关键参数。根据先前定义的算法,该信号指标可能会生成多个信号。因此,余额指标应具有和它需要计算的缓冲区的信号有关的数据。
- Calculation start date(计算起始日期)(日期/时间)– 余额计算的起始日期。
- Calculation end date(计算结束日期)(日期/时间)– 余额计算的结束日期。如果未选定日期(等于零),计算将执行至最后一个柱。
图 3 显示用于将余额指标附加至 PivotCandles 指标的第三个缓冲区的前两个参数的配置。剩下的两个参数可根据您的偏好进行设置。

图 3. 余额指标参数
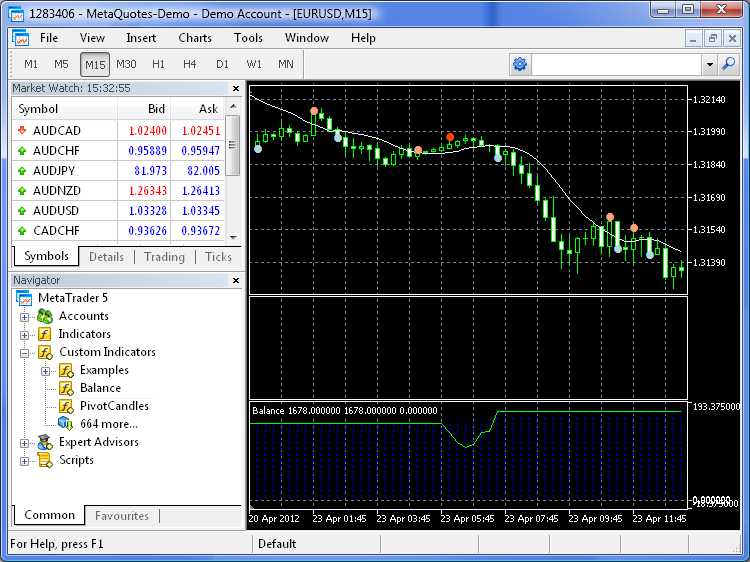
如果正确执行了上述所有步骤,您应该看到与下图极其相似的画面。

图 4. 使用 PivotCandles 指标的信号生成的余额和资产净值曲线
现在,我们可以尝试不同的时间表和交易品种,找出最盈利/亏损的市场进入点。应该补充一点,此方法可帮助您找出影响您的交易结果的市场相关性。
原本,我想要比较基于相同的信号的“EA 交易”测试与使用上述方法所用时间的差异。但随后我放弃了这个想法,因为重新计算指标大概只需一秒。考虑到它的历史数据上传和价格变动生成算法等,“EA 交易”必然无法在这样短的时间里完成。
总结
上述方法速度极快。此外,它使生成开仓/平仓信号的指标的测试一目了然。它允许交易人员在单个图表窗口中分析信号和存款对信号的响应。但我们应该意识到,该方法仍有其局限性:
- 分析指标的信号缓冲区应预先准备;
- 信号被绑定至新柱的开盘时间;
- 计算余额时无 MM;
然而,尽管存在这些缺点,我认为优点仍然是最主要的,并且此测试方法将在其他设计用于分析市场行为和处理市场生成信号的工具中占据一席之地。
本文由MetaQuotes Ltd译自俄文
原文地址: https://www.mql5.com/ru/articles/505
 使用命名管道与 MetaTrader 5 进行无 DLL 通信
 如何准备 MetaTrader 5 报价用于其他应用程序