
交易者的工具箱: 设计指标
简介
什么是指标? 指标是显示特定数据类型的指定工具。 通常这是关于价格系列属性的信息,我们正是会对这种指标类型做进一步的讨论。
每个指标还拥有自己的属性和特性:例如,值的范围,超买/超卖区间,交叉线、顶部和底部... 这些大量的属性可连续地与主指标值共同使用。 但是,这些属性并不总是有效。 有多种原因 - 指标窗口过小,低密度等。
本文目的旨在协助你改善描述性和信息性的指标值,以及促进代码实施过程的部分自动化和简易化。 我希望以下的代码对专业开发人员和新手都不会造成困难。
本文主要面向的人群需至少拥有 MQL4 入门水平知识,可以在代码中实施简单想法和算法,了解终端内的代码存储架构,并且可以使用库(experts/libraries)和头文件(experts/include)。
1. 设置一项任务
所有指标中,我想要列出最具信息性的常用指标:
- 交叉线。
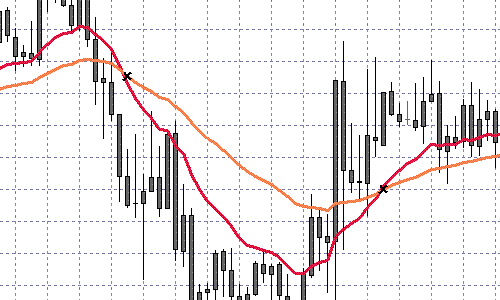
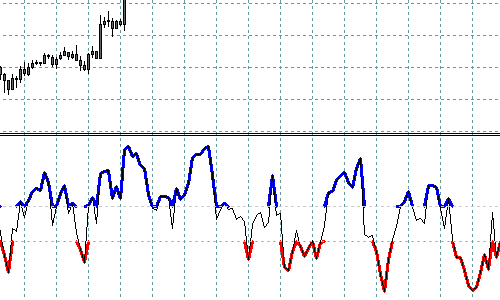
水平 - 不仅是交叉点的水平,整个水平都将高亮。
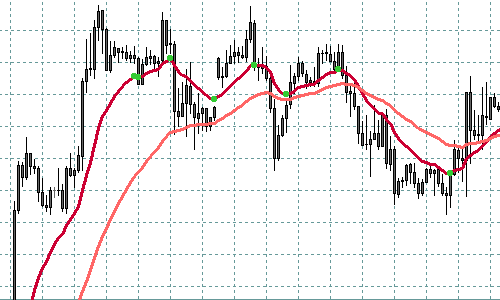
顶部/底部为简单说明。
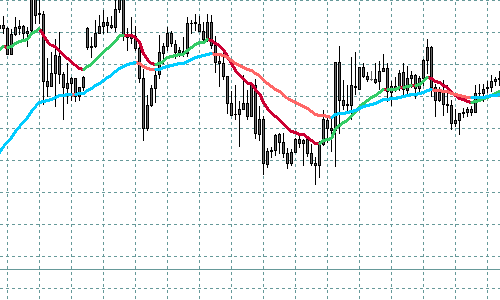
上行/下行方向使用不同配色。
让我们来对其进行讨论。
2. 基本概念
为避免误解,让我们花些时间来查看指标架构。
#property indicator_separate_window

// number of visible buffers of the indicator
#property indicator_buffers 3

// setting the range of indicator values
#property indicator_minimum 0
#property indicator_maximum 100

// setting indicator colors
#property indicator_color1  White
#property indicator_color2  Red
#property indicator_color3  Blue

// external settings
extern int RSIPeriod       = 9;
extern int AppliedPrice    = 0;
extern int MAPeriod        = 5;

// declaring indicator buffers. Here they can be declared in any order.
// Any names can be given to buffers, though better meaningful

double Values[];           // Values
double SmoothedValues[];   // Smoothed values
double Crosses[];          // intersections

// Significant number of digits after a decimal point in indicator values
int DigitsUsed = 5;

// Used empty value. In MQL4 there are two empty values -- EMPTY (-1)
// -- used as an empty parameter when calling functions
// EMPTY_VALUE (0x7FFFFFFF) -- used as an unacceptable value
// (or default value) of a variable in indicators and function calls.
// The fact is, most built-in indicators return 0 if there is no value
// Besides, in custom (iCustom) indicators the empty value can be
// set as any, this must be noted.
int EmptyValueUsed = 0;

// Initialization function.
int init()
{
   // Number of used buffers can be larger than that of displayed ones; some
   // may contain intermediate calculations and additional information. The total
   // number of buffers including additional ones is displayed here.
   // If there are no additional buffers,
   // this line is not needed. Total number must not exceed 8
   // IndicatorBuffers(3);

   // associate buffers. Indexes must go from 0 till the declared number (not including)
   // buffers are drawn in the order of index growing, this is important and can be
   // used when righting indicators further.
   // It means that a buffer with a larger index is drawn above the buffer with lower one
   SetIndexBuffer(0, Values);
   SetIndexBuffer(1, SmoothedValues);
   SetIndexBuffer(2, Crosses);
   // besides, it is important that additional buffers are located after displayed ones
   // (i.e. they must have higher index) otherwise problems may occur displaying buffers,
   // and sometimes the error can be hardly found

   // This function sets an empty value for the buffer with the preset index
   // I do not recommend to use this function in order to avoid possible difficulties
   // Default empty value for buffers -- EMPTY_VALUE.
   // Empty buffer values are not drawn in a chart (except for DRAW_ZIGZAG)

   // SetIndexEmptyValue(0, EMPTY_VALUE);

   // Set parameters for buffers
   SetIndexStyle(0, DRAW_LINE);     // The main signal is a solid line
   SetIndexStyle(1, DRAW_LINE, STYLE_DASH); // Smoothed -- dotted line
   SetIndexStyle(2, DRAW_ARROW, STYLE_SOLID, 2); // Intersections -- crosses of the size 2

   SetIndexArrow(2, 251); // cross code in Wingdings

   IndicatorDigits(DigitsUsed); // set number of significant digits after point

   // Setting the starting plotting point for each indicator. If in terms of the current index
   // the history depth
   // is lower than the value written here, the buffer value with this index will not be drawn.
   SetIndexDrawBegin(0, RSIPeriod);
   SetIndexDrawBegin(1, RSIPeriod + MAPeriod);
   SetIndexDrawBegin(2, RSIPeriod + MAPeriod + 1);

   return(0);
}

int start()
{
   // counting number of bars for re-calculation
   int toCount = Bars - IndicatorCounted();

   // Calculating values
   // counting from history start till the current moment
   for (int i = toCount - 1; i >=0; i--)
   {
      // I understood its convenience only when I started to use it
      // I recommend to conduct the normalization of data at once,
      // so that later comparison could be easily made
      Values[i] = NormalizeDouble(iRSI(Symbol(), 0, RSIPeriod, AppliedPrice, i), DigitsUsed);
   }

   // Counting smoothed values
   for (i = toCount - 1; i >=0; i--)
   {
      SmoothedValues[i] = NormalizeDouble(iMAOnArray(Values, 0, MAPeriod, 0, MODE_EMA, i), DigitsUsed);
   }

   // ...

   return(0);
}
3. 特性
让我们来详细讨论特性。
3.1. 交叉线
或许每个开发人员都曾尝试使用两条 MA(移动平均线)的交叉点,或 MACD 基准线和信号交叉线的交叉点来实施交易算法。 让我们尝试将其可视化,并通过在指标内显示交叉点来使其更加明显。
作为示例,我们将通篇使用 相对强弱指数,所以我们目标是开发具备一些新优势、经过改良的 RSI。
3.1.1. 任务规范化
务必要在单独缓冲区内标记交叉线柱体。
3.1.2. 问题
看起来凡事都简单而清晰。 任务并不困难,几行代码就能解决。
我们需要将交叉线做如下的类似描述:
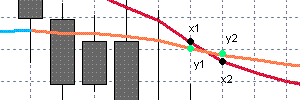
if ((x1 > y1 && x2 < y2) || (x1 < y1 && x2 > y2))
{
    // line crossing here
}
或者我们可以将其简化为:
if ((x1 - y1)*(x2 - y2) < 0)
{
    // line crossing here
}
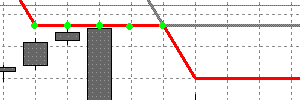
但是,我们还要考虑以下情况:
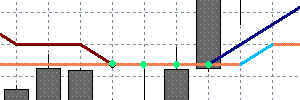
请注意绿色点的值相同。 在此情况下,我们没有交叉线,仅有单线接触的情况。
但在此需注意:
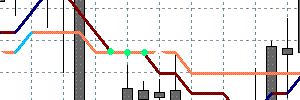
确定交叉点并非易事,这种情况出现概率相当高。
而且务必要正确区分接触和交叉的情况,要考虑到搜索期间我们可以在缓冲区或记录底部找到空白值。
3.1.3. 解决方案
从此处开始,函数 init() 并不重要,所以将不会被考虑。 完整代码可见源代码。
这是获得相对强弱指数指标的简单且已平滑的值的解决方案。
//|                                 RSI_Crosses_Sample.mq4 |

extern int RSIPeriod       = 9;
extern int AppliedPrice    = 0;
extern int MAPeriod        = 5;

// buffers
double Values[];           // Values
double SmoothedValues[];   // Smoothed values
double Crosses[];          // Crosses

int DigitsUsed = 5;
int EmptyValueUsed = 0;

int start()
{
   int toCount = Bars - IndicatorCounted();

   // Reading the values and normalizing them
   // Mark the crosses
   for (i = toCount - 1; i >=0; i--)
   {
      // i+1 must be greater or equal bars count in the history
      if (i + 1 >= Bars)
      {
         continue;
      }

      // if some of the values are empty, it is not necessary to check
      if (
            Values[i]               == EmptyValueUsed ||
            Values[i + 1]           == EmptyValueUsed ||
            SmoothedValues[i]       == EmptyValueUsed ||
            SmoothedValues[i + 1]   == EmptyValueUsed ||
            Values[i]               == EMPTY_VALUE    ||
            Values[i + 1]           == EMPTY_VALUE    ||
            SmoothedValues[i]       == EMPTY_VALUE    ||
            SmoothedValues[i + 1]   == EMPTY_VALUE
      )
      {
         continue;
      }

      // clear the current value
      Crosses[i] = EMPTY_VALUE;

      // crossing check (simple case)
      if ((Values[i] - SmoothedValues[i])*(Values[i + 1] - SmoothedValues[i + 1]) < 0)
      {
         Crosses[i] = SmoothedValues[i];
         continue;
      }

      // the crossing condition for a complicated case -
      // when crossing contain several bars with the same values
      //
      if (Values[i + 1] == SmoothedValues[i + 1] && Values[i] != SmoothedValues[i])
      {
         // there is potential crossing - checking it
         // lets find the second end

         int index = i + 1;
         bool found = false;
         while (
               index < Bars &&    // out of range
               Values[index] != EmptyValueUsed &&   // check for empty
               Values[index] != EMPTY_VALUE &&      // check for empty
               SmoothedValues[index] != EmptyValueUsed &&  // check for empty
               SmoothedValues[index] != EMPTY_VALUE)       // check for empty
         {
            if (Values[index] != SmoothedValues[index])
            {
               // ok, we have found the second end
               found = true;
               break;
            }

            index++;
         }

         if (!found)
         {
            // the case of the end of history or empty value
            // anyway, we mean that there is no crossing
            continue;
         }

         // checking the ends for crossing
         if ((Values[i] - SmoothedValues[i])*(Values[index] - SmoothedValues[index]) < 0)
         {
            // crossing found
            Crosses[i] = SmoothedValues[i];
         }  // else we have a touching - do not mark it

      }
   }

   return(0);
}
3.1.4. 自动化
在本章节内,我们将使用 Indicator_Painting 库来探讨本问题的解决方案。
//|                                 RSI_Crosses_Lib_Sample.mq4 |

#include <Indicator_Painting.mqh>

extern int RSIPeriod       = 9;
extern int AppliedPrice    = 0;
extern int MAPeriod        = 5;

// buffers
double Values[];           // Values
double SmoothedValues[];   // Smoothed values
double Crosses[];          // Crosses

int DigitsUsed = 5;
int EmptyValueUsed = 0;

int start()
{
   // Reading values
   // ...

   // Mark crosses
   MarkCrosses
   (
      Values,            // the fast buffer with values to check
      SmoothedValues,    // the slow buffer with values to check
      Crosses,           // the crosses buffer
      toCount - 1,       // start check index
      0,                 // final check index
      CROSS_ALL,         // use CROSS_UP for up crosses CROSS_DOWN for down crosses CROSS_ALL for all
      0);                // used empty value

   return(0);
}
3.2. 水平标志
一些值域受限并严格设定的振荡指标(RSI、随机振荡指标、迪马克指标、货币流量指标、威廉指标),常需要标志区间或水平。 例如,扁平区、超买/超卖区、趋势区... 让我们尝试通过不同配色来列出已定义的水平。
3.2.1. 任务规范化
务必要在单独的缓冲区内标记带有定义水平以外值得柱体。
3.2.2. 问题
问题并不如一眼看上去那样简单。
第一个问题是绘制定义水平交叉所在的柱体。 这是解决方案。
//|                                 RSI_Cut_Levels_Sample.mq4 |

extern int RSIPeriod       = 9;
extern int AppliedPrice    = 0;

extern int HigherLevel     = 70;
extern int LowerLevel      = 30;

// buffers
double Higher[];           // Overbought
double Lower[];            // Oversold
double Values[];           // Values

int DigitsUsed = 5;
int EmptyValueUsed = 0;

int start()
{
   int toCount = Bars - IndicatorCounted();

   // Reading values
   // ...

   // Mark levels - upper
   for (i = toCount - 1; i >=0; i--)
   {
      // check for empty values
      if (Values[i] == EMPTY_VALUE || Values[i] == EmptyValueUsed)
      {
         continue;
      }

      // empty current value
      Higher[i] = EMPTY_VALUE;

      // greater than high
      if (Values[i] >= HigherLevel)
      {
         Higher[i] = Values[i];
      }
   }

   // for the levels mark - the code is same
   // ...

   return(0);
}
这个代码解决了已定义的任务,但它本身有一个问题:
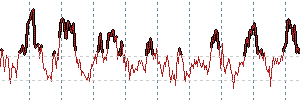
代码很难进行可视分析,因为信号图从高于(低于)水平的值开始。 由相邻柱体的快速变化而导致的绘图特性,造成了部分信号柱体无法被分析。
解决方案为不仅标记高于(低于)定义水平的柱体,还标记已标记的柱体前形成和与其相邻的柱体。 且务必避免用柱体自身的值,而要用水平值进行标记。
第二个问题在解决第一个后出现 - 由于算法复杂,信号缓冲区有“错误”水平故障的伪标记。
这说明柱体形成期间的价格处于水平之外,然而,最终柱体的值却在水平内。 基于此事实,我们可获得下图:
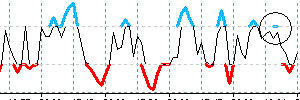
仅当我们在实时报价上使用指标,问题才会出现。 解决方案很简单 - 我们在处理时检查两个柱体(0 和 1),其他仅在需要时才进行检查。
随后,我们会得到下面关于 RSI 的图:
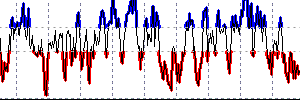
3.2.3. 解决方案
那么,让我们将所有都写入代码中:
//|                                 RSI_Levels_Sample.mq4 |

extern int RSIPeriod       = 9;
extern int AppliedPrice    = 0;

extern int HigherLevel     = 70;
extern int LowerLevel      = 30;

// buffers
double Higher[];           // Overbought
double Lower[];            // Oversold
double Values[];           // Values

int DigitsUsed = 5;
int EmptyValueUsed = 0;

// looking at least two bars - 0 and 1.
int Depth = 2;

int start()
{
   int toCount = Bars - IndicatorCounted();

   // Reading values
   // ...

   toCount = MathMax(toCount, Depth);

   // Marking levels - upper
   for (i = toCount - 1; i >=0; i--)
   {
      if (Values[i] == EMPTY_VALUE || Values[i] == EmptyValueUsed) continue;

      Higher[i] = EMPTY_VALUE;

      // greater than level
      if (Values[i] >= HigherLevel)
      {
         Higher[i] = Values[i];

         // if previous is lower
         if (Values[i + 1] < HigherLevel && Values[i + 1] != EmptyValueUsed)
         {
         // mark it also but with the level value
            Higher[i + 1] = HigherLevel;
         }
      }
      // if current lower
      else
      {
         // if previous is greater
         if (Values[i + 1] >= HigherLevel && Values[i + 1] != EMPTY_VALUE)
         {
            // mark it also but with the level value
            Higher[i] = HigherLevel;
         }
      }
   }

   // Mark levels - the code is the same
   // ...

   return(0);
}
3.2.4. 自动化
针对使用 Indicator_Painting 库出现的相同问题的解决方案。
//|                                 RSI_Levels_Lib_Sample.mq4 |

#include <Indicator_Painting.mqh>

extern int RSIPeriod       = 9;
extern int AppliedPrice    = 0;

extern int HigherLevel     = 70;
extern int LowerLevel      = 30;

// buffers
double Higher[];           // Overbought
double Lower[];            // Oversold
double Values[];           // Values

int DigitsUsed = 5;
int EmptyValueUsed = 0;
int Depth = 2;

int start()
{
   int toCount = Bars - IndicatorCounted();

   // Read values
   for (int i = toCount - 1; i >= 0; i--)
   {
      Values[i] = NormalizeDouble(iRSI(Symbol(), 0, RSIPeriod, AppliedPrice, i), DigitsUsed);
   }

   // Mark levels - upper
   MarkLevel(Values, Higher, 0, toCount - 1, HigherLevel, GREATER_THAN, EmptyValueUsed);
   // Mark levels - lower
   MarkLevel(Values, Lower, 0, toCount - 1, LowerLevel, LESS_THAN, EmptyValueUsed);

   return(0);
}
3.3. 顶部和底部
可将指标极值点(极值)用作信号。 本文中,“极值”一词采用最简单的含义 - 如果柱体的值大于(小于)相邻的值,则该值被认为是极值。
3.3.1. 任务规范化
务必要在单独缓冲区内标记带有极值的柱体。
3.3.2. 问题
让我们来看些示例:
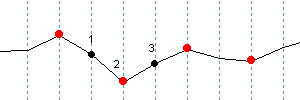
以下标为红线的为明显的极值:
if ((x1 > x2 && x3 > x2) || (x1 < x2 && x3 < x2))
{
    // x2 is extremal
}
或者我们可以将其简化为:
if ((x1 - x2)*(x2 - x3) < 0)
{
    // x2 is extremal
}
但是,我们还要考虑以下情况:
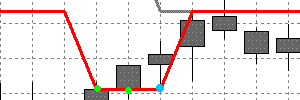
请注意已标记点的值相同。 蓝色点为极值。 要对其定义并不简单。 而在以下情况中:
没有极值,我们假设有条曲线。
这种情况的解决方案为,像交叉情况那样,找到第二个结束点。
3.3.3. 解决方案
下面是代码:
//|                                 RSI_Extremums_Sample.mq4 |

extern int RSIPeriod       = 9;
extern int AppliedPrice    = 0;

// buffers
double Values[];           // Values
double Extremums[];        // Extremums

int DigitsUsed = 5;
int EmptyValueUsed = 0;

int start()
{
   int toCount = Bars - IndicatorCounted();
   for (int i = toCount - 1; i >=0; i--)
   {
      Values[i] = NormalizeDouble(iRSI(Symbol(), 0, RSIPeriod, AppliedPrice, i), DigitsUsed);
   }

   for (i = toCount - 1; i >=0; i--)
   {
      // check the values relative to the current index.
      if (i + 2 >= Bars)
      {
         continue;
      }

      // check for empty values, if there are, it is not necessary to check
      if (
            Values[i]      == EmptyValueUsed ||
            Values[i + 1]  == EmptyValueUsed ||
            Values[i + 2]  == EmptyValueUsed
      )
      {
         continue;
      }

      // fill the current value of the mark buffer
      Extremums[i + 1] = EMPTY_VALUE;

      // cross condition - the simple case
      if ((Values[i] - Values[i + 1])*(Values[i + 1] - Values[i + 2]) < 0)
      {
         // we have found the cross
         Extremums[i + 1] = Values[i + 1];
         continue;
      }

      // the cross condition in a complicated case -
      // when top contain several bars with the same value
      if (Values[i + 1] == Values[i + 2] && Values[i] != Values[i + 1])
      {
         // there is possible extremum - to check it
         // we have to find the second end

         int index = i + 2;
         bool found = false;
         while (index < Bars && Values[index] != EmptyValueUsed && Values[index] != EMPTY_VALUE)
         {
            if (Values[i + 2] != Values[index])
            {
               // ok, we have found the second end
               found = true;
               break;
            }

            index++;
         }

         if (!found)
         {
            // we are at the end of the history or have an empty value
            // for the both cases we assume that there is no extremum
            continue;
         }

         // checking the ends for a cross
         if ((Values[i] - Values[i + 1])*(Values[i + 1] - Values[index]) < 0)
         {
            // there is a cross
            Extremums[i + 1] = Values[i + 1];
         }  // else -- there is a bend point, do not mark it
      }
   }

   return(0);
}
3.3.4. 自动化
使用 Indicator_Painting 库进行相同的任务解决方案。
//|                                 RSI_Extremums_Lib_Sample.mq4 |

#include <Indicator_Painting.mqh>

extern int RSIPeriod       = 9;
extern int AppliedPrice    = 0;

// buffers
double Values[];           // Values
double Extremums[];        // Extremal points

int DigitsUsed = 5;
int EmptyValueUsed = 0;

int start()
{
   int toCount = Bars - IndicatorCounted();

   for (int i = toCount - 1; i >=0; i--)
   {
      Values[i] = NormalizeDouble(iRSI(Symbol(), 0, RSIPeriod, AppliedPrice, i), DigitsUsed);
   }

   MarkExtremums(Values, Extremums, toCount - 1, 0, DIR_ALL, EmptyValueUsed);

   return(0);
}
3.4. 按方向配色
这个可视化方法用于部分标准指标,且同样能够起到作用。
3.4.1. 任务规范化
务必要用不同颜色将部分指标值集合进行上色(例如上行或下行的集合)。 方向则为最简单的情况 - 如果当前值大于早前的值,则方向为上行,反之则假设方向为下行。
3.4.2. 问题
让我们从特性开始。 假设我们有一个基本数据缓冲区,且该缓冲区已标绘过。 如果没有,则我们将创建一个,因为我们需要至少两种颜色和两个缓冲区来进行自定义方向上色。 现在来看看特性。 如果我们在基本缓冲区上绘制一个方向,则不需要再给另一个方向上色 - 我们将在基本缓冲区的未上色部分看到它。
基本缓冲区:
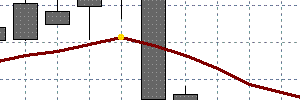
以下是已标绘上行方向的基本缓冲区:
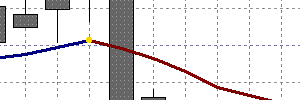
这是为什么我们要进一步考虑仅有一个方向的方案,例如上行方向。 让我们研究以下可能发生的问题。
以下是对特性的简单实施:
//|                                 RSI_Simple_Directions_Sample.mq4 |

extern int RSIPeriod       = 9;
extern int AppliedPrice    = 0;

// buffers
double Values[];           // Values
double Growing[];          // Growing buffer

int DigitsUsed = 5;
int EmptyValueUsed = 0;

int start()
{
   int toCount = Bars - IndicatorCounted();

   // Reading values
   for (int i = toCount - 1; i >=0; i--)
   {
      Values[i] = NormalizeDouble(iRSI(Symbol(), 0, RSIPeriod, AppliedPrice, i), DigitsUsed);
   }

   // Mark the growing levels - we will get the falling levels as a result
   for (i = toCount - 1; i >=0; i--)
   {

      // check for empty value, if there are, the further check is not necessary
      // ...

      // filling the current values with empty values
      Growing[i] = EMPTY_VALUE;

      // if growing
      if (Values[i] > Values[i + 1])
      {
         Growing[i] = Values[i];
         Growing[i + 1] = Values[i + 1];
      }
   }

   return(0);
}
编译,附加至图表并...查看代码执行的结果:
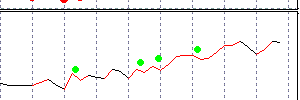
存在部分问题:它们以点做出标记。 让我们想想为何其看起来是这样的。 给一个方向上色时,我们会通过将空白值(EMPTY_VALUE)留在其他部分,来获取效果。
让我们来考虑以下情况:
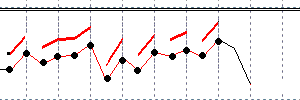
应含有非空值的额外缓冲区数据由黑色点标记。 为避免点与点之间出现直线绘制(使用 DRAW_LINE 方式),务必要在他们之间拥有至少一个非空值。 所有绘制范围没有空白值,这是基本缓冲区仅在“锯齿”片段绘制的原因。
这个问题的解决方案并不明显 - 比如,平滑化或使用部分额外的条件将令其更加复杂。 因此,我们可能在为一些柱体重新上色或做其他工作时遇到困难。
解决方案为对其使用 两个 额外缓冲区。 这样才有可能改变已上色的片段 - 因此,我们将在每个缓冲区内获得必要的空白值。
让我们将不同颜色分配至额外缓冲区,然后看看结果:
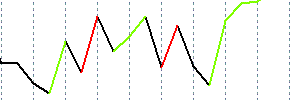
主要问题已经解决,但还有另外一个和零柱体相关的小问题。 柱体每次都会重新绘制,部分情况下,如果方向改变,则务必要删除上行方向的绘图。
让我们来看看实施方案。
3.4.3. 解决方案
//|                                 RSI_Directions_Sample.mq4 |

extern int RSIPeriod       = 9;
extern int AppliedPrice    = 0;

// buffers
double Values[];           // Values
double Growing1[];         // First growing buffer
double Growing2[];         // Second growing buffer

int DigitsUsed = 5;
int EmptyValueUsed = 0;

int start()
{
   int toCount = Bars - IndicatorCounted();

   // Reading values
   for (int i = toCount - 1; i >=0; i--)
   {
      Values[i] = NormalizeDouble(iRSI(Symbol(), 0, RSIPeriod, AppliedPrice, i), DigitsUsed);
   }

   // Mark for the growing levels - we will get the falling levels as a resut
   for (i = toCount - 1; i >=0; i--)
   {
      // check of an empty values
      // ...

      // assume that the current values are empty
      Growing1[i] = EMPTY_VALUE;
      Growing2[i] = EMPTY_VALUE;

      // if it growing
      if (Values[i] > Values[i + 1])
      {
         // if it growing on the previous bar
         if (Values[i + 1] > Values[i + 2])
         {
            // writing to the current growing buffer
            if (Growing1[i + 1] != EMPTY_VALUE) Growing1[i] = Values[i];
            else                                Growing2[i] = Values[i];
         }
         // if the previous bar was not increasing
         else
         {
            // write to the buffer which it was not used the last 2 bars
            // we must have at least one such bar

            if (Growing2[i + 2] == EMPTY_VALUE)
            {
               Growing2[i] = Values[i];
               Growing2[i + 1] = Values[i + 1];
            }
            else
            {
               Growing1[i] = Values[i];
               Growing1[i + 1] = Values[i + 1];
            }
         }
      }
      // if the last value does not grow, remove it
      else if (i == 0)
      {
         if (Growing1[i + 1] != EMPTY_VALUE && Growing1[i + 2] == EMPTY_VALUE)
         {
            Growing1[i + 1] = EMPTY_VALUE;
         }

         if (Growing2[i + 1] != EMPTY_VALUE && Growing2[i + 2] == EMPTY_VALUE)
         {
            Growing2[i + 1] = EMPTY_VALUE;
         }
      }
   }

   return(0);
}
3.4.4. 自动化
使用 Indicator_Painting 库进行相同的任务解决方案。
库中还有相似的下行方向实施方案。
//|                                 RSI_Directions_Lib_Sample.mq4 |

#include <Indicator_Painting.mqh>

extern int RSIPeriod       = 9;
extern int AppliedPrice    = 0;

// buffers
double Values[];           // Values
double Growing1[];         // First growing buffer
double Growing2[];         // Second growing buffer

int DigitsUsed = 5;
int EmptyValueUsed = 0;

int start()
{
   int toCount = Bars - IndicatorCounted();

   // Reading values
   for (int i = toCount - 1; i >=0; i--)
   {
      Values[i] = NormalizeDouble(iRSI(Symbol(), 0, RSIPeriod, AppliedPrice, i), DigitsUsed);
   }

   // Mark the growing levels - we will get the falling levels automatically
   MarkGrowing(Values, Growing1, Growing2, toCount - 1, 0, EmptyValueUsed);

   return(0);
}
4. Indicator_Painting 库
所有工作完成后,出现 Indicator_Painting 库。
该库专门设计用于实现所述操作的自动化,带有部分补充。
下面是一些可用功能的清单:
// ====================================================
// Mark for tops and bottoms
// ====================================================
void MarkExtremums(
      double values[],        // Indicator values
      double& extremums[],    // Buffer for extremums
      int startIndex,         // Start index for check (it included)
      int endIndex,           // End index for check (it included)
      int direction,          // DIR_TOP for tops, DIR_BOTTOM for bottoms, DIR_ALL for tops an bottoms
      double emptyValueUsed); // The value used for "empty" mark


// ====================================================
// Mark for crosses
// ====================================================
void MarkCrosses(
      double values1[],       // Values of the first indicator
      double values2[],       // Values of the second indicator
      double& crosses[],      // Buffer for their crosses
      int startIndex,         // Start index for check (it included)
      int endIndex,           // End index for check (it included)
      int direction,          // CROSS_UP for up crosses,CROSS_DOWN for down crosses, CROSS_ALL for all crosses
      double emptyValueUsed); // The value used for "empty" mark


// ====================================================
// Mark for level crosses
// ====================================================
void MarkLevelCrosses(
      double values[],        // Values of the indicator
      double level,           // Level value for a cross check
      double& crosses[],      // Buffer for the crosses
      int startIndex,         // Start index for check (it included)
      int endIndex,           // End index for check (it included)
      int direction,          // CROSS_UP for up crosses,CROSS_DOWN for down crosses, CROSS_ALL for all crosses
      double emptyValueUsed); // The value used for "empty" mark


// ====================================================
// Mark for levels
// ====================================================
void MarkLevel(
      double values[],        // Values of the indicator
      double& level[],        // Buffer for the crosses
      int startIndex,         // Start index for check (it included)
      int endIndex,           // End index for check (it included)
      double levelValue,      // Level value
      int condition,          // Mark condition (LESS_THAN = -1, GREATER_THAN = 1)
      double emptyValueUsed); // The value used for "empty" mark

// ====================================================
// Mark for dynamic levels
// ====================================================
void MarkDynamicLevel(
      double values[],        // Values of the indicator
      double dynamicLevel[],  // Dynamical level values for check
      double& level[],        // Buffer for the crosses
      int startIndex,         // Start index for check (it included)
      int endIndex,           // End index for check (it included)
      int condition,          // меньше (LESS_THAN = -1) или больше уровня (GREATER_THAN = 1)
      double emptyValueUsed); // The value used for "empty" mark

// ====================================================
// Mark for direction (upward)
// ====================================================
void MarkGrowing(
      double values[],        // Values of the indicator
      double& growing1[],     // The first buffer to mark the direction
      double& growing2[],     // The second buffer to mark the direction
      int startIndex,         // Start index for check (it included)
      int endIndex,           // End index for check (it included)
      double emptyValueUsed); // The value used for "empty" mark

// ====================================================
// Mark for direction (downward)
// ====================================================
void MarkReducing(
      double values[],        // Values of the indicator
      double& reducing1[],    // The first buffer to mark the direction
      double& reducing2[],    // The second buffer to mark the direction
      int startIndex,         // Start index for check (it included)
      int endIndex,           // End index for check (it included)
      double emptyValueUsed); // The value used for "empty" mark
此处为部分使用库的示例:
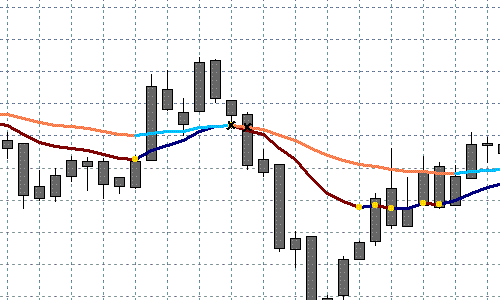
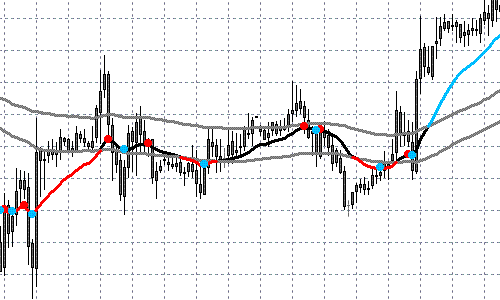
为使用库,需要执行以下步骤:
1. 将文件 “Indicator_Painting.mq4” 复制到文件夹 “experts/libraries”
2. 将文件 “Indicator_Painting.mqh” 复制到文件夹 “experts/include”
3. 向指标代码添加下列字符串:
#include <Indicator_Painting.mqh>
现在可以使用所有库函数了。 查看文件 ”Indicator_Painting.mqh” 了解更多细节。
你可以在随本文提供的文件中找到示例。
总结
笔者希望本文可帮助并简化部分人的工作。 笔者认为目标已达成。
鸣谢
笔者想感谢 Mr. Viktor Rustamov (granit77) 对任务提出的建议,并为改善本文提供帮助和意见。
本文由MetaQuotes Ltd译自俄文
原文地址: https://www.mql5.com/ru/articles/1569
注意: MetaQuotes Ltd.将保留所有关于这些材料的权利。全部或部分复制或者转载这些材料将被禁止。
本文由网站的一位用户撰写,反映了他们的个人观点。MetaQuotes Ltd 不对所提供信息的准确性负责,也不对因使用所述解决方案、策略或建议而产生的任何后果负责。
 金融证券的叠加和干扰
 图形界面 II: 分隔线和上下文菜单元件 (第二章)
 请保护好自己,开发员!
