MetaTrader 5용 Expert Advisor 및 지표 - 36

Scalp Strategy Builder for MT5 is a flexible MT-5 Expert Advisor that can be configured for different scalp trading systems. This EA is an open toolbox that allows transparent development, testing and automated execution of market-specific trading strategies. The advanced settings for Money Management, news handling and trading hours allow the configuration of trading rules for prop trading qualification. Benefits: Transparent strategy, no black box Time saving as trading strategies can be ver

Multi-currency grid Expert Advisor, in most cases it receives quite accurate entries. If an entry is not accurate enough, the positions are managed using an elaborate martingale strategy. Work on real account: http://tiny.cc/nkaqmz Entries are performed using the signals of RSI and Stochastic indicators, in the overbought/oversold areas, plus additional entry conditions based on a proprietary algorithm. Recommended timeframe - М15. Input parameters SetName - name of the current settings file Ma

Profitable Scalper EA - Rôla Scalper! Tested on EURUSDm Symbol on Micro Account created in XM Broker, but you can try it in any market or broker, any way I recommend that you use it on markets with volatility similar to EURUSD.
This EA can open a lot of positions, so I recommend that you use a broker that don't have comission fee and provide low spread.
You can use settings on 5 minutes timeframe, since I started to use it, and in tests, the maximum drawdown with this settings and M5 timefr
FREE
Product Name: Trailing Stop and Breakeven Management EA Description:
This EA (Expert Advisor) is designed to set trailing stops and breakeven levels for trades based on input parameters and a magic number in MT5. It can be used to manage trades placed manually or by any other EA. The EA allows customization of various settings to suit your trading strategy. General Settings: Enable Magic Number (ENABLE_MAGIC_NUMBER): Enable to use a magic number for trades. Set to false for manual trades. Magic
FREE

This variant of the ZigZag indicator is recalculated at each tick only at the bars that were not calculated yet and, therefore, it does not overload CPU at all which is different from the standard indicator. Besides, in this indicator drawing of a line is executed exactly in ZIGZAG style and, therefore, the indicator correctly and simultaneously displays two of its extreme points (High and Low) at the same bar!
Depth is a minimum number of bars without the second ma
FREE

This indicator uses a different approach from the previous version to get it's trendlines. This method is derived from Orchard Forex, and the process of making the indicator is demonstrated in there video https://www.youtube.com/watch?v=mEaiurw56wY&t=1425s .
The basic idea behind this indicator is it draws a tangent line on the highest levels and lowest levels of the bars used for calculation, while ensuring that the lines don't intersect with the bars in review (alittle confusing? I kno
FREE

Renko is a well-known Japanese charting technique that removes time from the chart. Instead of drawing bars in constant intervals (time) as a normal chart would, a Renko chart does so only when price moves beyond a predefined amount.
In a Renko chart, a bar is created when price exceeds the previous bar’s high or low by a predefined amount or what we call the Box Size. The result is a chart with equally sized bars running up or down in 45 degree angles. Such a chart offers the following advant

Trading the currency markets is a complex business, not least since we are dealing with pairs of currencies, and by inference, pairs of economies. All economies around the world are interlinked, and reflected in the constant ebb and flow of currency strength and weakness. The problem for us as traders is monitoring so many pairs simultaneously, since every pair does not move independently, but reflects the interrelated nature of this market.
The Quantum Currency Heatmap delivers the informatio

The Stochastic Oscillator is one of the main indicators used in the analysis of financial assets. It is one of the highlights in the study of price movements and can be an important indicator of changing trends in the capital market. Stochastic is an oscillator used to identify when an asset is overbought or oversold. It consists of two lines: %K, which is calculated from the highs and lows of a period, and %D, which is a moving average of %K. Our version contains color filling, which facilitate
FREE

Keltner-Enhanced improves the accuracy and readability of Keltner Channels with many options for adjusting them and more five price calculations beyond the META default.
The Keltner-E indicator is a banded indicator similar to Bollinger Bands and Moving Average Envelopes. They consist of an upper envelope above a midline and a lower envelope below the midline.
The main occurrences to look out for when using Keltner Channels are breakouts above the Upper Envelope or below the Lower Envelope
FREE

The seven currencies mentioned are: GBP (British Pound): This is the currency of the United Kingdom. AUD (Australian Dollar): This is the currency of Australia. NZD (New Zealand Dollar): This is the currency of New Zealand. USD (United States Dollar): This is the currency of the United States. CAD (Canadian Dollar): This is the currency of Canada. CHF (Swiss Franc): This is the currency of Switzerland. JPY (Japanese Yen): This is the currency of Japan. Currency strength indexes provide a way to
FREE

이 지표는 트레이더가 시장의 방향을 식별하는 데 도움이 되도록 개발되었습니다. 트레이딩에는 세 가지 유형의 움직임과 UPTREND, DOWNTREND 및 SIDEWAYS가 있습니다. 사이드웨이 시장 움직임은 대부분의 트레이더가 갇히는 곳입니다. 통합, 이것은 단순히 방향이 없음을 의미합니다. 스캘퍼에게 이것은 자산 클래스가 이 기간에 있는 시기를 식별하는 방법을 알고 있는 경우에만 이점이 될 수 있습니다.
추세를 식별하기 위해 괭이를 개발하려는 시도는 이 지표의 모든 것입니다. 가격이 녹색 점 위에 있을 때 고수하고 2개의 연속 점이 발생한 후 매수 거래를 하거나 가격이 빨간색 점 아래에 있을 때 매도 포지션에 집중합니다. .
내가 이 지표에서 한 것은 시장이 범위 내에 있을 때, 가격이 빨간색 점 아래에 있지 않을 때, 가격이 녹색 점 위에 있지 않을 때 판매하지 않는 것, 구매하지 않는 것을 피하는 것입니다.
내 항목의 대부분은 가격이 점보다 높을 때까지 기다린 다음
FREE

I recommend you to read the product's blog (manual) from start to end so that it is clear from the beginning what the indicator offers. This multi time frame and multi symbol supply and demand zone dashboard indicator sends alerts when the price has reached a supply/demand zone. It is also possible to use it to be alerted about regular double tops/bottoms instead of zones. It can be used with all time frames from M1 to MN. Maximum 9 time frames can be shown in the dashboard at the same time.
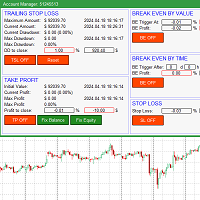
The account manager has a set of functions necessary for trading, which take into account the results of the entire account in total, and not for each individual open position: Trailing stop loss. Take profit. Break-even on the amount of profit. Breakeven by time. Stop Loss Typically, each of these options can be applied to each individual trade. As a result, the total profit on the account may continue to increase, and individual positions will be closed. This does not allow you to get the maxi

A simple volume indicator according to the color of the candle!
- Custom background!
- Supports Volume by Ticks or Real Volume.
The original Metatrader Volume indicator does not show the colors of the bar according to the color of the Candle, it only changes color when the volume of a candle is greater than the previous one, this sometimes creates confusion for beginners and does not know the real reason for the color change.
Free indicator, support may take a while to respond!
FREE
Counterattack EA is a fully automatic Grid Expert Advisor for Trend Scalping Trading on XAUUSD timeframe M1 but also in others.
Recommendations The Expert is programmed to work on XAUUSD M1, but you can use all others timeframes also. An ECN broker is always recommended A low latency VPS is always recommended. The recommended Leverage is 1:100 or more. The recommended capital is 10000 ($/cent) per 0.01 Lots or more. For higher Lots please test by yourself Please test Demo before you
FREE
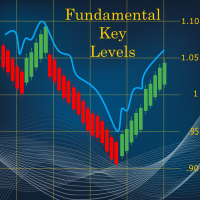
I am sure you have noticed such a feature as setting the Stop Loss or Take Profit level at the round levels, for example 1.3500, a round number that determines the beginning of a new “candle” - numbers that end in two or three zeros are called round numbers. On daily trading periods, approaching support or resistance levels, as a rule, does not cause a pullback or rally, as traders have to be more demanding in choosing such levels and often the levels indicated by round numbers are used for this
FREE

Introducing TradingBoost : Revolutionize your trading experience with TradingBoost, an innovative software utility seamlessly integrated into the MetaTrader platform. TradingBoost empowers traders with advanced analytics, real-time insights, and predictive tools to enhance decision-making and optimize trading strategies.
There is a version WITH AI: https://www.mql5.com/en/market/product/115276 Version for MetaTrader 4: https://www.mql5.com/en/market/product/117046 Functionality 15+ Trading Too
FREE
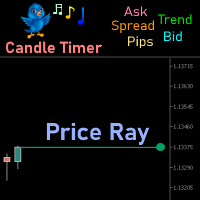
Price Ray indicator is a utility that will improve the way you trade. Primarily, it shows the Bid, Ask or Last price as a line ray which beams till the current candle, last visible chart candle or extended to all candle bars. The enhanced features in this indicator provide information in an area where you focus most, right next to the current candle. You can select text to be shown above or below the Price ray. The indicator is fully customizable, allowing it to fit any strategy requirements. Th
FREE

Simple Calendar Events is an indicator that will mark important Important Economy Events on your chart. For example, if you are trading something that is USD based, you would like to know when some important events are coming, you can expect some volatility or some different Price action, so you can base your strategy on it. If you trade something that is country based you can also choose that, and it will show you when the event is, so you can be prepared for it. When you hover with the mouse
FREE

Many friends asked me for a simple, non-obtrusive, resource-friendly clock to track the time during their trades. It seems pretty obvious, but it is a must-have for those trading the market manually, waiting for the Market News, or just to visually know what time it is... Trading is an absorbing endeavor! So, here it is... Totally configurable, including Font Type, Font Size and Chart Location: Upper Left/Center/Right OR Lower Left/Center/Right, with a little twist of adjusting the Offset, just
FREE

Indicator measures strength of each currency in your list.
Main idea: It simply iterates through all combinations of pairs and adds difference between open and close in percent. Parameters: List of currencies - what currencies will be calculated (maximum is 8) Calculation type - from which data will be strength calculated Calculation data input - used as input related to calculation type Symbol suffix - used in case of suffix on symbols, e.g: when your symbols look like EURUSDm, EURUSDmicro et
FREE
스마트 머니 개념의 놀라운 잠재력을 활용하기 위한 관문인 SMC Range Breakout EA를 소개합니다. 불확실성에 작별을 고하고 거래를 새로운 차원으로 끌어올릴 데이터 기반 접근 방식을 만나보세요.
다양한 기간에 걸쳐 GBP/JPY에서 테스트됨: 주로 GBP/JPY 쌍에 대해 광범위한 테스트가 수행되었으며 Range Breakout EA는 다양한 기간에 걸쳐 유리한 성능을 보여주었습니다. 초점은 1시간 관점에 맞춰져 있지만 거래자는 다양한 자산과 기간에 따라 시스템의 잠재력을 탐색하는 것이 좋습니다.
메타트레이더 4, 링크
통화쌍: GBPJPY 기간: M5/M15/H1/H4 최소 입금액 : €50 - €€ 계좌 유형: 스프레드가 매우 낮은 ECN, Raw 또는 Razor. 중개인 : 저는 IC 마켓을 이용합니다. 그러나 스프레드가 가장 낮은 브로커는 무엇이든 중요: 최상의 결과를 얻으려면 LOW SPREAD 계정을 사용하는 것이 매우 중요합니다! 계좌 유형

The key to success is always good optimisation.
The system has a number of variables and in this case its simplicity is the key to its success. The system looks for the different "Gaps" as market entry failures and then debugs them through a stochastic analysis, i.e. the analysis of two moving averages to see if the price is overvalued or undervalued, and once this is done, the expert advisor will decide whether to perform an action or refrain from performing it. It is a very simple but power
FREE

Camarilla Swing Trade Indicator is an Indicator. Support and resistance points are calculated from the High Low Close of the previous TF Week's price.
What are Camarilla Pivot Points?
1.Camarilla Pivot Points is a modified version of the classic Pivot Point. 2.Camarilla Pivot Points was launched in 1989 by Nick Scott, a successful bond trader. 3.The basic idea behind Camarilla Pivot Points is that price tends to revert to its mean until it doesn't. 4.Camarilla Pivot Points is a mathematical
FREE

FREE VERSION OF THE PRICE ACTION ADVANCED LEVELS free on demo account. full product: https://www.mql5.com/en/market/product/94338 Accurate horizontal support and resistance levels Accurate for price action analysis. All Markets: forex, stocks, indices, metals, commodities ,and crypto Available for meta trader 5 Adjustable parameters
inputs: For multiple timeframe analysis: adjust "analysis_timeframe" accordingly "depth_of_retrenchments" represents how big the peaks or troughs are. "lookba
FREE

The indicator plots two lines by High and Low prices. The lines comply with certain criteria. The blue line is for buy. The red one is for sell. The entry signal - the bar opens above\below the lines. The indicator works on all currency pairs and time frames It can be used either as a ready-made trading system or as an additional signal for a custom trading strategy. There are no input parameters. Like with any signal indicator, it is very difficult to use the product during flat movements. You
FREE

This indicator is stand alone version from MP Pivot Levels (All in one) containing Woodie Pivots. Woodie’s pivot points are made up of multiple key levels, calculated from past price points, in order to frame trades in a simplistic manner. The key levels include the ‘pivot’ itself, and multiple support and resistance levels (usually up to three each). Traders use these levels as a guide for future price movements when setting up trades.
The pivot : (Previous high + previous low + 2 x previou
FREE
Aydmaxx Trade Tracker Description: Aydmaxx Trade Tracker is a powerful and user-friendly tool for traders, allowing you to monitor the current profit or loss for each trade in real-time. The indicator displays the information directly on the screen, helping traders quickly assess the results of their trading operations. Key Features: Displays the current profit or loss for all open positions in real-time. Customizable corner of the screen for displaying information (default is the bottom right c
FREE
To access the MT4 version of this EA you can contact via private message. Also you can contact for further modifications. strategy description: - Detect underlying trend using the BxTrender indicator in daily time frame. - Trigger entry using supertrend indicator in M15 time frame. - Also use supertrend indicator to set SL and TP accordingly. EA setup - Nasdaq and other indices(like DAX40) are suggested to be traded. - Risk per trade is hard coded to 0.5%. - Risk:Reward ratio is hard coded to 1:
FREE
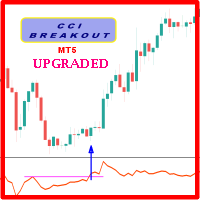
Probability emerges to record higher prices when CCi oscillator breaks out oscillator historical resistance level when exhibit overbought values. Since, oscillator breakout of support and resistance have similar effect as price breaks support and resistance levels, therefore, its highly advised to confirm price breakout with oscillator breakout; certainly, will have the same output in short trades. Concept is based on find swing levels which based on number of bars by each side of peak or troug
FREE

Auto Levels is a technical analysis indicator designed to automatically identify and draw support and resistance levels on price charts. The robot is capable of automatically identifying support and resistance levels based on historical price patterns, eliminating the need for manual analysis. You can set the maximum number of lines that the indicator plots as a parameter
FREE

Introduction
The RSI Plus is an innovative technical analysis tool designed to measure the strength and direction of the market trend. Unlike the traditional RSI indicator, the RSI Plus boasts a distinctive ability to adapt and respond to market volatility, while still minimizing the effects of minor, short-term market fluctuations.
Signal
Buy when the RSI plus has been in the oversold (red) zone some time and it crosses above the 20 level on previous candle close
Sell when the RSI
FREE

This indicator is especially for the binary trading. Time frame is 1 minutes and exp time 5 or 3 minutes only. You must be use martingale 3 step. So you must put lots size is 10 % at most. You should use Mt2 trading platform to connect with my indicator to get more signal without human working. This indicator wining rate is over 80% but you may get 100% of profit by using martingale 3 step. You should use MT2 Trading Platform to connect meta trader platform and binary platform . You can get mt2
FREE

(암호화폐 차트)
지정한 막대의 개수만큼 히스토리를 가져와서 인스턴트 데이터를 직접 보여주기 시작합니다.
모든 시간대에 일할 수 있는 기회를 제공합니다.
여러 기호로 작업할 수 있습니다.
이 앱은 백그라운드 서비스입니다.
시장 감시 화면에서 "S"로 시작하는 모든 기호의 이력을 다운로드하여 틱 데이터를 보여줍니다.
바이낸스 스팟의 실시간 거래 데이터를 MT5로 자동 전송합니다.
링크에서 스크립트를 실행하여 프로그램을 사용하세요. https://www.mql5.com/en/market/product/69000
이 프로그램은 설치가 필요합니다.
https://www.mql5.com/tr/market/product/73887
도구 메뉴 >> 옵션 >> Expert Advisors에서 WebRequest를 허용하고 URL을 추가해야 합니다. https://api.binance.com https://fapi.binanc

하모닉 패턴은 시장 반전점을 예측하는 데 가장 적합합니다. 이러한 패턴은 높은 승률과 하루 동안 다양한 거래 기회를 제공합니다. 저희 인디케이터는 하모닉 트레이딩 문헌에 기반하여 가장 인기 있는 하모닉 패턴을 식별합니다. 중요 사항: 이 인디케이터는 다시 그리지 않으며 (D 지점에서 패턴을 감지함), 따라잡지 않습니다 (패턴이 유효하거나 취소됨). 사용 방법: MT5 차트에 인디케이터를 끌어다 놓으세요. 패턴 감지를 TRUE로 설정하세요 (ABCD; Gartley). 원하는대로 편차를 조정하세요 (높은 편차는 더 많은 패턴, 낮은 편차는 더 적은 패턴). 색상을 원하는 대로 사용자 정의하세요. 필요에 따라 ENTRY POINT, TP 및 SL에 대한 경고를 활성화하거나 비활성화하세요. 패턴 감지 시: 알고리즘은 D 지점에서 패턴을 감지합니다. 경고가 활성화되어 있으면 패턴 감지에 대한 알림을 보냅니다. 패턴이 무효화되면 "패턴 취소"라는 메시지가 포함된 경고가 트리거됩니다. 성공적인

El indicador técnico propuesto es un sistema de medias móviles de múltiples marcos temporales diseñado para ayudar a los operadores del mercado financiero a seguir de cerca los movimientos tendenciales. Al combinar medias móviles de diferentes períodos, este indicador ofrece una visión más completa de la dirección de la tendencia, lo que permite a los traders identificar oportunidades de trading con mayor precisión. Al utilizar este indicador, los operadores pueden maximizar sus ganancias al tom
FREE

Inicialmente este indicador foi elaborado e pensado para rastrear pontos ou velas onde há força de tendência. Como nas grandes descobertas, cheguei ao indicador que mostra principalmente velas de reversão, pontos de tensão, alta liquidez, resistência. O indicador traz simplificação ao gráfico, indicando todos os pontos onde possivelmente teríamos lta´s, ltb´s, médias móveis, bandas, ifr alto. O indicador não faz o gerenciamento de risco, apenas mostra as velas onde podem ocorrer reversão. Lembre
FREE

The UJ_H1_170100007_S_OD_CF_SQX is an algorithmic trading strategy for MetaTrader, tested on USDJPY using the H1 timeframe from April 1, 2004, to April 24, 2024. There is no need to set up parameters, all settings are already optimized and fine-tuned.
Recommended broker RoboForex because of EET timezone.
You can find the strategy source code for StrategyQuant at the link: http://quantmonitor.net/listing/usdjpy-osma-impulse/
Key details are:
Parameters
MagicNumber: 170100007
Main
FREE

Provlepsis 지표에 오신 것을 환영합니다.
"Provlepsis"는 MQL 마켓을 위해 개발된 고급 지표입니다. 같은 시간대의 이전 바를 분석하여 시장 움직임의 잠재적 범위를 정확하게 계산하여 향후 가격 변동에 대한 소중한 통찰력을 제공합니다. 전통적인 ATR 지표와 달리 "Provlepsis"는 시간 요소를 고려하여 다양한 시장 조건에 적응하는 더 강력한 도구입니다. 밤에는 좁은 범위를 예측하고 활발한 거래 시간대에는 더 넓은 범위를 예측합니다. "Provlepsis"가 제공하는 포괄적인 범위 분석으로 거래 전략에서 경쟁 우위를 확보하세요. 여기에서 Provlepsis 지표의 길이와 시프트를 변경할 수 있는 전체 버전을 확인할 수 있습니다!
https://www.mql5.com/ko/market/product/98802
프로블렙시스 사용의 이유
범위 기반 트레이딩: 이 지표는 시장 움직임의 잠재적 범위를 식별하는 능력으로 범위 기반 트레이딩 전략에 가치를 제공할
FREE

I present the well-known Moving Average indicator.
This indicator is presented as a channel, where the upper and lower lines are equidistant from the main line by a percentage set by the user.
The indicator is easy to use. The basic settings of the moving average have been saved and a percentage parameter (Channel%) has been added.
Basic parameters:
Channel% - shows how much we want to deviate from the main line.
The indicator is freely available.
FREE

Special Offer ... It is totally free for all. New one coming soon...................
About This Indicator: RSI vs SMA Indicator: A Comprehensive Technical Analysis Tool for Better for Identify the Short and Long Signals.
The RSI vs SMA Indicator is a powerful technical analysis tool designed to understanding Market Price Fluctuation for Long or Short signals. This user-friendly Indicator good for both novice and experienced traders, providing valuable indication in price chart and separate wi
FREE

This EA is a robot based on two EMAs and an standard MACD. No martingale or grid strategies. All positions have their own stop-losses. Trading strategy: This robot uses fast and slow EMAs to check the trend of the currency, once the trend is known, the standard MACD will trigger the correct order. Placing the best take profit and stop loss depending on the strengh of the trend. The Expert Advisor is designed for best performance in EURUSD currency pair at a 15m timeframe. Both slow EMA and fast
FREE

FIRE FIRE FIRE !!! !!!
ea for all people see my work and can take advantage too. is always nicely have nice people trying new things.... i hope work like anothers but try on backtests first... i will let too the chat of support like anothers but can may change in future for one for free EA's... yeah will have more of it :D :D :D :D :D chat for free ea ( maintenance) That one i dont will talk how work, just try it...
#tradingbot #forex #trading #bourse #cac #money #crypto #c
FREE

Esse indicador é a combinação do RSI (IFR) com Média Móvel Simples aplicada o RSI em um único indicador para facilitar a criação de alguma estratégia. Fiz esse indicador para que um único indicador contenha os buffer necessários para implementar alguma EA.
Descrição dos Buffers para o EA,
Buffer 0 -> Valor do RSI Buffer 1 -> Valor da média móvel aplicada ao RSI
FREE

Elevate your trading with this Metatrader 5 expert – the Position Volume Calculator. This tool takes the guesswork out of risk management and profit optimization. Simply input your desired stop-loss points with dragging the stop-loss line, and let the expert advisor compute the optimal position volume for your trade. Plus, with customizable reward ratios, it's easier than ever to set your take-profit points for maximum gains. Trade with confidence and precision. Try the Position Volume Calculat
FREE

골드 타겟은 최고의 추세 지표입니다. 지표의 고유한 알고리즘은 기술 및 수학적 분석 요소를 고려하여 자산 가격의 움직임을 분석하고 가장 수익성이 높은 진입점을 결정하며 화살표 및 가격 수준(BUY Entry / SELL Entry) 형태로 신호를 발행합니다. 주문을 엽니다. 표시기는 또한 손절매 가격 수준과 이익 실현을 위한 5가지 가격 수준을 즉시 표시합니다.
주의: 표시기는 사용이 매우 쉽습니다. 한 번의 클릭으로 차트에 표시기를 설치하고 신호 및 가격 수준에 따라 거래하세요.
지표의 장점:
1. 표시기는 높은 정확도의 신호를 생성합니다. 2. 표시 신호는 다시 그려지지 않습니다. 가격이 각 라인을 넘으면 소리 알림(알림 및 메시지)이 장착됩니다. 3. 모든 브로커의 MetaTrader 5 거래 플랫폼에서 거래할 수 있습니다. 4. 모든 자산(통화, 금속, 암호화폐, 주식, 지수 등)을 거래할 수 있습니다. 5. 원하는 시간대(M15-M30 스캘핑 및 당일 거래/

모멘텀 반전은 가격 변동 및 바 형성의 강도 분석을 기반으로 가능한 반전 포인트 및 보정의 시작을 감지하기위한 강력한 도구입니다.
_________________________________
지시자 신호를 이용하는 방법:
표시기는 새로운 가격 표시 줄이 나타난 후 신호를 생성합니다. 가격이 지정된 방향으로 임계점을 돌파한 후 생성된 신호를 사용하는 것이 좋습니다. 표시기는 신호를 다시 그리지 않습니다.
_________________________________
표시기 매개 변수는 신호 화살표의 표시 스타일을 변경하는 것이 좋습니다. 계산에 사용되는 매개 변수를 변경하는 것은 제공되지 않습니다-이 내 제품의 철학 때문이다:안정성과 객관성.
_________________________________
귀하의 질문 및 제안을 환영하며 비공개 메시지로 보낼 수 있습니다
_________________________________
시장을 정복에 관심있는 모
FREE

With Break Even Trader placed onto your chart, it will automatically place the stop loss and take profit levels when you open a buy or sell order. And when you are in profit by the amount defined in user settings, it will automatically move your stop loss to that break even level, thereby protecting your trade from a loss. Features :
Simple to trade with you just enter your trade it will place the stop loss and take profit as input in user inputs. Sends you an alert when your trade is in profi
FREE

지수 이동 평균 (이중 또는 삼중) 엔벨롭 인디케이터는 금융 시장에서의 추세와 잠재적인 반전 지점을 식별하는 데 도움을 주는 기술 분석 도구입니다. 이 인디케이터는 트레이더들에게 이중 지수 이동 평균 (DEMA) 또는 삼중 지수 이동 평균 (TEMA) 두 가지 종류의 지수 이동 평균 중 선택할 수 있는 유연성을 제공합니다.
주요 특징:
- 이중 또는 삼중 지수: 분석 선호도와 필요에 따라 DEMA 및 TEMA 간 전환 가능.
- 사용자 정의 가능한 엔벨롭: 자체 대역폭 매개변수를 정의하고 엔벨롭의 외관을 거래 스타일에 맞게 조절할 수 있습니다.
- 추세 식별: 엔벨롭은 시장 트렌드를 시각화하는 데 도움이되며 상승 및 하락 트렌드를 식별하기 쉽게 합니다.
- 잠재적인 반전 지점: 가격이 엔벨롭을 접촉하면 잠재적인 반전 지점을 나타낼 수 있어 정보를 기반으로 결정을 내릴 수 있습니다.
- 사용자 친화적: 이 인디케이터는 MetaTrader 5 플랫폼에서 쉽게 설치하고
FREE

PRICE ACTION Semi-auto trade bot premium: This is a simple quantitative model that trades GOLD(XAUUSD) using automatic price action analysis algorithms Place it on any symbol or timeframe. The position sizes are calculated by multiplying 0.01 per USD 500 on account to ensure low risk exposure and also leaving free margin for hedging positions that reduce the overall risk exposure . This is what leads to stability in the model though it is possible that the model like any other might stop workin
FREE

SI Connect is a utility that establishes the connection to our servers to use FX Volume or the SIEA trading systems.
Technical instructions to prepare your terminal for the usage of SI Connect Allow web requests and insert https://stein.investments to the list of allowed URLs in your Terminal Options -> Subcategory Expert Advisors . You need only one running EA instance per terminal, but it has to run constantly in the background to grab the latest data from our data centre.
In case of quest
FREE

The UJ_H1_170147110_S_HH_CF_SQX is an algorithmic trading strategy for MetaTrader, tested on USDJPY using the H1 timeframe from April 1, 2004, to April 24, 2024. There is no need to set up parameters, all settings are already optimized and fine-tuned.
Recommended broker RoboForex because of EET timezone.
You can find the strategy source code for StrategyQuant at the link: http://quantmonitor.net/listing/usdjpy-awesome-oscillator-revolution/
Key details are:
Parameters
MagicNumber:
FREE

The advisor NewsCatcher Free opens trades when the price makes a reversal move from support and resistance levels. Market entries should be confirmed by the Relative Strength Index (RSI). The RSI is implemented as a tachometer. It is recommended to use this advisor in a highly volatile market after a political event or a release of major economic data.
You can use this advisor in the semi-automated mode (the RSI performs an information role) or in the fully automated mode (the RSI decides when
FREE

This EA uses the 20-period simple moving average (SMA). Buy position when the price above the SMA and Sell vice-versa. Extra indicators use to confirm the entry open. The EA will use trailing stop loss to take the maximum profit. Step positions will executed when the last floating position is met. This EA tested on XAUUSD pair and may works on other pairs. Good Luck!
FREE

Envelopes & RSI Scalper EA
Introducing the Envelopes & RSI Scalper EA, a cutting-edge expert advisor designed to make precise, high-frequency trades using advanced technical indicators and smart risk management techniques.
Key Features:
Envelopes Indicator Integration: The EA leverages the Envelopes indicator to identify optimal entry and exit points. By detecting price levels relative to moving average bands, the Envelopes indicator helps pinpoint potential breakouts and reversals, cruc
FREE

Volume Weighted Average Price (VWAP) is a trading benchmark commonly used by Big Players that gives the average price a Symbol has traded throughout the day. It is based on both Volume and price. Additionally we put in this indicator the MVWAP (Moving Volume Weighted Average Price). For those who do not know the usage and the importance od this indicator I recommend a great article about this subject at Investopedia ( https://www.investopedia.com/articles/trading/11/trading-with-vwap-mvwap.asp
FREE

Indicator developed in order to notify the user when the RSI enters and leaves the overbought and oversold regions, the information is shown in the form of audible and text alerts. Notifications can be disabled at any time. The indicator period can be changed by the user, and it is possible to insert the RSI indicator in the graph through the alerts. Aurélio Machado
FREE

Harmonic patterns are characteristic series of price movements with respect to Fibonacci levels, which statistically precede price reversals. This indicator searches for harmonic patterns. It is capable of recognising 26 classical and non-classical harmonic patterns : Classical Gartley Butterfly Alternate Butterfly Bat Alternate Bat Crab Deep Crab Three Drives Non-classical Shark Alternate Shark Cypher 5-0 Anti Gartley Anti Butterfly Anti Alternate Butterfly Anti Bat Anti Alternate Bat Anti Crab

The Rayol Code Hour Interval Lines indicator was designed to assist your trading experience. It draws the range of hours chosen by the user directly on the chart, so that it enables traders to visualize price movements during their preferred trading hours, providing traders a more comprehensive view of price movements and market dynamics. This indicator allows the user to choose not only the Broker's time, but also the Local time. This way, the user no longer needs to calculate local time in
FREE

Introduction to the Candle Time Indicator The Candle Time Indicator for MetaTrader 5, helps users know how much time on a candlestick is remaining.
Overview of Candle Time Indicator settings. TextColor: set the color of the countdown clock; FontSize: set the size of the font; Installation Guide Copy and paste the CandleTime.ex5 indicator files into the MQL5 folder of the Metatrader 5 trading platform. You can gain access to this folder by clicking the top menu options, that goes as follows: Fi
FREE

The traditional Money Flow Index indicator, this time, EA friendly . There are 3 buffers exposed that can be used by EAs to automatically analyze the Overbought and Oversold conditions of the quote. Just use the traditional iCustom() function to get these signals. This Money Flow Index calculation is based on the traditional Metaquote's MFI indicator.
SETTINGS
MFI Period Volume type to analyze (Real Volume or Ticks) Starting Overbought region Starting Oversold region
USING WITH EAs
Buffer
FREE
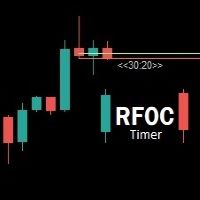
Uma informação de grande valor para o trader se localizar no tempo é a informação de quanto tempo temos para o encerramento do candle atual ou quanto falta para a formação de um novo candle. O RFOC Timer apresenta esta informação de forma clara e alocada à direita do candle atual. Adicionalmente o RFOC Timer acompanha a opção de inclusão das linhas de preços ASK e BID com e sem extensão a direita e/ou esquerda. Esta função auxilia, por exemplo, a não sobreposição das linhas de ASK e BID com as
FREE

CANDLESTICK_MT5
A very interesting indicator of candlestick patterns, converted from the free version of the CANDLESTICK indicator for the MetaTrader4 terminal to the version for the MetaTrader5 terminal. In addition to candlestick patterns, it draws support and resistance lines, which are perfectly worked out by the price on the chart. It can work on any timeframe. Has simple settings. When converting, the logic of work and the design of the original CANDLESTICK indicator for the MT4 termina
FREE

The JP_15_861542546_S_BB_CF_SQX is an algorithmic trading strategy for MetaTrader, tested on JP using the M15 timeframe from December 7, 2017, to June 2, 2023. There is no need to set up parameters, all settings are already optimized and fine-tuned.
Recommended broker RoboForex because of EET timezone.
You can find the strategy source code for StrategyQuant at the link: http://quantmonitor.net/listing/nikkei-breakout-zones/
Key details are:
MagicNumber: 861542546 Main Chart: Curren
FREE

At first, I got my teeth into Dragon Ultra Expert Advisor. Take your time to test demo. You should be always perfectly familiar with your Expert Advisor before a live trading. Based on the statistics, you are more likely to succeed if you learn from experience to use this. Dragon Lite is a free version for you to understand how the bot works. Parameter Trading Mode: Change to UNLIMITED. You should use the Dragon Training proficiently before using the Dragon Ultra .
The Forex T
FREE

The SyntheticaFX Zones Indicator simplifies the process of identifying key levels in the market where price reversals are likely to occur. By incorporating this tool into their trading strategies, traders can improve their decision-making, enhance risk management, and ultimately increase their chances of success in the financial markets. However, like all technical indicators, it should be used in conjunction with other analysis methods and not relied upon as the sole basis for trading decisions
FREE

This indicator studies price action as an aggregation of price and time vectors, and uses the average vector to determine the direction and strength of the market. This indicator highlights the short-term directionality and strength of the market, and can be used to capitalize from short-term price movements by trading breakouts or binary options. [ Installation Guide | Update Guide | Troubleshooting | FAQ | All Products ] Find market direction easily Confirm with breakouts or other indicators
FREE
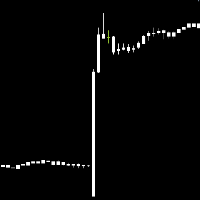
Have you ever seen Long candle sticks, quick price movements on the chart and feel like you missed out on a good trade. You can kiss that feeling goodbye with this Fundamental Expert. The ability to trade Economic events while asleep or watching Netflix or at work, has arrived. You will never miss out on big movements in forex trading with trading the news.
Why is the economic calendar important?
Economic indicators and events have the potential to significantly impact financial markets.
FREE

This indicator is very useful in observing the direction of the market. It allows users to enter multiple MA lines with specific display method. In addition, it is also possible to change the candle color same to color of the background of chart, so that we only focus on the MA lines. When a signal appears, represented by a red or green dot, we can consider opening a sell (red dot) or buy (green dot) order. Note: it need to set stoploss at the highest value of MA lines (with sell order) or lowe
FREE
MetaTrader 마켓은 거래로봇과 기술지표를 판매하기에 최적의 장소입니다.
오직 어플리케이션만 개발하면 됩니다. 수백만 명의 MetaTrader 사용자에게 제품을 제공하기 위해 마켓에 제품을 게시하는 방법에 대해 설명해 드리겠습니다.
트레이딩 기회를 놓치고 있어요:
- 무료 트레이딩 앱
- 복사용 8,000 이상의 시그널
- 금융 시장 개척을 위한 경제 뉴스
등록
로그인
계정이 없으시면, 가입하십시오
MQL5.com 웹사이트에 로그인을 하기 위해 쿠키를 허용하십시오.
브라우저에서 필요한 설정을 활성화하시지 않으면, 로그인할 수 없습니다.