Смотри обучающее видео по маркету на YouTube
Как купить торгового робота или индикатор
Запусти робота на
виртуальном хостинге
виртуальном хостинге
Протестируй индикатор/робота перед покупкой
Хочешь зарабатывать в Маркете?
Как подать продукт, чтобы его покупали
Новые торговые роботы и индикаторы для MetaTrader 5 - 158
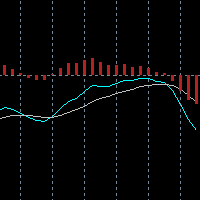
The built-in MACD does not properly display all the different aspects of a real MACD. These are: The difference between 2 moving averages A moving average of (1) A histogram of the difference between (1) and (2) With this indicator you can also tweak it as much as you want: Fast Period (default: 12) Slow Period (default: 26) Signal Period (default: 9) Fast MA type (default: exponential) Slow MA type (default: exponential) Signal MA type (default: exponential) Fast MA applied on (default: close)

One of the most popular methods of Technical Analysis is the MACD , Moving Average Convergence Divergence, indicator. The MACD uses three exponentially smoothed averages to identify a trend reversal or a continuation of a trend. The indicator, which was developed by Gerald Appel in 1979 , reduces to two averages. The first, called the MACD1 indicator, is the difference between two exponential averages , usually a 26-day and a 12-day average.

Moving Average EA ΜT5 — это полностью автоматизированный советник, который выводит торговлю скользящими средними на совершенно новый уровень. Moving Average EA MT5 может либо открывать одну сделку на покупку, когда MA разворачивается вверх (MA синего цвета), либо одну сделку на продажу, когда MA разворачивается вниз (MA красного цвета), либо может открывать новую сделку в том же направлении на каждой новой свече, если наклон направление скользящей средней остается неизменным. Ряд уникальны

The Inside Bar pattern is a very well known candlestick formation used widely by traders all over the world and in any marketplace. This approach is very simple and adds a little confirmation candle, so it adds a third past candlestick to the count to confirm the direction of the move (upward or downward). Obviously, there is no power on this candlestick formation if the trader has no context on what it is happening on the market he/she is operating, so this is not magic, this "radar" is only a
FREE

IVolX 2 DPOC volume iVolX 2 DPOC - индикатор динамического горизонтального объема для любых временных периодов
Основные настройки индикатора: VolumeSource - выбор данных для объемов (тиковые или реальные) DPOCOn - включение/отключение индикатора DPOCFrom - дата начала расчетов DPOCTo - дата окончания расчетов Индикатор позволяет в ручном режиме на графике выделять области для анализа изменения максимального объема во времени. Это можно сделать с помощью вертикальных линий, перемещая их п
Уникальный алгоритм трендовой торговли с расширенной фильтрацией и множеством функций, которые должны стать частью вашего торгового арсенала. Этот индикатор также может предоставить вам торговых советников (с целью тейк-профита), сканер успешности и многое другое. TrendMagiX PRO поставляется со встроенным сканером для нескольких пар и нескольких таймфреймов, который полностью настраивается. Пользователь может выбрать собственные символы и таймфреймы для мониторинга. + ВСЕ функции стандартного и
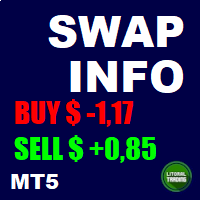
This is a script based tool that informs the swap from all the currency pairs (gold and silver too). It is possible to highlight pairs with a specific currency and whether the swap is positive or negative. In addition it is possible to complement the name of the symbols depending on the broker. The informations are showed in the Experts tab of the Toolbox (Ctrl+T). If you have any doubt or suggestion, please, contact us. Enjoy!
FREE
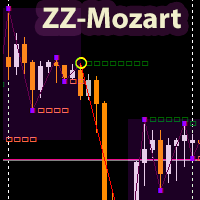
Индикатор ZigZagMozart основан на расчете продвинутого ZigZag-а. Отображает точки перелома тренда (белые квадраты), результирующие точки (желтые круги), флэтовые зоны (фиолетовые точки). Единственный параметр индикатора: "разворот в пунктах" - минимальное плече между вершинами индикатора. В индикаторе используется анализ рынка на основании стратегии известного современного трейдера Mozart. https://www.youtube.com/watch?v=GcXvUmvr0mY. ZigZagMozart - работает на любых валютных парах. При значени

This EA was researched and coded for years to come to life. It was tested with 99.9% tick data with spread swap and commission on all the currencies. The package includes fully tested and stress tested set files.
Always use the latest set files from the comment section!
Recommendations:
Minimum 1000$ starting deposit VPS for better trading experience The set files are for H1 timeframe At least 1:10 leverage
Introducing the Leopard EA for MT5: This Expert Advisor has been meticulously dev

Измеритель силы валюты дает вам краткое наглядное представление о том, какие валюты в настоящее время сильны, а какие - слабые. Измеритель измеряет силу всех кросс-пар форекс и применяет к ним вычисления для определения общей силы для каждой отдельной валюты. Мы рассчитываем силу валюты на основе тренда 28 пар.
Зайдя в наш блог MQL5, вы можете скачать бесплатную версию индикатора. Попробуйте перед покупкой без ограничений тестера Metatrader: нажмите здесь
1. Документация Вся документа

BeST_Hull MAs Directional Strategy is a Metatrader Indicator based on the corresponding Hull Moving Average.It timely locates the most likely points for Entering the Market as well as the most suitable Exit points and can be used either as a standalone Trading System or as an add-on to any Trading System for finding/confirming the most appropriate Entry or Exit points. This indicator does use only the directional slope and its turning points of Hull MAs to locate the Entry/Exit points while it

1. Фиксирую данные о ценах на каждую транзакцию. Контент файла данных: "время Tick", "цена ASK", "цена BID", "цена SPREAD", "количество предложений Tick". 2. В то же время, создается файл с цитируемыми данными на Один минутный цикл. Содержимое файла данных: "ASK time", "ASK OPEN цен", "ASK HIGH цен", "ASK CLOSE", "ASK CLOSE", "ASK CLOSE", "ASK CLOSE", "ASK CLOSE", "ASK CLOSE", "BID lose цен", "BID lose цен", "BID lose цен", "BID lose цен", "BID CLOSE цен", "BID CLOSE цен", "BID CLOSE цен", "BID

Технический индикатор Wave Vision измеряет относительную силу трендовых движений цены от ее средних значений за определенный период времени. Гистограмма показывает силу движения цены относительно линии нулевого уровня. Значения гистограммы, близкие к нулю, указывают на равенство сил между покупателями и продавцами. Выше линии нулевого уровня - бычий тренд (положительные значения гистограммы). Ниже линии нулевого уровня - медвежий тренд (отрицательные значения гистограммы).
Настройки:
S
FREE

** LIMITED version** This EA utility helps Price Action traders calculate the risk as Big Money profesional traders do: in points or percentages. Allows to also set a desired Profit:Risk ratio and optionally enter a second and third orders simultaneously with different ratios and risk percentages. Great for BTMM, ICT, and other methodologies.
Very simple to use, just "point and shoot"!!!
Full version available here .
FREE

GO IT - it is a Secure Automated Software for trade Forex market and indices.
ONLY RECO M ENDED FOR GBPUSD AND EURUSD Can used this EA whit 100$ in your account
The architecture is a Fully Automatic Autonomous Robot Expert capable of independently analyzing the market and making trading decisions
GO IT It is an advanced trading system. This is a fully automatic Expert Advisor. It is a 100% automatic system, the system controls both the inputs and

This EA utility helps Price Action traders calculate the risk as Big Money profesional traders do: as percentages of available funds. Allows to visually set a desired Profit:Risk ratio, where you want your stop-loss and take-profit levels. Optionally, enable a second and third orders to be placed simultaneously with different ratios and risk percentages. Great for BTMM, ICT, and other methodologies.
Very simple to use, just "point and shoot"!!! FREE limited version here .

A useful dashboard that shows the RSI values for multiple symbols and Time-frames. It can be easily hidden/displayed with a simple click on the X top left of the dashboard. You can input upper and lower RSI values and the colours can be set to show when above/below these values. The default values are 70 and 30. You can choose whether the dashboard is displayed on the right or left of the chart. If you want to have 2 dashboards on the same chart you must input a different name for each. The sca
FREE

Users of PVRSA / PVA certainly already know the Dragon indicator and its use.
The Dragon works as dynamic support and resistance and can be used for scalper or trend follower.
In addition to the Dragon we have the WGT (fast) and EMA (slow) averages that can show immediate movement and also trend movement.
Stay tuned for the Dragon's inclination!
The indicator can be used on any asset/currency pair and can be customized according to the trader's interest.
See also my volume analysi

Several techniques use volume as an important point in the trade. Whether to indicate strength, exhaustion, pullback weakness, among others.
In chief I quote Richard Wyckoff's theory, which said about the importance of looking price and volume.
However, there are several possibilities to filter what is volume that should be noticed.
PVRSA/PVA users use an indicator with specific colors, which assist in identifying the volume and type of movement that the price has made.
Will the high

#Multicurrency #Hedging #Martingale #28Symbols @AUD @CAD @CHF @JPY @NZD @USD @EUR @GBP In the globalisation process that the world economy has undergone in the last two decades, financial markets have played a leading role. The easy and fast access to information, together with the growing economic interdependence between the different commercial blocks, have caused more and more economic agents to participate in non-national financial markets. Even small investors, thanks to the Internet and

トレンド順張り型EA
こちらは仮想通貨向け自動売買プログラムとなっております。 シグナルも公開中
通貨ペア: 全ての通貨ペアに使用できますが、トレンド性の強い仮想通貨がおすすめです。 ロット数: 自動計算 パラメータ ・リスク:証拠金に対するロット数の割合です(0.01~3が推奨値です) ・マジックナンバー:EAを識別するためにご利用ください。 ポジション数: 最大1つとなっておりますのでリスクは最小限となっております。 時間足 :内部的に1H足を使用してますのでどの時間足でもエントリーは同じになります。 注文条件 ・一定期間の高値、安値を監視することでトレンドに対して順張りを行います。 ・トレンドを検知した時点で順張りを行い、トレンドが反転するまで追い続けます。 ・トレンドが反転したら決済&反対方向へのエントリーを行います。 その他 ・もちろん自己判断で途中で決済していただくことも可能です。決済後は再度トレンドが検知した際に順張りを行います。

Expert Advisor for use in all Market. For more details visit: Telegram group: https://t.me/SlakingFXEA Parameters Set Name Magic Number Allow Buy Allow Sell PipStep (points) Max Martingale Orders (0 unlimited) Max Loss $ day (0 don´t use) Mas Loss % day (0 don´t use) Max Profit $ day (0 don´t use) Mas Profit % day (0 don´t use)
K Period D Period Slowing Overbought Oversold Type of smoothing Calculation method
Lots Auto Lot Initial Balance for autolot calculate Martingale (1 don't use) Take P
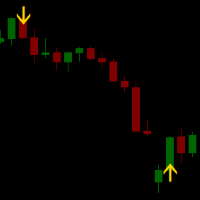
Signal RSI printa no gráfico os melhores momentos de entrada segundo o indicador RSI.
No gráfico aparecerá uma seta indicando o momento e a direção de entrada para a operação. O encerramento da operação se dá ao atingir o lucro esperado ou o stop. Se estiveres com uma operação aberta e aparecer outra seta de sentido inverso, inverta a mão e aproveite! Amplamente testado em gráficos de mini índice e mini dólar, bem como ações e FIIs.
Gráficos recomendados: 5, 10, 15 min.

SupeRobot is a fully automated trend robot working on the long run based mainly on the stochastic signal improved to work best with the EURUSD pair. After the backtest, it gave promising results from 2019 until today. It's recommended to have at least 300 $ on your trading account before using this robot to trade. In order to get the best results : Set "MaxPositions" up to 10. it's set by default to 1. (it sets the number of the maximum opened positions at the same time) Set leverage to 1:500. M

Получайте ежедневную информацию о рынке с подробностями и скриншотами в нашем утреннем брифинге здесь, на mql5 , и в Telegram ! FX Volume - это ПЕРВЫЙ и ЕДИНСТВЕННЫЙ индикатор объема, который дает РЕАЛЬНОЕ представление о настроении рынка с точки зрения брокера. Он дает потрясающее представление о том, как институциональные участники рынка, такие как брокеры, позиционируют себя на рынке Forex, гораздо быстрее, чем отчеты COT.
Видеть эту информацию прямо на своем графике - это настоящий геймчей

SI Connect - это утилита, которая устанавливает соединение с нашими серверами для использования FX Volume или торговых систем SIEA.
Технические инструкции по подготовке вашего терминала к использованию SI Connect Разрешите веб-запросы и вставьте https://stein.investments в список разрешенных URL в вашем терминале Опции -> Подкатегория советников . Вам нужен только один экземпляр советника на терминал, но он должен постоянно работать в фоновом режиме, чтобы получать последние данные из нашего ц
FREE
CAP Rebate Trading EA MT5 is an automatic trading robot, a high-frequency grid trading system. EA performs a great number of trades allowing it to make profit not only from Forex market but also from receiving rebates (returning part of a spread). Since the security margin for a locking position is about 25-50% (depending on the broker), CAP Rebate Trading EA works in two directions simultaneously in case the appropriate signals are present. [ Installation Guide | Update Guide | Submit Y

Этот индикатор отображает волновую структуру рынка в виде нескольких волновых уровней, вложенных друг в друга. Для каждого из этих уровней создается автоматическая предварительная (черновая) разметка волн в стиле Эллиотта (123..., ABC ... и т.д.). Эта разметка является полностью автоматической и абсолютно однозначной. Индикатор особенно полезен для начинающих волновых аналитиков, поскольку среди всех возможных вариантов волновой разметки позволяет сразу взять за основу наиболее адекв
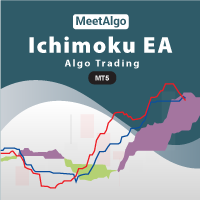
CAP Ichimoku EA MT5 trades using the Ichimoku Kinko Hyo Indicator. It offers many customizable Ichimoku trading scenarios and flexible position management settings, plus many useful features like customizable trading sessions, a martingale and inverse martingale mode. [ Installation Guide | Update Guide | Submit Your Problem | All Products ]
Functions Easy to use and customizable Ichimoku setting. Customizable indicator settings Built-in money management Grid trading when trade in Los
FREE

Индикатор Mono Waves предназначен для отображения на графике волнового поведения рынка. Его внешний вид представлен на слайде 1. Этот индикатор использует в своей работе индикатор PPPC ( Point - Percent Price Channel ), который можно бесплатно скачать в Маркете . Когда рынок движется вверх верхняя граница ценового канала строится по ценам High свечей (более подробно см. описание индикатора PPPC по ссылке данной выше). Чем выше поднимаются цены High , тем выше под
FREE

Преимуществом индикатора Price Surfing является алгоритм поиска экстремумов цены инструмента. Большинство сигналов индикатора расположены на локальных максимумах и минимумах цены . Для удобства трейдера потенциальная прибыль каждого сигнала выводится на график. Индикатор не перерисовывается, сигнал появляется после закрытия бара. Версия для МТ4 https://www.mql5.com/ru/market/product/46054 Описание параметров SendAlert - включение уведомления о новом сигнале SendEMail - включение отправки у

The TRIXs Indicator is the combination of the TRIX (Triple Exponential Moving Average) indicator with the addition of a SMA (Simple Moving Average) signal. It provides signs of trend continuity and the start of a new trend.
The entry and exit points of operations occur when the indicator curves cross.
It performs better when combined with other indicators.
FREE

Представлена экспертная система Stable Ex MT5 работает с валютной парой EURUSD и только с ней. Данная система реализовала в себе принцип пяти ордеров - то есть в одном направлении может быть сделано максимум пять ордеров, после чего суммарная позиция серии должна быть закрыта стопами, или реальными или виртуальными. Торговая система разработана таким образом, чтобы работать отдельно с серией ордеров на buy и отдельно с серией ордеров на sell. что делает торговую систему достаточно универсальной

One of the Best Volume Indicators, with the addition of a Moving Average for weighting volume over time average.
If the "Current Candle" Volume is X% greater than the Moving Average value, we will have a sign of increasing volume.
It can be a sign of Beginning, Continuity, Reversal or Exhaustion of the Movement.
Fully configurable and all options open, you can color and set ALL values as you see fit.
The 'Volume Break' shows volume bars in the same color as the candlestick, in addition

Индикатор Point-Percent Price Channel (PPPC или PP Price Channel) предназначен для отображения на графике канала, ширина которого задаётся как в процентах от текущей цены так и в пунктах. Его внешний вид представлен на слайде 1. При движении рынка вверх верхняя граница канала строится по ценам High свечей. При этом нижняя граница движется вслед за верхней на строго указанном расстоянии. При касании ценой нижней границы канала индикатор переключается на построение тепер
FREE

Combining the best of Price Action , Directional Movement , and Divergence / Convergence analysis, the Candle Color Trend is the easy and reliable way to identify the direction of the trend. The indicator automatically paints the candles according to the premise that the upward trend is defined by prices that form a series of ascending tops and bottoms. On the other hand, the downward trend is defined by prices that form a series of descending tops and bottoms.
Color Trend is certainly one
FREE

The TRIXe Indicator is the combination of the TRIX indicator (Triple Exponential Moving Average) with the addition of an EMA (Exponential Moving Average) signal. It provides signs of trend continuity and the start of a new trend.
The entry and exit points of operations occur when the indicator curves cross.
It performs better when combined with other indicators.
FREE

Показывает на графике полное наименование сивола.
Особенно актуально для Акций, CFD, Индексов и Фьючерсов.
Также при нажатии "вправо" (цифра 6) на Num клавиатуре выдает Алерт, из которого в графе "Эксперты" можно скопировать название
и использовать, например, для поиска дополнительной информации о компании.
В настройках можно выбрать цвет текста, размещение на графике и размер шрифта.
FREE

Медвежий/Бычий дивергентный бар. Один из сигналов системы "Торговый хаос" Билла Вильямса. (Первый мудрец)
При отдалении от индикатора "Аллигатор" и наличии дивергенции на индикаторе "Awesome Oscillator" показывает потенциальную точку смены движения.
Строится исходя из открытия/закрытия бара, положения относительно предыдущих, Аллигатора и АО.
При торговле вход осуществляется на пробитии бара (шорт - лоу бара, лонг - хай бара), а стоп лосс ставится за крайнюю точку бара.
Для более эффективног

Индикатор Price Control определяет краткосрочный и долгосрочный тренд. Анализ основан на выбраном таймфрейме. Индикатор показывает точки открытия сделок на продажу или покупку, а также указывает направление тренда на:
Краткосрочном периоде Долгосрочном периоде
Индикатор не только сигнализирует о немедленной покупке или продаже. Он указывает краткосрочный и долгосрочный тренд. Индикатор позволяет вам подробнее изучить реальный и исторический рыночный тренды!

Приседающий бар (Squat bar).
Один из элементов системы "Торговый хаос" Билла Вильямса.
Расчитывается исходя из разницы в изменении цены и тикового обьема.
Усиливает сигнал "Медвежьего/Бычьего Дивергентного разворотоного бара (Первый Мудрец)"если совпадает с ним или находится рядом.
Протестирован в сравнении с оригинальной программой "Investror's Dream".
Для более эффективного освоения системы читайте и смотрите материалы Билла Вильямса.
В настройках можо выбрать цвет бара.

Описание: Wave 5 - советник, который торгует по волной теории Элиота и уровням Фибоначчи.
Пара: EURUSD Таймфрейм: M15
Подробное описание: Советник Wave 5 торгует на паре EURUSD . Для анализа волнового паттерна используется комбинация нескольких индикаторов. Решение о входе в сделку принимается при формировании волн вверх или вниз. Наиболее эффективно эксперт торгует на периоде М15 на паре EURUSD . Здесь зафиксирован минимальный риск при достаточно высокой прибыли. Риск-менеджмент: Торговый

Benefits: A new and innovative way of looking across multiple timeframes and multiple indicators on any chart. Provides instant multi-timeframe analysis of any market. i.e. forex currency pairs, cryptocurrency pairs, commodities, etc. It offers precise indications across multiple timeframes of volatility as measured by RSI, ADX and STOCH within one chart. Helps you determine high probability trading setups. See example strategy in comments. Can see bullish/bearish volatility building across mult
Learning to trade on indicators can be a tricky process. Volatility Index indicator makes it easy by reducing visible indicators and providing signal alerts Entry and Exiting the market made possible through signal change Works well with high time frame to reduce market noise simplicity in trading guarantees success and minimal losses Our system creates confidence in trading in case of any difficulties or questions please send message

https://www.youtube.com/watch?v=2A80-qhd-9o https://www.youtube.com/watch?v=MMaC7BeY9q0 https://www.youtube.com/watch?v=G6HiLE9XfYk&t=1s
Описание советника NatalySix1. Автоматический советник на основе 3 MA, а также метод скользящей средней, Вы добавляете регулируемую комиссию по сравнению с используемой валютой, ТП указывает и шаг в случае, если он входит в неправильную позицию, при изменении условий покупки или продажи директор закрывает все позиции, если он или она превышает определенный

Tabajara Rules for MT5 , baseado em Setup Tabajara do professor André Machado, indica a direção do mercado com base em médias móveis quando tem velas na mesma direção da média móvel.
O indicador contém a regra de coloração aplicada aos candles e a média móvel.
O indicador permite a alteração dos parâmetros: período e método de suavização da média móvel.
O indicador permite a alteração das cores dos candles ( contornos e preenchimento) e da média móvel.
O modelo do professor André Machado c
FREE

*Non-Repainting Indicator Bruce Webb Explains How To Use Bruce's Price Predictor In Detail And Free Forex Strategy https://youtu.be/hfoB1tZZpTo Bruce's Price Predictor is an indicator that shows precise price reversals. A great arsenal to add to any chart. Bruce's Price Predictor points price reversals with high degree of accuracy and it is great for scalping on the 1min time frame, Or swing trading on the 1hr time frame. Buy and sell arrows are shown on the chart as for entry signals. They do

This is RSI with alarm and push notification -is a indicator based on the popular Relative Strength Index (RSI) indicator with Moving Average and you can use it in Forex, Crypto, Traditional, Indices, Commodities. You can change colors to see how it fits you. Back test it, and find what works best for you. This product is an oscillator with dynamic overbought and oversold levels, while in the standard RSI, these levels are static and do not change.
This allows RSI with alarm and push notific
FREE

Volume pressure and oscillator overbougth - oversold condition togedther. Signals appears on chart. Turnig points, trading ranges, support- resistance levels also. Change parameters in the trendscalp settings. TTF bars can be set: 8, or, 15, or 45, 150. Greather periods are very useful at strong support - resistance areas. IF ONE OF OUR FREE INDICATOR IS NICE TO YOU, FEEL FREE TO BUY AT LEAST OUR CHIEPST PRODUCT TO DONATE US. "Lots of small peace can be a mountain" ( nathan rothschild, john len
FREE
Yellow mouse scalping Yellow mouse scalping - полностью автоматический советник, предназначенный для торговли в ночное время на спокойном рынке. Стратегия - ночной скальпинг. Для поиска точек входа используются стандартные индикаторы RSI и ATR. Закрытие сделок происходит по авторскому алгоритму, что значительно улучшает возможности контроля рисков и безопасности депозита. Рискованные стратегии типа "мартингейл" не используются. Мониторинг работы советника, а также другие мои разработки можно
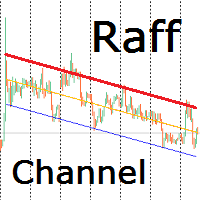
Индикатор строит канал Раффа на основе линейной регрессии. Красная линия тренда может использоваться для принятия решения о покупке или продаже внутрь канала при подходе цены к ней. Настройками можно задать ширину канала по коэффициенту отклонения от базовой линии или по максимальному и минимальному экстремуму. Так же можно включить продолжение канала вправо от текущих цен. Индикатор канала регрессии Раффа – удобный инструмент, значительно облегчающий работу современного трейдера. Он может быть

Pulsar it is a Secure Automated Software for trade Forex market and indices.
The architecture is a Fully Automatic Autonomous Robot Expert capable of Independently analyzing the market and making trading decisions.
Pulsar It is an advanced trading system. This is a fully automatic Expert Advisor.
NO INPUT TO SELECT FOR THE TRADER ALL AUTO MATED
THIS SYSTEM IS ALWAIS IN THE MARKET IN THE TWO DIRECCTION MAKE WINING CYCLES
PULSAR . It is a 100% automatic system, the system con

Multi time frame, multy currency special swing volume indicator with engulfing waves too. Simpler to use compare to Weis Wave. User don't need to adjust wave size. Just use of the basic or the upper time frames. As a multi time frame indikator user can do very complex time frame analysyses. As well as a multy currency indicator one can make market sector-segment analysyses. Use with Wckoff principles.
FREE

With this indicator user can determine not just pivot like turning points. User able to spot trading ranges boundaries and support-resistance levels. In a strong trend the reverse signals also gives us excellent entry points. Recommended user settings: In the Attis volume: look back period : 1 or (3) MA_Lenght 99. ( of course one can play with the settings and get tailored signals... as you need)
FREE

Только прибыль!
Это умный сеточный торговый робот. Он работает на моём оригинальном алгоритме! При средних рисках показывает более 100% прибыли в год. ( Тестировался исключительно на реальных тиках и реальных счетах ) Этот робот создан для того чтобы получать доход больше чем предлагает любой банк. Торгует автоматически круглосуточно на любой валютной паре! ( Не рекомендую "экзотические" валютные пары ) Регулируемые риски. Регулируемый объем позиции. Регулируемый шаг сетки. Регулируемый уро

Удобная информационная строка на графике.
Показывает стоимость минимального пункта с учетом выбранного обьема (выбор в настройках) Показывает своп которотких и длинных сделок с учетом выбранного обьема. Само умножает в дни тройного свопа и указывает день недели в который он начисляется Показывает текущий спред по текущему инструменту Показывает остаток времени до следующего бара по текущему Таймфрейму. В настройках можно выбрать цвет, размер шрифта, размещение и обьем.
FREE

Профессиональная инновационная система для торговли на реальном счете. Основана на закономерностях закрытия разрывов (гэпов) в движениях цен. Возможность адаптации к любому рынку. Минимальный депозит от 10$.
Особенности торговой стратегии В котировках валютных пар часто образуются гэпы (разрывы в графике движения цены). Обычно они возникают после выходных дней или праздников. Это обусловлено изменением некоторых фундаментальных факторов рынков во время отсутствия торгов. Поэтому сразу после от
Индикатор разворота тренда
Этот индикатор отлично работает на начальных стадиях тренда, обнаруживая его разворот.
Рекомендации по торговле : - Сигнал формируется на текущей свече. - Вход в сделку рекомендуется на следующей свече. - Целевая прибыль составляет 20-30 пунктов. - Есть три варианта установки стоп-лосса: 1. Выход из сделки при противоположном сигнале. 2. Установка стоп-лосса непосредственно за сигналом. 3. Установка стоп-лосса на ближайшем максимуме или минимуме. - Рекоменду

Forex Driver - отличный инструмент для обнаружения пиков и впадин на графике. Данный индикатор использует модифицированный алгоритм обнаружения пиков и впадин. Этот алгоритм включают в себя индикатор Fractals и индикатор ZigZag.
Этот инструмент нужно использовать для анализа пиков и впадин, а также для обнаружения паттернов, или для других целей.Вы можете использовать этот мощный инструмент в своих целях на свой страх и риск.

Данный бот основан на анализе адаптивных скользящих средних. Эксперт отличается стабильными сигналами, Которые можно использовать как точные кратковременные сигналы. Это полускальперская система, которая анализирует рынок при помощи надежных индикаторов. Скальперская это система или нет, зависит от параметров TakeProfit и StopLoss. Пользуясь данным советником, нужно понимать что данный бот требует оптимизации. Бот работает как на счетах неттнг так и на счетах хееджинг. Но настройки необходимо о

Strategy Manager is a Multi-Time-Frame & Multi-Currency Dashboard for Metatrader 4 and 5. Thanks to a free, external graphical user interface, build your own strategy by combining any indicators and loading them into the dashboard to see the result ! In addition, you can precisely set-up your Auto-trading & Notifications and use indicators for Stop-Loss, partial profit or limit. Filter your automatic trading & notifications with forex calendar and more. Open and Manage your orders directly w
XETERA MULTI TP MANAGER Xetera Multi TP Manager for Vix75 is an Expert Advisor specially designed for Volatility 75 Index on the Meta Trader 5 platform to manage trades even while you are away or asleep. Many Forex Signal Services out there use multiple take profit levels such as TP1, TP2, and TP3. The signal services give you multiple target levels to increase your profit, but the problem is you always need to monitor your trades and move the Stop Loss, trailing. So, we fixed this issue by d

XETERA MULTI TP MANAGER Xetera Multi TP Manager for FX is an Expert Advisor specially designed for Forex on the Meta Trader 5 platform to manage trades even while you are away or asleep. Many Forex Signal Services out there use multiple take profit levels such as TP1, TP2, and TP3. The signal services give you multiple target levels to increase your profit, but the problem is you always need to monitor your trades and move the Stop Loss, trailing. So, we fixed this issue by developing our EA t
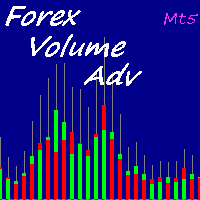
Forex is the most liquid market in the world. For this reason real volumes are not available. Some indicators use the number of ticks, in other cases the broker can supply volumes informations but they will be only data about that broker. Volumes are important becase they will form the price and volatility of the market. Using an algorithm this indicator can give you a very good approximation of the volumes for each candle.
How to read the indicators?
This version provides you many visualiza

Demo Version of Strategy Manager Plus ! This Demo is a simply view of the Dashboard with the followings strategy : - if SMA 6 is upper than SMA 18 --> Blue color - if SMA 6 is lower than SMA 18 --> Red Color No need of the external GUI, Load configuration is not available, no manual trading is available. Visit https://www.mql5.com/en/market/product/46420 for full version !
FREE
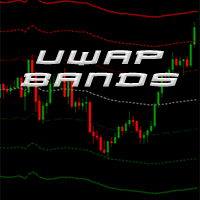
This indicator plots VWAP with 4 Standard Deviation bands. In finance, volume-weighted average price (VWAP) is the ratio of the value traded to total volume traded over a particular time horizon (usually one day). It is a measure of the average price at which a stock is traded over the trading horizon. VWAP is often used as a trading benchmark by investors who aim to be as passive as possible in their execution. Many pension funds, and some mutual funds, fall into this category. The aim of usi

Самые продаваемые советники на рынке стоят очень дорого, и в один прекрасный день они внезапно исчезают. Это связано с тем, что одна стратегия не будет работать на рынке форекс все время. Наш продукт уникален среди всех других на MQL Marketplace, потому что наш советник имеет более 34 встроенных индикаторов, которые позволяют каждый раз добавлять больше стратегий. Вы строите свою стратегию и постоянно обновляете ее. Если одна стратегия не работает, просто постройте другую, используя только одног

Индикатор отображает (на выбор): коэффициент ранговой корреляции Спирмена, линейный коэффициент корреляции Пирсона, коэффициент ранговой корреляции Кендалла, коэффициент корреляции знаков Фехнера. Этот осциллятор показывает точки возможного разворота рынка, когда цена выходит за уровни перекупленности и перепроданности. Доступно 4 метода дополнительной фильтрации полученных значений: простой, экспотенциальный, сглаженный, линейно-взвешенный. После закрытия бара значения фиксируются и не перерис

ULTIMATE SCALPING MT5 - это автоматизированный профессиональный скальперский советник разработанный для работы на рынке FOREX . В стратегии применяется индекс относительной силы ( RSI relative strength index) и средний истинный диапазон ( ATR average true range), для того, чтобы определить лучшие точки входа в рынок. Советник подходит как опытным трейдерам так и новичкам. Для работы подойдут наиболее волатильные пары: GBPUSD, USDCAD, EURUSD, USDJPY, USDCHF, AUDUSD, NZDUSD. MT4 version: http
MetaTrader Маркет - торговые роботы и технические индикаторы для трейдеров, доступные прямо в терминале.
Платежная система MQL5.community разработана для сервисов платформы MetaTrader и автоматически доступна всем зарегистрированным пользователям сайта MQL5.com. Ввод и вывод денежных средств возможен с помощью WebMoney, PayPal и банковских карт.
Вы упускаете торговые возможности:
- Бесплатные приложения для трейдинга
- 8 000+ сигналов для копирования
- Экономические новости для анализа финансовых рынков
Регистрация
Вход
Если у вас нет учетной записи, зарегистрируйтесь
Для авторизации и пользования сайтом MQL5.com необходимо разрешить использование файлов Сookie.
Пожалуйста, включите в вашем браузере данную настройку, иначе вы не сможете авторизоваться.