Смотри обучающее видео по маркету на YouTube
Как купить торгового робота или индикатор
Запусти робота на
виртуальном хостинге
виртуальном хостинге
Протестируй индикатор/робота перед покупкой
Хочешь зарабатывать в Маркете?
Как подать продукт, чтобы его покупали
Новые технические индикаторы для MetaTrader 5

Каждый покупатель этого индикатора получает дополнительно Бесплатно:
Авторскую утилиту "Bomber Utility", которая автоматически сопровождает каждю торговую операцию, устанавливает уровни Стоп Лосс и Тейк профит и закрывает сделки согласно правилам этой стратегии, Сет-файлы для настройки этого индикатора на различных активах, Сет-файлы для настройки Bomber Utility в режимы: "Минимум Риска", "Взвешенный Риск" и "Стратегия Выжидания", Пошаговый видео-мануал, который поможет вам быстро установить, на
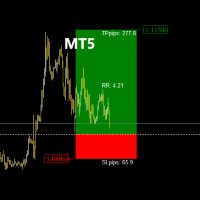
TradeManagerRR Visualizer MT5 — это инструмент управления торговлей, предназначенный для трейдеров, которые хотят легко визуализировать уровни взятия прибыли (TP) и стоп-лосса (SL) на графике. Эта первоначальная версия представляет собой простую графическую визуализацию, которая отображает зоны SL и TP, а также цену входа. Обратите внимание, что текущая версия сосредоточена исключительно на графическом отображении зон SL и TP в виде фигур на графике. Характеристики текущей версии: Отображение
Haven Average Daily Range - индикатор, который рассчитывает и отображает средний дневной диапазон цены для финансовых инструментов на Форекс и других рынках. Другие продукты -> ЗДЕСЬ Ключевые особенности: Расчет ADR на основе нескольких периодов (5, 10 и 20 дней) Отображение уровней ADR с автоматическим изменением стиля при достижении диапазона Четкая визуальная индикация начала и конца торгового дня Настраиваемые параметры отображения (цвет, толщина линий) Отображение ценовых меток для лучшей
FREE

# Wave Trend Oscillator (WTO) User Guide
## Overview Wave Trend Oscillator is a powerful technical analysis tool used to analyze price momentum and trend direction. It visualizes market conditions using two main lines (WT1 and WT2) and a histogram.
## Components 1. **WT1 (Green Line)**: Main trend indicator 2. **WT2 (Red Line)**: Signal line 3. **Histogram (Blue)**: Shows the difference between WT1 and WT2 4. **Arrows**: Mark crossover points - Green Arrow: WT1 crosses above WT2 (Buy signa

RSI ABCD Pattern Finder: Technical Strategy 1. How the Indicator Works Combines the classic RSI with automatic detection of ABCD harmonic patterns . Key Components Standard RSI (adjustable period) Peak and Trough Markers (arrows) ABCD Patterns (green/red lines) Overbought (70) and Oversold (30) Filters 2. MT5 Setup period = 14 ; // RSI period size = 4 ; // Maximum pattern size OverBought = 70 ; // Overbought level OverSold = 30 ; // Oversold level Filter = USE_FILTER_ YES ; // Confirmation filte
FREE

Speed Scalp Indicator – NON-Repaint
The Ultimate Tool for Fast and Precise Scalping
Perfect for Gold (XAUUSD) & Lower Timeframes The Speed Scalp Indicator is a powerful, non-repainting trading tool specifically engineered for scalpers who thrive on speed, precision, and high-frequency entries. Tailored for timeframes 30 minutes and below , this indicator is especially optimized for Gold (XAUUSD) , making it an essential companion for traders focusing on volatile instruments and rapid

I am a trader specializing in the development of rare , exclusive , high-performance trading bots designed for serious traders who are committed to achieving consistent profitability and success. This free indicator is more than just a visual tool—it powers the Midnight Throttle EA , an automated trading system that executes trades based on the precise market conditions this indicator observes. Midnight Watch : A Pro-Level Tool for Precision Market Analysis. An advanced , multi-functional MetaTr
FREE
«Секретный торговый инструмент, запрещенный профильными фирмами (они не хотят, чтобы вы знали!)»
Откройте для себя максимальное торговое преимущество - без советников! (Сделано для трейдеров, трейдером. Не робот - только чистая торговая сила!)
Боретесь с фальшивыми прорывами, внезапными разворотами или манипулированием рынком? Этот мощный торговый инструмент дает вам лазерно точные сигналы даже при быстром движении рынка, помогая вам обнаружить высоковероятные входы как профессионалу!
Ин
Volumatic Trend is a powerful, trend-following indicator that merges directional analysis with real-time volume behavior. By combining adaptive trend logic and volume overlays, it gives traders a detailed snapshot of market conviction and potential turning points. From instant trend shift detection to volume-weighted candle visuals, this tool brings deeper context to price movement. MT4 Version - https://www.mql5.com/en/market/product/136210/ Join To Learn Market Depth - https://www.mql5.co
FREE

Индикатор Multi Timeframe Candles — это мощный инструмент визуализации, призванный помочь трейдерам согласовать свой анализ нижнего таймфрейма со структурой верхнего таймфрейма. Отображая свечи из выбранного верхнего таймфрейма (H1, H4, D1 и т. д.) непосредственно на вашем текущем графике, этот индикатор дает вам более ясную перспективу общего повествования рынка без переключения графиков.
Кому нужен этот индикатор? Этот инструмент идеально подходит для: Концепция умных денег (SMC)/Трейдер
Linear Trend Predictor - Трендовый индикатор сочетающий в себе точки для входа и линии поддержки направления. Работает по принципу пробития ценового канала High/Low.
Алгоритм индикатора фильтрует рыночный шум, учитывает волатильность и рыночную динамику.
Возможности индикатора
Методами сглаживания показывает рыночную тенденцию и точки входа для открытия ордеров BUY или SELL. Подходит для определения краткосрочных и долгосрочных движений рынка, анализируя графики на любых таймфреймах. Адаптивн

Candle Volume Strength — это расширенный индикатор анализа объема, который дает представление о текущей битве между покупателями и продавцами. Он рассчитывает и визуализирует изменения объема в реальном времени, помогая трейдерам подтверждать прорывы, тренды, откаты и развороты с большей точностью.
Основные характеристики: Подтверждение на основе объема — индикатор отслеживает изменения тикового объема и оповещает о смене рыночной власти между покупателями и продавцами. Проверка тренда и про
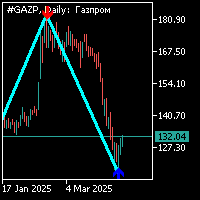
Индикатор zig-zag стандартный с периодом 34 с дополнительным сигналом в виде стрелки. Дополнительный сигнал, рассчитывается отдельно от индикатора zig-zag.Работа по данному индикатору происходит так: 1. при формировании отрезка индикатора zig-zagа и появления дополнительного сигнала в виде стрелки, нужно открывать позицию в сторону направления стрелки; 2. при формировании ещё одного плеча индикатора zig-zag в противоположную сторону дополнительного сигнала (стрелки) на вершине предыдущего плеч
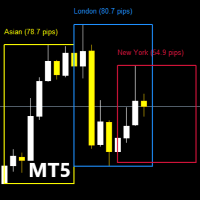
Перед тем как перейти к функциям этого индикатора, пожалуйста, не забудьте оценить этот продукт, оставить комментарий, чтобы поделиться своим опытом, и подписаться на мою страницу, чтобы быть в курсе последних обновлений и новых инструментов. Ваша поддержка бесценна и помогает мне постоянно улучшать свои разработки! Описание: TradingSessionPipsVisualizer - Профессиональный инструмент для освоения торговых сессий Мгновенно визуализируйте Forex сессии и оптимизируйте время торговли! TradingSessi
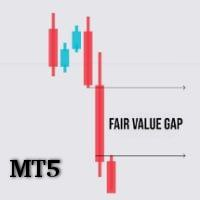
FVG Analyzer — Идеальный Инструмент для Точного Обнаружения Fair Value Gaps (FVG) FVG Analyzer — это мощный и полностью настраиваемый индикатор, созданный для серьёзных трейдеров, использующих Fair Value Gaps (FVG) в своей стратегии. Благодаря интеллектуальному анализу и чистой визуализации вы легко определите рыночные неэффективности — области, куда цена, скорее всего, вернётся, прежде чем продолжить движение по тренду. Основные функции: Автоматическое определение FVG (бычьи и медвежьи)

What is Linear Regression? Linear regression is a statistical method used to model the relationship between price and time. In forex trading, it helps traders identify trends, potential reversals, and areas of support and resistance. Uses of Linear Regression in Forex Trading Trend Identification The regression line acts as a dynamic trendline, showing whether the market is trending upward or downward. Traders can use the slope of the regression line to measure trend strength. Support and Resist

Prior Cote — это простой, современный и необходимый индикатор для трейдеров, использующих технический анализ на основе уровней предыдущего дня. Он автоматически отображает на графике следующие уровни предыдущей торговой сессии: Открытие Максимум Минимум Закрытие Скорректированная цена (среднее значение между максимумом, минимумом и закрытием) Идеально подходит для: Стратегий разворота и пробоя Анализа уровней поддержки и сопротивления Настроек для внутридневной и свинг-торговли ️ Полностью н
FREE
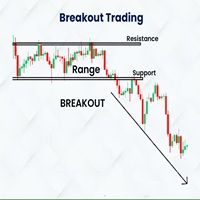
Indicador Basado en la estrategia de ruptura del rango de londres de Amaury Benedetti.
Este indicador dibuja automaticamente el rango, el maximo y minimo y sus correspondientes lineas de stoploss, entrada y takeprofit.
SE RECOMIENDA USAR EN M1 EN EL US30 (DE ACUERDO A LA ESTRATEGIA)
Los valores se pueden modificar de acuerdo a la necesidad del usuario, tambien se tienen mas configuraciones para dibujar cualquier rango en diversos horarios y con diferentes configuraciones de sl, tp, etc
Detal
FREE

Introduction! to the Indicator that Connects Trend , Pattern , and Candlestick Trigger 3 Steps in Under 30 Seconds ️ Trade effortlessly — no analysis required, Your smart assistant is ready to simplify your workflow No more chart overload Trade with confidence using smart bias detection Compatible with all currencies, crypto, stocks, metals, indices, and any timeframe Just click and execute — it’s that simple Ideal for busy traders who want speed and clarity. TPTSyncX is a powerfu
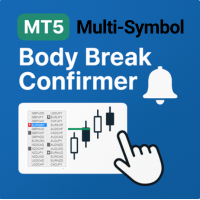
The Body Break Confirmer MT5 allows traders to set real-time alerts when the price breaks the body of the previous candle — helping confirm potential market reversals on a pre-selected symbol, timeframe, and direction. Body breaks are highly effective for confirming reversals on higher timeframes, starting from H1and above. Body Break Confirmer features a multi-symbol tracking panel with symbol buttons to instantly load any symbol to the chart for easy alert placement. Unlike standard reversal
FREE
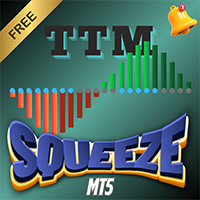
Overview The TTM Squeeze indicator helps identify low volatility periods (squeeze) that often precede price breakouts. It uses Bollinger Bands (BB) and Keltner Channels (KC) to determine when the market is "coiling" and ready to move. Configuration Guide Volatility Settings The indicator uses Bollinger Bands to measure market volatility. When BBs are inside Keltner Channels, a squeeze is detected. The squeeze suggests the market is consolidating and may soon break out. True Range Option Optional
FREE

MT4 version Overview The Lowess Channel indicator is a smoothed trend-following tool designed to help traders identify the direction of the trend , detect flat or ranging markets , and spot breakouts from consolidation zones. It creates a central smoothed line with upper and lower channel boundaries, adapting to market noise while maintaining clarity. How It Works The indicator builds a channel around a smoothed price line. The central line reflects the current trend. The upper and lower bounda
FREE

Индикатор EMA без Задержки (на базе ИИ) – Профессиональное Решение для Трейдинга Улучшите точность своих сделок с индикатором EMA без задержки — современным инструментом, устраняющим традиционные временные лаги скользящих средних. Искусственный интеллект обеспечивает мгновенные и точные сигналы рынка. Основные Преимущества: Исключительная Скорость : Минимальная задержка при смене тренда. Работает в Любых Рынках : Форекс, акции, криптовалюты, сырьё. Чёткие Тренды : Снижение ложных сигналов, сохра
FREE
Level Box Tool is a powerful and user-friendly custom indicator designed for traders who utilize technical analysis tools like rectangles and trend lines to identify key support, resistance, and price zones. This tool simplifies and speeds up the process of marking chart levels, offering both visual clarity and precision with its fully customizable panel, and now includes price-cross alerts — so you’ll never miss a key level again. MT4 Version - https://www.mql5.com/en/market/product/136009/ Jo
FREE
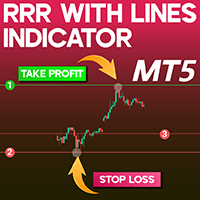
RRR with lines Indicator Download MT5 Effective risk management is a fundamental aspect of sustainable trading in financial markets. The RRR Indicator in MetaTrader 5 provides traders with a structured approach to calculating the Risk-to-Reward Ratio (RRR) . By drawing three adjustable horizontal lines, it assists traders in setting Stop Loss and Take Profit levels with precision. «Indicator Installation & User Guide» MT5 Indicator Installation | RRR with lines Indicator MT5 | ALL Products By
FREE
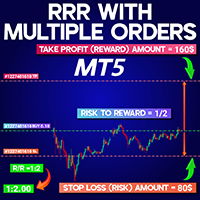
RRR with Multiple Orders Indicator MT5 The RRR with Multiple Orders Indicator MT5 is a powerful utility in the MetaTrader 5 platform that calculates and displays the risk-to-reward ratio for active trades. Especially useful for traders who manage several open positions simultaneously, this indicator helps monitor and control risk exposure more effectively. It shows the R/R values clearly inside a box located in a corner of the chart window, making real-time evaluation of trades easier. «Indicato
FREE
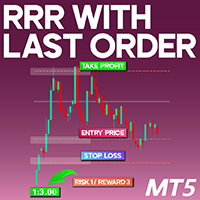
Risk-Reward Ratio with Last Order Indicator for MT5 The Risk-Reward Ratio with Last Order (RRO) Indicator is an essential tool designed for traders using the MetaTrader 5 (MT5) platform. This indicator helps users assess the risk-to-reward ratio of their trades by calculating the distance between the stop loss, take profit, and entry point . The resulting ratio is prominently displayed in the top left corner of the chart, allowing for quick and easy evaluation. «Indicator Installation & User Gui
FREE
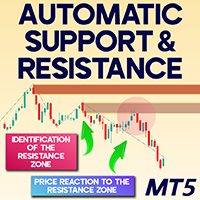
Automatic Support & Resistance Indicator for MT5
The Automatic Support & Resistance Indicator for MT5 is a sophisticated tool tailored for MetaTrader 5 users, engineered to systematically highlight significant support and resistance price zones. It marks support levels using green shades (dark green for newly formed zones, light green once retested) and resistance areas in brown tones (starting with dark brown and lightening after confirmation), offering traders visual clarity in identifying cri
FREE
SyntheticaFX Boom and Crash is a powerful tool designed to highlight potential spike opportunities in the market, exclusively for traders focusing on Crash and Boom indices. This indicator is strictly optimized to operate on the 3-minute (M3) timeframe and supports only the following pairs: Crash 1000 Index , Crash 900 Index , Crash 600 Index , Crash 500 Index , Crash 300 Index , Boom 1000 Index , Boom 900 Index , Boom 600 Index , Boom 500 Index , and Boom 300 Index . It will not display signa
FREE

Overview Inspired by Tradingview’s falconCoin, The Market Cipher indicator is a momentum oscillator used to detect overbought/oversold conditions and potential trend reversals. Traders can also use it to spot divergences between price action and momentum for early entry or exit signals. Configuration Guide Core Indicator Settings The indicator calculates momentum using a short-term and a longer-term average. Momentum is plotted as a wave oscillating between overbought and oversold thresholds. Ov
FREE
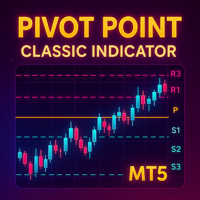
Detailed Description: The Pivot Point Classic Indicator is designed for traders who rely on classic pivot points and midpoints levels for their trading strategies. By automatically calculating and plotting these levels, the indicator provides a clear, visual representation of critical price areas where the market may reverse or break out. Key Features: Automatic Pivot Point Calculations : Automatically calculates pivot points, three support (S1, S2, S3) and resistance (R1, R2, R3) levels bas
FREE

NOTE: CYCLEMAESTRO is distributed only on this website, there are no other distributors. Demo version is for reference only and is not supported. Full versione is perfectly functional and it is supported. CYCLEMAESTRO , the first and only indicator of Cyclic Analysis, useful for giving signals of TRADING, BUY, SELL, STOP LOSS, ADDING. Created on the logic of Serghei Istrati and programmed by Stefano Frisetti ; CYCLEMAESTRO is not an indicator like the others, the challenge was to inter
Индикатор SyntheticaFX Scalper Pro
Индикатор SyntheticaFX Scalper Pro — это универсальный и удобный инструмент, разработанный для помощи трейдерам в определении точек входа с высокой точностью на различных таймфреймах и для всех валютных пар. Этот индикатор предоставляет четкие визуальные сигналы на графике, а также рекомендуемые уровни стоп-лосса (SL) и тейк-профита (TP), что упрощает планирование сделок с уверенностью. Благодаря встроенной панели управления индикатор SyntheticaFX Scalper Pro
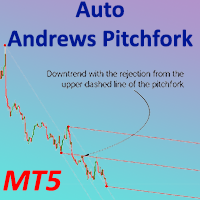
Auto Andrews Pitchfork indicator MT5
The Auto Andrews Pitchfork indicator MT5 is a specialized technical tool on the MetaTrader 5 platform that automatically plots three equidistant, parallel trendlines by using three selected pivot points (significant highs and lows). These lines serve as evolving zones of support and resistance, providing actionable trade signals when price interacts with them. This tool simultaneously generates two pitchfork patterns—one outlined in dotted lines and the othe
FREE
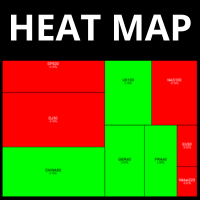
Dynamic Heatmap for MetaTrader 5 — Instantly Spot Market Opportunities Revolutionize the way you see the markets with the most complete and intelligent Heatmap for MetaTrader 5. Designed for traders who demand speed and clarity in decision-making, our Heatmap creates a powerful visual representation of market performance in real time. Key Benefits Instant Read of Market Strength Instantly see which assets are leading or lagging. Dynamic color coding for quick identification: green for ri
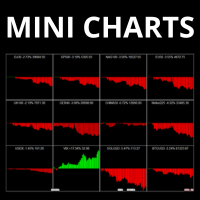
Your market overview, now crystal clear. With our Mini Charts Indicator for MetaTrader 5 , you’ll have the power of multiple charts inside a single, ultra-clean workspace. No more switching between assets or opening dozens of charts. Our Mini Charts give you instant visual snapshots of multiple markets — all in real time. Each mini chart displays the price action of the selected asset, showing whether it’s trending up or down, giving you immediate market sentiment at a glance. Whether you’re mon

# Weekly & Daily Stochastic Signal Indicator User Guide
## Overview This indicator combines the Stochastic oscillator on weekly and daily timeframes to generate strong trading signals. It aims to create more reliable signals by tracking momentum changes across different timeframes.
## Parameters - **ShortPeriod (14)**: Daily Stochastic period - **ShortPeriodSMA (3)**: Daily Stochastic SMA period - **LongPeriod (70)**: Weekly Stochastic period - **LongPeriodSMA (3)**: Weekly Stochastic SMA per

Данный сканер разработан на базе индикатора Билла Вильямса Awesome Osciliator (AO) и предназначен для более быстрого анализа финансовых инструментов. На графике отражается пять вертикальных столбцов, в который попадает финансовый инструмент, соответствующий определенным критериям. Первый столбец отображает финансовые инструменты с сильным трендом, а именно когда индикатор AO находится выше нулевой линии на трех тайм фреймах. Если же на рынке сильный тренд вниз, то в пятый столбец попадут именно
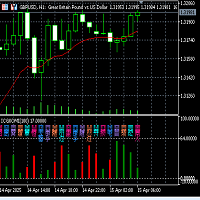
Fuxi Guaxiang Dual-color Oscillation Indicator Function and Usage Instructions (V2.1)
Fuxi Guaxiang Dual-color Oscillation Indicator Instructions: (1) This Guaxiang change indicator is based on the Yin-Yang transformation thought of the "Book of Changes" philosophy in ancient Chinese culture, integrating the results of the long-short game in each candlestick K-line period of the financial trading K-line chart, using China's oldest predictive coding method, in the form of the 64 Guaxiang of the
FREE

The "Session Time Vertical Lines" indicator displays vertical lines on the chart that mark the beginning and end of major global trading sessions: Sydney, Tokyo, London, and New York . It is designed to help traders visually identify active market hours, overlaps, and potential high-volume periods directly on the price chart. This tool is especially useful for intraday traders who rely on market session timing to plan entries and exits. Inputs / Settings Parameter Name Description DaysToDraw Num
FREE
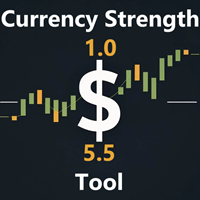
" Currency Strength Tool " — это простой и удобный индикатор, разработанный для анализа силы восьми основных валют на основе дневных изменений цен валютных пар. Он отображает информацию в компактном виде на графике в виде трёх строк, предоставляя трейдерам данные о текущей рыночной динамике. Индикатор служит инструментом для анализа, помогая принимать обоснованные торговые решения.
Выглядит следующим образом: -7.3% 0.5% 0.2% 6.4% 1.2% 3.2% 4.1% 0.4% (дневное) USD EUR GBP JP
FREE

The simplest indicator. It emits a standard sound signal (an audio file from the standard MetaTrader library - alert.wav) after a period of time you select. Unfortunately I was unable to add the ability to select your file due to language restrictions. There is a bug in the indicator that I don't know how to fix: when switching the time frame, the sound signal is emitted after about 10-15 seconds. P.S. But if you want a real indicator that can change your vision of trading - download my AZ Volzo
FREE
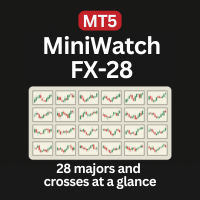
Monitor all 28 Forex pairs at once — clean mini charts, real-time price action, perfect for consistent price pattern traders. Designed for consistent, mechanical, and hybrid traders who repeatedly trade the same price action patterns — such as triangles, flags, trends, and supply/demand zones — across multiple symbols, without relying on indicators.
Core Features: Displays all 28 major Forex pairs in mini chart format , organized in a clean 4-row by 7-column layout. Powered by live price action
FREE
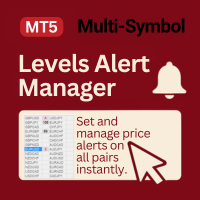
Levels Alert Manager (Beta) is a fast, user-friendly tool for placing and managing price alerts across multiple symbols — ideal for consistent, mechanical, and hybrid trading.
It provides a user-friendly, time-saving alternative to MetaTrader’s default alert system, which can be inefficient and clunky. The process is simple: click the + button, and drag the alert line to the desired level. All alerts are tracked in the panel, displaying live distance to price, with instant notifications trigg
FREE

Arrow Trend indicators Trading with the trend is often one of the most basic pieces of advice given by experienced traders. In addition, experienced traders will often advise traders to prioritize the long-term trend, as prices usually follow the direction of the long-term trend. Arrow trend indicators are tools that traders can use to determine the direction of a trend toward a long-term trend. What is an arrow trend indicator? An arrow trend indicator is a trend-following technical indicator
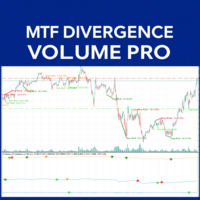
Divergence MTF Volume Pro: Your Ultimate Edge in the Market
Have you ever felt that the market takes you by surprise? Would you like a tool that anticipates possible turns and provides clearer signals for entering or exiting trades? Introducing Divergence MTF Volume Pro! Imagine seeing when price and volume (the force behind movements) start to contradict each other. This, known as divergence, is one of the most powerful signals indicating a potential trend reversal or strong continuation. Our

Dynamic Levels Marker is a smart MT5 indicator that automatically detects and plots three support and three resistance levels using a tiered historical analysis. Levels are visually distinct, labeled, and adapt as price evolves.
Key Features:
Dynamic multi-level support/resistance zones
Tiered logic based on recent price action
Customizable alerts (popup, sound, push notifications)
Clean visual lines with auto-positioned labels
Lightweight and easy to use on any timeframe
Whether you’re

Simple Candle Timer
Overview: The Simple Candle Timer is a simple, yet powerful, tool for traders who want to stay informed about the time remaining until the next candle appears on their chart. Whether you are trading on minute charts or higher timeframes, this indicator ensures you never miss a new candle formation.
Features: Real-Time Countdown Timer: Displays the time left until the current candle closes and a new one starts. The timer updates smoothly every 100 milliseconds for precision

Volume Flow Analyzer The Indicator helps you decode market activity by visualizing real-time volume strength. Whether you're a fast-paced scalper or a patient swing trader , this tool gives you a clearer view of when volume truly supports the price action.
Instructions: Indicator alerts when there is expected increase in volatility by analyzing volumes to allow a trader to prepare. It indicates "High Expected Volatility in such cases", It should be used along with your buy and sell parameters

GoldX PRO is a good trend indicator. The indicator's unique algorithm analyzes the asset price movement, taking into account technical and mathematical analysis factors, determines the most profitable entry points and issues a signal to open a BUY or SELL order. Bonus: When you purchase an indicator GoldX PRO you get the EA GoldX PRO for free.
Advantages of the indicator: The indicator produces signals with high accuracy. The confirmed indicator signal does not disappear and is not redrawn - a
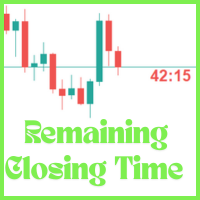
The Candle Remaining Closing Time indicator displays the amount of time left before the current candlestick closes on your chart. This tool is essential for traders who rely on precise timing to enter or exit trades, especially in fast-moving markets. By showing a real-time countdown, it helps you stay aware of upcoming candle completions across any timeframe—from 1-minute to daily charts. Whether you're a scalper watching minute-by-minute action or a swing trader timing key setups on higher tim

The Swing High Low and Fibonacci Retracement Indicator is a powerful technical analysis tool designed to identify key price levels and potential reversal zones in the market. It automatically detects recent swing highs and swing lows on the chart and overlays Fibonacci retracement levels based on these points. This indicator helps traders: Visualize market structure by highlighting recent swing points. Identify support and resistance zones using Fibonacci ratios (e.g., 38.2%, 50%, 61.8%). Adapt
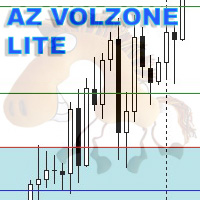
Information: I have developed two versions of the indicator: AZ_Azazavr and AZ_volzone_SYSTEM. The only difference between the AZ_Azazavr version and the AZ_volzone_SYSTEM version is the presence of automatic calculation in the AZ_volzone_SYSTEM version of the indicator and the presence of calculation of a slightly larger number of levels. Otherwise, you are purchasing not just an indicator, but a ready-made trading system.
Friends, many have been looking for a simple and effective system for

The Quasimodo Pattern Indicator is no more difficult than the Head and Shoulders. Still, only a few traders know about it, and some even confuse one with the other. However, this is not a reason to avoid this tool in your forex trading strategy. Features: Automatic Detection: The indicator automatically scans for valid QM patterns across any timeframe, reducing the need for manual chart analysis. Visual Highlights: Clear and customizable on-chart drawing of shoulders, heads, and breakout zones

MACD Scalper Zero Lag — это быстрый, точный и надежный индикатор, созданный для обеспечения трейдеров преимуществом сигналов в режиме реального времени. Исключая задержку, присущую традиционным MACD-индикаторам, он предоставляет мгновенные сигналы дивергенции на рынках форекс и криптовалют. Благодаря мощному алгоритму и удобному интерфейсу, этот инструмент не только обнаруживает ранние признаки разворота тренда, но и предоставляет четкие и понятные сигналы для принятия торговых решений. Вы может

VolumeView – Индикатор тиковых объёмов Описание: VolumeView — это визуальный индикатор, отображающий тиковые объёмы непосредственно на графике в виде горизонтальных линий разной длины. Цвет линии указывает направление свечи: Зелёный — объём на бычьей свече (цена закрытия выше открытия) Красный — объём на медвежьей свече (цена закрытия ниже открытия) Особенности: Отображает объёмы за определённое количество последних дней Поддерживает настройку минимального порога отображаемого объёма Рабо
FREE
Этот элегантный индикатор превращает ваш график в многослойную аналитическую панель, визуализируя ключевые уровни старшего таймфрейма прямо на текущем периоде. Идеальное решение для трейдеров, ценящих контекст и четкие структурные уровни. Ключевые особенности: Автоматическая синхронизация с выбранным старшим таймфреймом (M1-MN1) Двойные динамические линии открытия/закрытия каждого бара старшего ТФ Интеллектуальная цветовая схема: Ярко-зеленый для бычьих баров Алый красный для медв
FREE
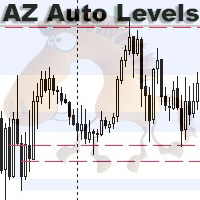
AZ Auto Levels builder ATR edition Indicator of automatic level drawing. For different instruments you need to play with the parameters to find the right ones. So, what is its idea - the indicator searches for levels of interest on the timeframe selected in the settings (by default H1). The search occurs only on candles that are 30% greater than the standard daily ATR of similar candles (you can change this in the settings). ATR is calculated for 20 days ago (also can be changed in the settings)
FREE
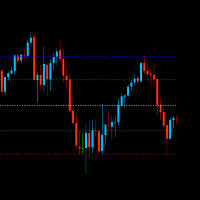
Top and bottom indicator, with the freedom to choose the initial bar and graphic time to be used for calculation regardless of the time frame of the current chart. It also plots mid-range and 23% retracement lines. Good indicator of market strength and current direction of price movement. Also with total freedom of configuration of line types and colors for each line of the indicator. It also has an indicator of the time to bar and open balance in the asset.
FREE

Este es un indicador hecho para indices Crash, en el broker Deriv, o indices Paint en el broker Weltrade. Su funcion es buscar velas de tendencia trend, y es recomendado verlo en temporalidad de 5 minutos o mas. Se que con las velas trend, corres el riesgo que un Spike te sorprenda, sin embargo la idea es ganar pocos pips para no arriesgar mucho. Recuerda que los Spike no respetan Stop Lost pero con una buena gestión de riesgo puede ser rentable. La idea es ganar pocos pips por entradas y este i
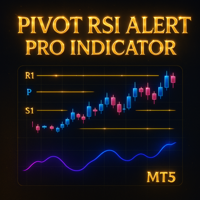
Detailed Description: The Pivot RSI Alert Pro Indicator is a powerful all-in-one indicator that combines five pivot point methods (Classic, Fibonacci, Woodie, Camarilla, DeMark) with a customizable RSI filter. It automatically plots daily pivot levels and midpoints, highlights key reversal zones and sends alerts when price approaches these levels, especially under RSI overbought/oversold conditions. Ideal for intraday and swing traders who rely on dynamic support/resistance and momentum confirm
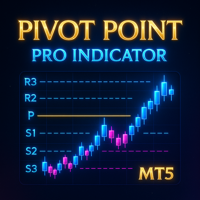
Detailed Description: The Pivot Point Pro Indicator is a powerful all-in-one fully customizable indicator that takes care of five pivot point methods (Classic, Fibonacci, Woodie, Camarilla, DeMark). It automatically plots pivot levels and midpoints, highlights key reversal zones and sends alerts when price approaches these levels. Unlike the free Pivot Point Classic version, this Pro indicator allows users to customize more settings, analyze current and historical pivot points and use al

Unlock the potential of automated trading on Gold (XAUUSD) and Euro/USD (EURUSD) with the Gold Euro Edge indicator . This indicator is expertly designed to capitalize on market movements in these key pairs, aiming for consistent performance by displaying buy or sell arrows on chart, audible alerts on laptop and notifications to phone. Experience efficiency and potentially enhance your trading strategy with this specialized solution.
Market Flow Analysis is a structure-based indicator that goes beyond traditional tools to help you spot real entry opportunities with ease. It highlights the Gold Zone — a gold-filled rectangle showing you the best possible area for entries , based on market structure, not lagging signals. Whether you're scalping or swing trading, this indicator gives you the true market trend , valid order blocks , and clear reaction zones , all in one smart visual layout. Why Market Flow Analysis? Go

مؤشر Smart Trend Candles هو أداة فعّالة في منصة MetaTrader 4، تجمع بين عناصر تحليل فني متعددة لتحديد اتجاهات السوق وقياس قوة المشترين والبائعين. يوفر هذا المؤشر متعدد الاستخدامات إشارات مرئية واضحة تُحسّن قرارات التداول الخاصة بك. الميزات الرئيسية 1. تحديد الاتجاه يستخدم شموع Heikin-Ashi المعدلة (اختياري) لتصفية ضوضاء السوق يتضمن متوسطًا متحركًا (فترة قابلة للتكوين) لتأكيد الاتجاه تنفيذ مؤشر القوة النسبية لقياس الزخم 2. قياس القوة تشير الشموع المرمزة بالألوان إلى شدة ضغط الشراء/البيع تحليل الحج

Индикатор Gann Squares представляет собой мощный инструмент для анализа рынка, основанный на математических концепциях, представленных W.D. Gann в его статье "Математическая формула для прогнозирования рынка." Этот индикатор включает в себя техники Ганна, связанные с квадратными числами, такими как 144, 90 и 52, а также Квадрат 9. Кроме того, он включает метод по использованию Квадрата 9 в сочетании с каналами и паттерном звезды. Руководство пользователя и использование: Перед использованием это

Представляем индикатор астрономии для MT4 / MT5 : Ваш незаменимый небесный товарищ в торговле Готовы ли вы поднять свой опыт торговли до небесных высот? Не ищите дальше, чем наш революционный индикатор астрономии для MT4. Этот инновационный инструмент выходит за рамки традиционных торговых индикаторов, используя сложные алгоритмы для предоставления вам беспрецедентных астрономических понимания и точных расчетов. Вселенская информация под рукой: Взгляните на обширную панель, раскрывающую сокр

Прежде всего, стоит подчеркнуть, что этот торговый индикатор не перерисовывается, не дорисовывает сигналы и не имеет задержек, что делает его идеальным как для ручной, так и для алгоритмической торговли. Руководство пользователя, пресеты и онлайн-поддержка включены. AI Trend Pro Max — это сложная, универсальная торговая система, созданная для трейдеров, стремящихся к точности, мощности и простоте. Основан на многолетней разработке предыдущих индикаторов, и это самая продвинутая версия на сегодня

IQ Gold Gann Levels a non-repainting, precision tool designed exclusively for XAUUSD/Gold intraday trading. It uses W.D. Gann’s square root method to plot real-time support and resistance levels, helping traders spot high-probability entries with confidence and clarity. William Delbert Gann (W.D. Gann) was an exceptional market analyst, whose trading technique was based on a complex blend of mathematics, geometry, astrology, and ancient mathematics which proved to be extremely accurate. Download

Multi Currency Multi Time Market Scan Signals It is an Advanced multi-utility dashboard which works with full customization of signal settings and graphical interface. It works with Multi Symbols and Multi-Time frames from 1 SINGLE CHART TEMPLATE. It will automatically open the charts where the latest signals had formed- showing the important levels (Entry, Targets, Stop Loss) Many types of sorting methods for the scanner. A robust ENTRY based on TREND OF MULTI-TIME FRAMES ( Complex Signals
MetaTrader Маркет предлагает каждому разработчику торговых программ простую и удобную площадку для их продажи.
Мы поможем вам с оформлением и подскажем, как подготовить описание продукта для Маркета. Все продаваемые через Маркет программы защищаются дополнительным шифрованием и могут запускаться только на компьютере покупателя. Незаконное копирование исключено.
Вы упускаете торговые возможности:
- Бесплатные приложения для трейдинга
- 8 000+ сигналов для копирования
- Экономические новости для анализа финансовых рынков
Регистрация
Вход
Если у вас нет учетной записи, зарегистрируйтесь
Для авторизации и пользования сайтом MQL5.com необходимо разрешить использование файлов Сookie.
Пожалуйста, включите в вашем браузере данную настройку, иначе вы не сможете авторизоваться.