Смотри обучающее видео по маркету на YouTube
Как купить торгового робота или индикатор
Запусти робота на
виртуальном хостинге
виртуальном хостинге
Протестируй индикатор/робота перед покупкой
Хочешь зарабатывать в Маркете?
Как подать продукт, чтобы его покупали
Новые технические индикаторы для MetaTrader 5 - 65
Currency Pair Splitter, calculates the value of an individual country and display it's fluctuations and trend over a given period. It has three lines which gives a mean price for a given period of time. This product is accurate in determining the actual direction of a country economic growth and strength as a result of economic events happening in a country. It shows an optimum price where a currency can deviate. Example For a pair EURUSD . this indicator Calculates the Value of the Numerator E

Если вам нравится этот проект, оставьте 5-звездочный обзор. Обьемная средняя цена - это соотношение стоимости, торгуемой до общего объема
торгуется над определенным горизонтом времени. Это мера средней цены по
какой запас торгуется над торговым горизонтом. VWAP часто используется как
торговый ориентир инвесторами, которые стремятся быть максимально пассивными в
их
исполнение. С помощью этого индикатора вы сможете нарисовать VWAP для: Текущий день. Текущая неделя. Текущий месяц. Текущий квартал.
FREE

Симметричный треугольный паттерн представляет собой период сокращения и консолидации, прежде чем цена вынуждена совершить прорыв вверх или пробой. Пробой нижней линии тренда указывает на начало нового медвежьего тренда, а прорыв верхней линии тренда указывает на начало нового бычьего тренда.
Версия MT4 доступна здесь: https://www.mql5.com/en/market/product/68709/
Этот индикатор идентифицирует эти паттерны и предупреждает вас, когда формируются 4 ключевые точки и цена снова возвращается в треу

This indicator plots the volume profile by Price on the chart
There are 5 ways to view it:
By Total Volume Traded; Volume Ticks(Forex) Separated by Buyers and Sellers; Buyers Only; Sellers Only and; Business balance (Buyers - Sellers).
It is possible to select how many days the profiles will be calculated.
On the current day it recalculates the histogram data for each new candlestick.
Another feature is to select the highest trading range by entering the desired percentage.
The indicat

This indicator shows the TLH and TLL and some trendlines that allow us to estimate the trend of market. It also shows the values of the angles of the lines in percentage in points (pip) , the standard deviation, and the trend of each line, and when it breaks the lines of support and resistance (TLH and TLL). And finally, it also shows the points identified as supports and resistances through the fractal algorithm in the graph. The high and low trend lines are supported by the highs and lows, th
FREE
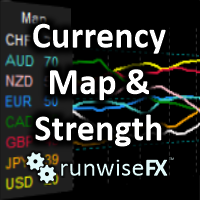
The first currency based indicator to draw a distinction between map and strength. The map shows the currencies in terms of oversold/overbought levels and gives the direction of travel. The currency strength calculates and shows the strength of that move. Alerts are included for changes in currency direction on the map (confirmed over two bars) and also when the strength reached the appropriate level. The currency map is useful for finding currency pairs to trade and in which direction. Look fo

For those who love to trade using the Heikin Ashi Candlesticks, here it is one more powerful ally: Heikin Ashi Volume . This indicator is an exclusive idea and creation from us at Minions Labs for you. The idea behind this indicator is to have a visual cue over the Heiken Ashi candles pointing at those candles with big volume. For this to happen you can choose between 2 different techniques of identifying the "high" volume: Higher Volume above the last N previous bars average. Higher Volume segm

order flow indicator that monitors price formation effectively identifying market direction. As it is an extremely fast indicator, it should be used in support and resistance, static and dynamic regions, the OrderFlowWay will predictively indicate the veracity of breakouts that have not happened yet, showing whether there is action by big players in the traded price. Operations must be carried out after crossing the lines, preferably close to the zero axis of the indicator.
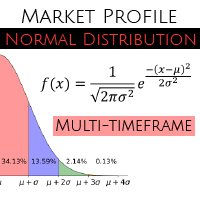
MT4 версия - https://www.mql5.com/ru/market/product/69932 В отличие от других индикаторов подобного типа, данная версия обладает: Возможностью отображения данных из более мелких таймфреймов на текущем графике. Например, отображение данных из M1 периода на графике H1. Возможностью расчета значений по формуле Гаусса (формула нормального распределения). Гибкой системой настроек. Настройки: basePeriod - базовый период. indicatorMode - режим отображения. Задает величину каждого интервала: by4h

Indicator that will show your Balance , and your Equity . Really simple to use, no specific requirements to install it. However you can deeply configure it for your own wishes. The pannel has 4 buttons. Only current will display the information of the chart you linked the indicator. If this is deselected, you will have the information of the whole account. Only Buys will display only the BUY orders and Only Sells will display only the SELL orders. Show Zero will display the 0

Indicator tested for 7 years with excellent results when used correctly An order flow tracking indicator when used at support and residence points simply shows the direction of the Big Players, validating good opportunities seek optimal risk-adjusted returns on their investments. Use when Flow line crossing at signal line after candle closed , works with absolutely everything

This indicator is based on the crossing of two Moving Average with the RSI It is intended for scalpers Specially designed for Boom and Crash syhtetic indices from Binary.com/Deriv.com It is easy to use and intuitive. We recommend its use on M1 and is equipped with three types of notification Email alert Sound notification Push notification these parameters can be activated and deactivated.
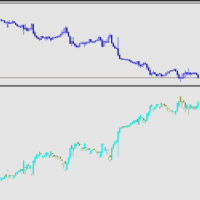
反转K线指标! 指标将主图的K线在副图中进行反转显示. 交易实用必备工具指标 波浪自动计算指标,通道趋势交易 完美的趋势-波浪自动计算通道计算 , MT4版本 完美的趋势-波浪自动计算通道计算 , MT5版本 本地跟单复制交易 Easy And Fast Copy , MT4版本 Easy And Fast Copy , MT5版本 本地跟单复制交易 模拟试用 Easy And Fast Copy , MT4 模拟账号运行 Easy And Fast Copy , MT5 模拟账号运行 The indicator of the attached figure shows that it is a mirror image of the candlestick chart of the main chart. The ordinate of the figure indicator is mirrored with the main image, and the coordinate value is a negative number.
For graphic reference on

Индикатор Matrix Arrow MT5 — это уникальный индикатор тренда 10 в 1, следующий за 100% неперерисовывающимся индикатором с несколькими таймфреймами, который можно использовать на всех символах/инструментах: форекс , товары , криптовалюты , индексы , акции . Индикатор Matrix Arrow MT5 будет определять текущую тенденцию на ранних этапах, собирая информацию и данные от до 10 стандартных индикаторов, а именно: Индекс среднего направленного движения (ADX) Индекс товарного канала (CCI)

Индикатор отображает на графике важные технические уровни. Эти уровни выступают поддержкой или сопротивлением для движения цены. Наиболее важные уровни кратные 100 и 50 пунктам. Также можно вывести уровни кратные 25 пунктам. При достижении ценой уровня выводится алерт или пуш-уведомление. Версия для МТ4 https://www.mql5.com/ru/market/product/69486 Настройки Show Levels 100 pips - показать уровни кратные 100 пунктам Show Levels 50 pips - показать уровни кратные 50 пунктам Show Levels 25 pips -
FREE

Автоматически строит «золотое соотношение Фибоначчи» между максимумом и минимумом предыдущего дня ... ... Максимумы и минимумы - отличные зоны поддержки и сопротивления.
Прорывы уровней Фибоначчи являются ключевыми точками входа и выхода из сделок.
Розовые линии показывают, что свеча предыдущего дня закрылась ниже. Линии синего цвета показывают, что свеча предыдущего дня закрылась выше.

For anyone studying forex charts, the aim is to identify trends, and spot reversals. If you have years of experience it may be easy, but most of us need something to make the trend apparent. If you're familiar with the popular renko charting method, you know that it was developed for this purpose. But renko charting has a flaw; the trend is often broken by false reversals. So I developed my own version - the Kenko Trend Indicator. The kenko trend indicator draws renko style trend following block

One of the most famous phrases in the trading world is "The Trend Is Your Friend".
Trading following the current trend is one of the most successful ways in terms of probability. The hard part of it is to recognize when the market is trending or not.
that's the role of our indicator we called The Trend Is Your Friend Until It Is Not. Apart from its big name it is really easy to use and see when the market is trending or ranging. Through a little window of 3 colors you will identify if the mark

Индикатор Alert Creator разработан для создания оповещений по выбранным условиям.
Для оповещения можно выбрать один индикатор или несколько.
Если выбрано несколько условий, то оповещение срабатывает, когда выполняются все выбранные условия.
Сигналы можно настраивать отдельно для покупки и отдельно для продажи.
Пример, оповещение на покупку: цена закрытия выше скользящей средней, RSI ниже 20.
(В данном примере, для формирования оповещения, используется 2 индикатора: MA и RSI)
В данный момент

Индикатор Dot reversal был создан на основе оригинальных индикаторов поиска экстремумов, индикатор хорошо подходит для определения разворота или большого резкого рывка в одну из сторон благодаря ему вы будете знать когда такое произойдет он вас уведомит появлением точки синего цвета на покупку красного на продажу.
Использует в своей основе процесс выявления скорости изменения роста цены и позволяет найти точки входа и выхода с рынка.
фундаментальный технический индикатор,который позволяет дат
Stable Signals - простой индикатор с простыми и надежными сигналами. Первое преимущество, которые получает трейдер, используя стрелочные Форекс индикаторы, это удобство. Не нужно искать пересечение скользящих средних или линий осциллятора, напрягая глаза и вглядываясь в график. Достаточно увидеть 1-2 стрелки – и это уже является сигналом. Очень хорошо то, что стрелка имеет окрас. Трейдер всегда ищет хорошие индикаторы. Очень удобно пользоваться стрелочными Форекс индикаторами, это наглядно и по

移動平均線クロス、ボリンジャーと移動平均線のクロス、移動平均線の角度でサイン表示
MT5インジケータ こちらに サイト があります。 このインジケータは3つのパターンでサインを表示(切り替え可能)します。 ① 移動平均線のクロス ② ボリンジャーバンドと短期移動平均線とのクロス ③ ボリンジャーバンドと短期移動平均線とのクロスと、中期移動平均線と長期移動平均線の角度 ⓸ ボリンジャーバンドと短期移動平均線とのクロス(サインを交互に表示) 移動平均線のクロス 指定した短期移動平均線と長期移動平均線のゴールデンクロスでは買いサイン、デットクロスでは売りサインを表示します。 ディフォルトでは短期は5,長期は20となっています。 もちろん変更可能になります。 移動平均線の種類をEMA(指数平滑移動平均線)やSMMA(平滑化移動平均)などに変更可能で適する価格も変更可能になります。 ボリンジャーバンドと短期移動平均線のクロス ボリンジャーバンド(以降BB)と短期移動平均線のクロスでサインを表示します。 ディフォルトではBB+1σと5MAのゴールデンクロスで買いサイン、BB-1σと5MAのデット
Индикатор паттернов 32 и 33 ("Размеренное движение вверх/вниз") из книги Томас Н. Булковский "Полная энциклопедия графических ценовых моделей". Параметры: Alerts - Включение алертов при появлении стрелки Push - Отправка Push-уведомления при появлении стрелки (требуется настройка в терминале) PeriodBars - Период индикатора MinMovment - Минимальная величина движения (в пунктах) BackMovment - Максимальная величина обратного движения (в долях единицы) ArrowType - Значок: от 1 до 17 ArrowVShift -

The name Aroon means “ Dawn's Early Light ” in Sanskrit. His creator Tushar Chande chose this name because the indicator is designed to catch the beginning of a new trend. At first sight it seems a little confusing all those jagged lines but after you understand the basics of it, you will find this indicator pretty cool and use it in a variety of ways, i.e.: Trigger, Trend Filtering System, and so on. The Aroon indicator was created in 1995 so it is a "modern" indicator compared to the Jurassic
FREE

Finding the right trend is always one of the most important points of trading
If you agree with me then let's move on
How do we recognize the trend?
As you well know, one of the best and most widely used standard indicators is the ATR. There is no special magic
We try to identify the trend by calculating the amount of ATR and the amount of Multiplier.
You can use this indicator in all currencies and all time frames. Of course, note that the purpose of this indicator is to show the trend, no

Sends alert when price moves from the previous alarm price by predefined points (or bps). Four alarm modes: push notifications, pop-up, e-mail and / or FTP. Highly customizable alert text and user-configurable indicator color / width / style.
Input parameters: Alert offset, in points : Alert is triggered when price moves from the previous alert by predefined points (if the last alert has not been registered, the current price is used as the last alert). The alert price is updated automatically

FULL TREND KILLER is an indicator based on Bollingen Bands and it is easy to use; no internal adjustments to be made. It is specially designed for synthetic indices but also works well on Forex Assets. The best time frame to use on synthetic indices is M15, this is just a tip, however it can be used on all time frames.
Settings : BANDS PERIOD Push Notification Email Notification Audible Alert

RSI Arrow1 is an arrow indicator based on the RSI, is easy to use; no internal adjustments to be made. the user can change the indicator period as desired in the settings. It can be used on all markets but it will all depend on your Trade strategy. There is no better Time Frame for its use; the use will depend on the Trader himself.
Settings:
RSI Period Push Notification Email Notification Audible Alert Down levels Up levels

HLBand is an indicator which can show trend, volatility channels, and it has 3 line levels: upper, middle and lower.
HLBand MT5 version is a perfect translation of HLBand MT4, it works absolutely identical to MT4 version.
Indicators Inputs
BandPeriod - the period used for calculating values of bands. PriceField - the price used for calculations, it can have two values: 0:High/Low, 1:Close/Close.

Если вам нравится этот проект, оставьте 5-звездочный обзор. Торговля большими объемами требует, чтобы мы рассмотрели несколько
инструментов/чартов для
найти новые возможности, этот показатель поможет вам при составлении конкретных
уровни множественным числом или его суффиксом и обновлять их автоматически
как изменение цены, задача, которая в противном случае будет утомительной. Например, на GBPUSD вы могли бы иметь 4 экземпляра индикатора на
диаграмма к сюжету: Каждый интервал 0,01 с длиной лин
FREE

Индикатор оценивает степень изменчивости цены и выделяет компоненты ведущие к росту и падению. Используя Variativity вы можете определять места смены движения, удачные моменты для торговли по тренду или против тренда. Сопровождать открытые сделки. Отображение
Индикатор отображает 3 линии: VARIATIVITY - тонкая серая линия. Суммарная изменчивость цены. Рост линии указывает на повышение рыночной активности. Снижение показывает возможность контр-трендовой торговли. Существенное падение до малых вел

Трендовый индикатор МТ5 с вероятностью достижения прибыли 70-90%! Работает без перерисовки и запаздываний. Индикатор показывает хорошие результаты на всех торговых инструментах: валюты, металлы, индексы, акции, криптовалюты. Рекомендуемый таймфрейм: H1-H4.
Подробная информация об индикаторе здесь: https://www.mql5.com/ru/blogs/post/744634
Рекомендации по использованию
Используйте автоматическое определение периода Главной особенностью индикатора является функция самооптимизации.
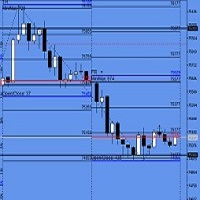
Open close levels. Open close levels - это индикатор для MetaTrader 5, отображающий на графике уровни High/Low, Open/Close , ATR (выставляется в ручную) дня, недели, месяца. Размечает круглые уровни (можно выставлять два вида круглых уровней одновременно), подписывает дни недели, пронумеровывает каждую неделю. ATH (All-time high) и ATL (All-time low). Уровни помечены ценовыми метками с обозначением цены. Также индикатор автоматически рассчитывает и выводит на график ра

Считает время жизни Candle Extra до ее закрытия.
Он используется для помощи при вводе операций ... ... Мы работаем при закрытии одноминутных свечей, то есть когда таймер установлен на 00: xx: 01. Мы открываем ордер, и значение этой операции также отображается инструментом.
Дополнительно: чтобы «разблокировать» шкалу цен. Дважды щелкните по шкале, и график будет «центрирован по горизонтали». Помимо возможности расширения и сжатия шкалы цен, мы можем перемещаться по графику, перетаскивая мышь

Нет! Это не «лента Боллинджера».
Определяет НЕПРЕРЫВНОСТЬ движения между максимумом, минимумом и закрытием. «Две полосы» одного цвета сигнализируют о НЕПРЕРЫВНОСТИ бычьего или медвежьего движения. С этим инструментом, отслеживая направление цен, это было легко даже для тех, кто является Café com Leite на рынке!
Помните, если: Все наши инструменты работают вместе, эксклюзивные индикаторы и робот для управления рисками.
Они автоматически определяют различные закономерности в динамике мини-инде

There is a very simple rule
It is Always difficult to cross high pressure areas and easy to cross low pressure areas
MT4 version is available here
This is definitely true for price
It was so simple, it was not!
So let's get started
This indicator shows you the amount of pressure in that area according to the bars that it shows. The longer the bar, the higher the pressure in that area It also marks the most pressed area with a rectangle
From now on you can simply decide on the price mov

Индикатор паттерн 35 и 36 ("Трубовидное дно", "Трубовидная вершина") из книги Томас Н. Булковский "Полная энциклопедия графических ценовых моделей". Параметры: Alerts - Включение алертов при появлении стрелки Push - Отправка Push-уведомления при появлении стрелки (требуется настройка в терминале) PeriodBars - Период индикатора (количество баров образующих вершину/дно) K1 - Дополнительный параметр влияющий на точность распознавания и форму паттерна K2 - Дополнительный параметр влияющий на т

Half Trend TPSL Buy Sell Indicator calculates the open and close of the price bars over the selected period of time and applies its own calculation method to find an average line of the price movement. ATR based Take Profit and Stop Loss ATR is a measure of volatility over a specified period of time. The most common length is 14, which is also a common length for oscillators, such as the relative strength index (RSI) and stochastics. A higher ATR indicates a more volatile market, while a lowe

Multi Time Frame Sub Panel for MT5. Monitor multiple time frames from a single chart window.
Here are some of the options available with the MTF Moving Average: Select the timeframes to be displayed (can manually type in other TF's) Customize the amount of timeframes to be displayed Define the width (number of bars) for each timeframe box Modify all the colors Display two moving averages
MTF, MA, Multi-TF, Multiple TF, Moving Average, SubPanel, Sub-panel,
A brand new indicator from the developer of MOST (Moving Stop Loss) indicator Anıl Özekşi.
Optimized Trend Tracker OTT is an indicator that provides traders to find an existing trend or in another words to see which side of the current trend we are on.
We are under the effect of the uptrend in cases where the prices are above OTT ,
under the influence of a downward trend, when prices are below OTT
it is possible to say that we are.
The first parameter in the OTT indicator set by the two par

Средний истинный диапазон (ATR) — это широко используемый индикатор, который измеряет величину движения цены в течение установленного периода времени. Однако значение, которое он дает, не определено в каких-либо границах, что делает его использование для чего-либо, кроме расчета стоп-лосса или тейк-профита, практически невозможным. Этот индикатор является вашим стандартным индикатором ATR, но мы ввели разграничение процентилей, чтобы вы могли видеть крайности. Вы можете выбирать между процентиля

Исчерпание диапазона происходит, когда цена достигает или превышает ожидаемый диапазон для текущего периода. На этих уровнях цена начинает терять свой импульс по сравнению с более ранним периодом, поэтому стоит убедиться, что вы не открываете новые позиции. Этот индикатор покажет вам, где это может произойти на вашем графике, показывая уровни для дневного, недельного и месячного периодов. Когда вы видите, что цена превышает эти уровни истощения, это говорит вам о том, что импульс, стоящий за дви

//////////////////////////////////////////////////////////////////////////////////// Этот индикатор отображает канал нелинейной полиномиальной регрессии. Он работает очень быстро, как молния. Особенно при использовании технологии ускорения OpenCL. Скоро будет доступна специальная версия данного индикатора, который еще и, используя ансамбли искусственных нейронных сетей, самообучается и прогнозирует цену на некоторое время вперед. Это адаптивные и сглаженные цветные линии. Доступны несколько
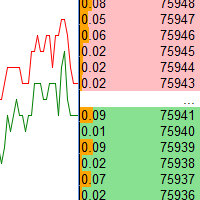
Отображение стакана цен. Возможно отображения до шестнадцати инструментов. Есть автопрокрутка цен, которую можно отключить нажатием на "А" в верхней части окна. Вполне красивый индикатор, может выступать в качестве заставки, будет не так скучно смотреться как обычный график, в самый раз для медитации, особенно после больших потерь на рынке. Индикатор не для торговли, так будет целее ваш депозит. На видео отображается ускоренное воспроизведение ранее сохранённых данных. Внимание, в тестере страте

Скользящая средняя Т3 Тиллсона была представлена миру технического анализа в статье «Лучшая скользящая средняя», опубликованной в американском журнале Technical Analysis of Stock Commodities. Разработанный Тимом Тиллсоном, аналитики и трейдеры фьючерсных рынков вскоре увлеклись этой техникой, которая сглаживает ценовой ряд, уменьшая при этом лаг (лаг), типичный для систем следования за трендом.
FREE

A very simple indicator, but one that cannot be missed when carrying out your operations.
Fast and accurate Spreed information before entering a trade as well as the time to start another candlestick.
Spread refers to the difference between the buy (purchase) and sell (offer) price of a stock, bond or currency transaction.
Come and see our mql5 signals too. https://www.mql5.com/pt/signals/899841?source=Site +Signals+From+Author
FREE

Moving Average Crossover Scanner and Dashboard For MT5 Advanced Moving Average Scanner Moving Averages Crossover Dashboard MT4 Version of the product can be downloaded: https://www.mql5.com/en/market/product/69260 The indicator scans the market and sends signals and alerts for Moving Average crossovers, death cross and golden cross.
Crossovers are one of the main moving average ( MA ) strategies.
MA Crossover ( cut ) strategy is to apply two moving averages to a chart: one longer and one sho
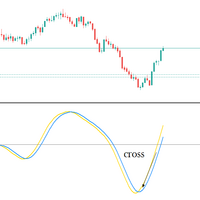
Big promotion on the Robos, Get yours now Robos Indicator The ROBOS indicator is a multi timeframe oscillator that targets the overbought and oversold regions of a price chart, a signal is indicated by the two lines crossing, compatible with all tradable instruments
Latest Release
The latest release is the version 4.0
#What's new in version 4.0 ?
Features
Extreme oversold and overbought levels
ROBOS version 4.0 comes with cool new feature , the ability to target only extrem

Volume Weighted Average Price (VWAP) is a trading benchmark commonly used by Big Players that gives the average price a Symbol has traded throughout the day. It is based on both Volume and price. This indicator contains Daily VWAP and MIDAS' VWAP, which means you are able to anchor the beggining of MIDAS' calculations and, therefore you will be able to use this methodology to study price versus volume moves after anchor point. You will be able to anchor up to 3 HIGH MIDAS VWAP's and 3 LOW.
Wish
FREE

Индикатор автоматически рассчитывает уровень и реальный объем Point of control, а так же отображает профиль рынка для массива свечей, в границах прямоугольника. Если ваша стратегия основана на взятии прибыли на отскоке от ценовых накоплений, индикатор Range profile станет главным инструментом в торговле скальпингом. Рассчет Point of control осуществляется на основе рассчета суммарного объема для каждого тика или по минутным свечам, в зависимости от настроек и таймфрейма торговли. При отсутств

A lot of professional traders use high quality divergence signals as a part of their strategy to enter a position. Spotting correct divergences quickly can often be hard, especially if your eye isn’t trained for it yet. For this reason we’ve created a series of easy to use professional oscillator divergence indicators that are very customisable so you get only the signals you want to trade. We have this divergence indicator for RSI, MACD, Stochastics, CCI and OBV. RSI: https://www.mql5.com/en/

A lot of professional traders use high quality divergence signals as a part of their strategy to enter a position. Spotting correct divergences quickly can often be hard, especially if your eye isn’t trained for it yet. For this reason we’ve created a series of easy to use professional oscillator divergence indicators that are very customisable so you get only the signals you want to trade. We have this divergence indicator for RSI, MACD, Stochastics, CCI and OBV. RSI: https://www.mql5.com/en/ma

A lot of professional traders use high quality divergence signals as a part of their strategy to enter a position. Spotting correct divergences quickly can often be hard, especially if your eye isn’t trained for it yet. For this reason we’ve created a series of easy to use professional oscillator divergence indicators that are very customisable so you get only the signals you want to trade. We have this divergence indicator for RSI, MACD, Stochastics, CCI and OBV. RSI: https://www.mql5.com/en/

A lot of professional traders use high quality divergence signals as a part of their strategy to enter a position. Spotting correct divergences quickly can often be hard, especially if your eye isn’t trained for it yet. For this reason we’ve created a series of easy to use professional oscillator divergence indicators that are very customisable so you get only the signals you want to trade. We have this divergence indicator for RSI, MACD, Stochastics, CCI and OBV. RSI: https://www.mql5.com/en/

A lot of professional traders use high quality divergence signals as a part of their strategy to enter a position. Spotting correct divergences quickly can often be hard, especially if your eye isn’t trained for it yet. For this reason we’ve created a series of easy to use professional oscillator divergence indicators that are very customisable so you get only the signals you want to trade. We have this divergence indicator for RSI, MACD, Stochastics, CCI and OBV. RSI: https://www.mql5.com/en/

Madx Cobra Madx Cobra Indicator. Create to traders both experienced and inexperienced to use it because it is a basic indicator
How to use : Setting Indicator 1. MA Fast : Moving Average fast (10) 2. MA Slow : Moving Average Slow control trend markets.(200) 3. ADX : Control trend(5) 4. For alert you can set to alert Next bar or instant bars.
When arrow sky blue show or arrow up, you can entry order "Buy" or "Long" and arrow red show or arrow down, you can entry order "Sell" or "Short"
S

Simple and fast MACD oscillator with MACD and signal lines and two-color histogram.
I wasn't happy with the Meta Trader MACD oscillator as it's not immediate to read and the other ones I tried felt a bit laggy or added unneeded features on top, so I decide to make one that feels familiar to me. I hope you will find it useful!
Contact me for any issues or bugs and I will try to help the best I can.

Это тиковый график в секундном формате. Есть поддержка OpenCL. Настройки очень простые - можно выбрать дни недели по которым будет вычислятся индикатор: например, для таких финансовых инструментов котировки по которым не обновляются на выходные дни надо выбрать любой другой день недели для 6 и 7 дня(понедельник - пятница), а вот, например, для биткоина, если брокер обновляет котировки можно указать для 6 дня - суббота, а для 7 дня - воскресенье. А так же Вам, при желании, можно настроить цвета

Простые индикаторы для MT5
Очень простой инструмент, облегчающий визуализацию индикаторов. Особенно полезно, если контрольный индикатор очень тонкий или его трудно прочитать.
В этом блоге вы можете прочитать о различных типах поддерживаемых индикаторов (индикаторы с цветовым буфером недоступны): Пересечение нулевой линии Две линии пересекаются Активация буфера Нулевая линия пересекается с фильтром Кроссы с ценой (MAs) Кресты внутри фильтра
FREE

////////////////////////////////////////////////////////////////////////////////////
Улучшенная версия стандартного индикатора Average True Range.
Теперь это удвоенная точность и цветная линия среднего значения.
Настройка совсем простая - вам надо указать основной период и период усреднения. Понять показания этого индикатора очень просто, смысл такой же как и у стандартного Average True Range.
/////////////////////////////////////////////////////////////////////////////////////
Надеюсь это

////////////////////////////////////////////////////////////////////////////////////
Этот индикатор отображает диапазон изменения цены за 1 минуту. Отлично пригодится для управления рисками. Это улучшенная версия стандартного индикатора Average True Range для Тикового Графика. Теперь это удвоенная точность и цветная линия среднего значения.
Настройка совсем простая - вам, при необходимости, только надо поменять цвета. Понять показания этого индикатора очень просто, смысл такой же как и у стан

Dark Sprint is an Indicator for intraday trading. This Indicator is based on Trend Following strategy, also adopting the use of the atr to determine the right volatility. We can enter in good price with this Indicator, in order to follow the strong impulse on the current instrument.
Key benefits
Easily visible sprint lines Intuitive directional arrows Automated adjustment for each timeframe and instrument Easy to use even for beginners Never repaints, never backpaints, Not Lag 100% compatibl
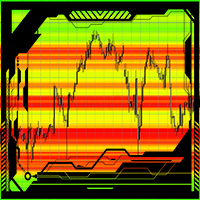
J.M.T.I
This indicator automatically shows a level or support and resistance in the currant market. Can be used on any time frame Can be used on any currency pair Works on the active bars in the window To add more bars one can simply zoom out. Red zones can be strong liquidity pools. Green zones usually is where an possible break out might occur. The higher the contrast of the colors the stronger the support or resistance levels will be. The indicator has an option to refresh on each tick (

Description This is an indicator for MT5 which has enhanced the "Fractals" indicator. "Fractals" indicator is included in MT5 by default but the draw line period is fixed at "5" and it cannot be modified. Thus I have reinvented the Fractals indicator with some useful function added. This tool will be useful especially for those who are learning how to draw good horizontal lines and wants to get some reference. Of course, those who are considering Fractals as an important horizontal line wil
FREE

Описание
Trend Influencer - индикатор который определяет потенциальную динамику влияния трендовых волновых движений на состояние рынка. В основе индикатора лежит значение скользящих средних, скорректированных стандартным среднеквадратическим отклонение. Индикатор отображен в виде основной штрих-пунктирной скользящей средней и сигнальной сплошной скользящей средней. Сигнальная скользящая средняя окрашивается в синий или красный цвет в зависимости от того, какой тип тренда сейчас наблюдается на ры

One of the best tools for analyzing volume, Weis Wave was devised by David Weis to facilitate reading the directional flow.
For the disciples of the Wyckoff method, this means an evolution, facilitating a predictive reading of the market, always looking for Accumulation and Distribution zones for traded assets.
For better understanding, in this indicator we try to cover every reading of EFFORT (traded volume) versus RESULT (price change). Thus, you can apply the indicator on the chart twice to

The SSD With Histogram is a custom forex indicator for Metatrader 5 that shows a slow stochastic line, a signal line, and a histogram that reflects the difference between the slow line and the signal line. The indicator and its elements are displayed in a separate window just below your main trading chart.
parameters: k period; 5 D period; 3 time frame: m1 m5 m15 m30 h1 d1
FREE

Binary MA Cross MA Cross indicator by 4Umbella
Create for traders both experienced and inexperienced to use it because it is a basic indicator
How to use : 1. MA Fast : Moving Average fast (Period 4 upto 50) 2. MA Middle : Moving Average Middle (Period 10 upto 100) 3. MA Slow : Moving Average Slow (Period 50 upto 200) to control trend markets.
and trader can be set for Apply to price (Close, Open,Low,High,Median,Typical,weightd)
For alert you can set to alert Next bar or instant bars.

Этот индикатор предназначен для более быстрого и легкого просмотра множества графиков в разных временных масштабах. Отслеживание времени и цены на нескольких графиках Измените символ на одном графике, и все остальные графики того же символа также будут изменены. Простота в использовании, быстрое освоение Индикатор позволяет определить цену и время, когда указатель мыши находится на текущем графике, на всех других графиках, открытых на том же символе. Это позволяет быстро просматривать информацию

Для определения меры центральной тенденции временного ряда можно использовать среднее арифметическое или медиану. И тому, и другому способу присущи некоторые недостатки. Среднее арифметическое рассчитывается индикатором простого скользящего среднего. Оно чувствительно к выбросам и шумам. Медиана ведет себя более устойчиво, но происходит потеря информации на границах интервала. Для того, чтобы уменьшить эти недостатки можно использовать псевдомедианную фильтрацию сигнала. Для этого возьмем медиа
MetaTrader Маркет - единственный магазин, где можно скачать демоверсию торгового робота и подвергнуть его проверке и даже оптимизации на исторических данных.
Прочитайте описание и отзывы других покупателей на заинтересовавший вас продукт, скачайте его прямо в терминал и узнайте, как протестировать торгового робота перед покупкой. Только у нас вы можете получить представление о программе, не заплатив за неё.
Вы упускаете торговые возможности:
- Бесплатные приложения для трейдинга
- 8 000+ сигналов для копирования
- Экономические новости для анализа финансовых рынков
Регистрация
Вход
Если у вас нет учетной записи, зарегистрируйтесь
Для авторизации и пользования сайтом MQL5.com необходимо разрешить использование файлов Сookie.
Пожалуйста, включите в вашем браузере данную настройку, иначе вы не сможете авторизоваться.