MetaTrader 4용 기술 지표 - 17
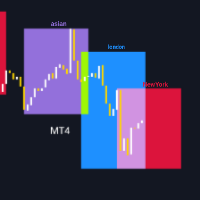
이 지표의 기능을 살펴보기 전에, 이 제품을 평가 하고, 경험을 공유하기 위해 댓글 을 남기고, 제 페이지를 구독 하여 최신 출시 및 도구에 대한 정보를 받아보세요. 여러분의 지원은 매우 중요하며 제 작품을 지속적으로 개선하는 데 도움이 됩니다! 설명: TradingSessionVisualizer 는 MetaTrader 4용 강력한 지표로, 차트에서 주요 거래 세션을 명확하고 사용자 정의 가능한 방식으로 시각화합니다. 이 도구를 사용하면 아시아, 런던 및 뉴욕의 거래 세션을 쉽게 구별할 수 있으며, 이러한 핵심 기간 동안의 시장 움직임을 더 잘 이해하는 데 도움이 됩니다. 주요 기능: 거래 세션 표시: 차트에서 아시아, 런던 및 뉴욕의 거래 세션을 색상이 지정된 직사각형으로 명확하게 시각화합니다. 사용자 정의 가능한 매개변수: 각 세션의 색상, 선 너비 및 직사각형의 채우기 여부를 조정할 수 있습니다. 동적 표시: 지표는 선택한 날짜 수에 따라 자동으로 조정됩니다 (최대 3일). 쉬
FREE

RSI Candle Signal Indicator will change bars’ color when set overbought or oversold levels reach.
How to Use RSI Candle Signal Uptrend/Downtrends - RSI may be used to detect trending markets. For example, the RSI may stay above the mid line 50 in an uptrend. Top and Buttoms - RSI may help in identifying the tops around the overbought readings (usually above 70), and the bottoms around the oversold area (usually below 30). Divergence - divergence occurs when RSI directional movement is not co
FREE
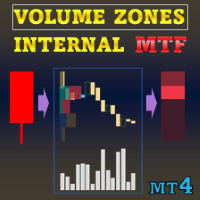
특별 할인 : ALL TOOLS , 각각 $35 에 제공합니다! New tools will be $30 for the first week or the first 3 purchases ! Trading Tools Channel on MQL5 : Join my MQL5 channel to update the latest news from me Volume Zones Internal Visualizer Multi-Timeframe 는 상위 차트에서 거래하면서도 하위 차트의 상세한 거래량 활동을 파악할 수 있도록 도와주는 최고의 솔루션입니다. 다중 시간대(Multi-Timeframe)를 지원하는 강력하고 직관적인 거래량 분석 도구를 찾고 계시다면, 바로 이 제품이 적합합니다! MT5 버전 더 보기: Volume Zones Internal Visualizer MT5 Multi TF 다른 제품 더 보기: All P roducts Why Choose Volume Z

The indicator defines the buy and sell arrows with high performance and consistent results. Suitable for trend trading or following the trend. Automatic analysis of market opportunities ; Help traders earn more from their investments;
Never repaints, recalculates or backpaints signals; This is FREE demo version of the indicator and works only on "GBP USD M15" . The demo version does not work on SUFFIX OR PREFIX brokers ! Trend Reversing PRO All other details about the indicator here
FREE
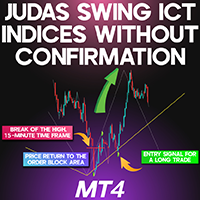
Judas Swing ICT Indices Without Confirmation MT4 The Judas Indices Indicator (Judas Indices ICT) for MetaTrader 4 is specifically designed to recognize deceptive price moves and liquidity manipulation occurring during the initial phase of the New York trading session. This tool identifies price traps set by institutional market participants between 09:30 and 09:45 EST , helping traders avoid false signals and poor trade executions. «Indicator Installation & User Guide»
MT4 Indicator Installatio
FREE

Pivots Dashboard is the single most complete instruments set for Pivot Points trading currently available in the market. We have done a comprehensive research prior to the product design to make sure that this product meets every need of Pivot Point trading. Pivots Points are significant levels technical analysts can use to determine directional movement and potential support/resistance levels. Pivot Points are thus predictive or leading indicators. While the points were originally used by floor

Contact me after payment to send you the User-Manual PDF File. Volume Profile Indicator A functional and useful tool that can improve your trading plan.
This indicator calculates volume in price levels(typical volume indicator shows only candle volumes).
With the volume of price levels, you can identify important areas that have the potential to reverse. You can also see the volume of support and resistance levels and decide on them.
Using volume profiles along with Price Action and
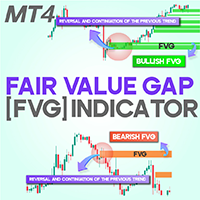
Fair Value Gap or FVG indicator MT4
Traders utilize a variety of tools and methodologies to uncover profitable market opportunities. One such efficient and valuable tool is the Fair Value Gap (FVG) indicator in MetaTrader 4. A Fair Value Gap (FVG) represents a pricing discrepancy where the market has not yet reached an equilibrium between supply and demand. These gaps materialize during significant price swings. In simpler terms, when three consecutive candlesticks form, the space between the f
FREE

The indicator gives buy or sell signals based on the Parabolic SAR indicator, and it also contains strategies with Moving Average. There are alerts and alerts to the mobile terminal and to the mail. Arrows are drawn on the chart after the signal is confirmed. They don't redraw. I recommend watching my advisor - Night Zen EA
To keep up to date with my latest products and ideas, join my telegram channel and subscribe to my profile. The link in my profile contacts - My profile The indicator in
FREE

Overview Inspired by Tradingview’s falconCoin, The Market Cipher indicator is a momentum oscillator used to detect overbought/oversold conditions and potential trend reversals. Traders can also use it to spot divergences between price action and momentum for early entry or exit signals. Configuration Guide Core Indicator Settings The indicator calculates momentum using a short-term and a longer-term average. Momentum is plotted as a wave oscillating between overbought and oversold thresholds. Ov
FREE

The Hi Lo Breakout is taken from the concept of the ZZ Scalper EA which exploits the inevitable behaviour of price fluctuations and breakouts. The fact that because market prices will always fluctuate to higher highs before ebbing down to lower lows, breakouts will occur.
But here I've added a few more filters which I see work well also as an Indicator.
Range Analysis : When price is within a tight range this Indicator will be able to spot this and only then look for price breaks. You
FREE

A Simple Visual Indication of the Trading Sessions Times. This Indicator will help you Visualize the Trading sessions and take advantage of the session precise timing to trade at the open of each session where there might be more liquidity. This Indicator is FREE, So pls Dont forget to leave a 5 * stars Review, This Will help me create new Ideas and Indicators and Upload them to the Market. More Professional and useful Indicators and tools here: https://www.mql5.com/en/users/dubaiforexgroup/sel
FREE
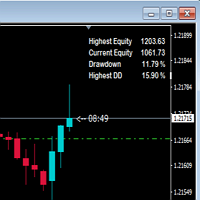
This indicator shows drawdown based on highest equity. Usually drawdown is used to show performance of a trading account especially when someone participate in a trading contest. If drawdown exceed a determined number, the contest account will be disqualified. So, I hope, this indicator will warn us in maintaining the drawdown and the account still be saved.
FREE
Highly configurable Macd indicator.
Features: Highly customizable alert functions (at levels, crosses, direction changes via email, push, sound, popup) Multi timeframe ability Color customization (at levels, crosses, direction changes) Linear interpolation and histogram mode options Works on strategy tester in multi timeframe mode (at weekend without ticks also) Adjustable Levels Parameters:
Macd Timeframe: You can set the lower/higher timeframes for Macd. Macd Bar Shift: you can set the o
FREE
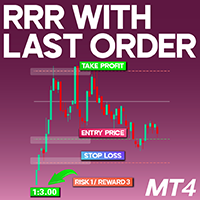
Risk-Reward Ratio with Last Order Indicator for Meta Trader 4 The Risk-Reward Ratio with Last Order (RRO) Indicator is a valuable tool designed for traders who need a precise calculation of their risk-to-reward ratio within the Meta Trader 4 (MT4) environment. This indicator evaluates the distance between the stop loss and the entry price and compares it to the take profit level. It then automatically calculates and displays the risk-to-reward ratio in the upper left corner of the trading chart.
FREE

The indicator provides volume delta analysis and visualization. It calculates tick volumes for buys and sells separately, and their delta on every bar, and displays volumes by price clusters (cells) for a specified number of recent bars. This is a special, more descriptive version of the indicator VolumeDelta . This is a limited substitution of market delta (market depth) analysis, which is normally based on real volumes, but they are not available on Forex. The indicator displays the following

Special offer! https://www.mql5.com/ru/users/bossik2810
Accurate entry points for trades for currencies, crypto, metals, stocks, indices! The indicator 100% does not repaint!!! How to use the indicator! If a signal appears, it no longer disappears! Unlike indicators with redrawing, which lead to loss of deposit, because they can show a signal and then remove it. Trading with this indicator is very easy. We wait for the signal from the indicator and enter the transaction according to the arr

Binary Options Trading Indicator: A Reliable Tool for Your Trades This indicator is specifically designed for binary options trading and has proven its high quality, reliability, and adequate accuracy, depending on the dynamics of the chart. Key Points: Signal Interpretation: When a blue cross signal appears, it indicates a potential entry into a trade, though it is considered a weak signal on its own. However, if the blue cross is accompanied by an arrow, it is considered a more reliable buy s
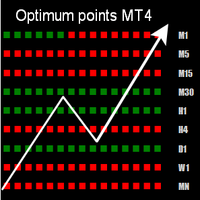
인디케이터는 여러 차트주기의 추세 방향을 하나의 창에 표시합니다. 여러 주기의 추세가 일치하는 경우 화살표가 그려집니다. 현재 주기의 추세를 나타내는 히스토그램으로 전환할 수도 있습니다. 이 인디케이터는 차트에 진입 지점과 대략적인 종료 지점을 그립니다.
경고: 이 인디케이터는 다중 차트주기이므로 전략 테스터에서 사용할 때는 필요한 모든 차트주기에 대한 시세를 미리 다운로드해야 합니다. 테스터에서 호가 다운로드를 오래 기다리지 않으려면 시작일 2025.01.01과 모델 “오픈 가격 전용” 또는 “제어점”을 입력할 수 있습니다.
MT5용 인디케이터 버전
특징 이 인디케이터는 다시 그려지지 않습니다. 과거 차트에 표시되는 내용은 실시간으로 표시됩니다. 암호화폐, 주식, 금속, 지수, 원자재, 통화 등 모든 자산을 거래하는 데 사용할 수 있습니다. 모든 차트주기에 사용할 수 있습니다. 진입 신호는 새 캔들이 시작될 때 표시되며 다시 그려지지 않습니다.

Use of support and resistance in systematic trading is very subjective. Every trader has their own idea and way to plotting the support and resistance levels on the chart. KT Support and Resistance indicator take out this ambiguity out of the situation and automatically draws support and resistance levels following an algorithmic approach using a unique multi-timeframe analysis.
When launched on the chart, It immediately scan the most significant extreme points across all the available timefra

This indicator can send alerts when a Heiken Ashi Smoothed color change occurs. Combined with your own rules and techniques, this indicator will allow you to create (or enhance) your own powerful system. Features Can send all types of alerts. Option to delay the alert one bar in order to confirm the color (trend) change. Input parameters Wait for candle close: 'true' or 'false'. Setting it to 'true' will delay the alert to the opening of the bar following the bar where the color change occurred.
FREE

"Auto FIBO Pro" Crypto_Forex 지표 - 거래에 유용한 보조 도구입니다!
- 지표는 자동으로 Fibo 수준과 로컬 추세선(빨간색)을 계산하여 차트에 배치합니다. - Fibonacci 수준은 가격이 반전될 수 있는 주요 영역을 나타냅니다. - 가장 중요한 수준은 23.6%, 38.2%, 50%, 61.8%입니다. - 역전 스캘핑이나 존 그리드 거래에 사용할 수 있습니다. - Auto FIBO Pro 지표를 사용하여 현재 시스템을 개선할 수 있는 기회도 많습니다. - Info Spread Swap Display가 있습니다. 현재 Spread와 Swap이 부착된 외환 쌍을 표시합니다. - 디스플레이에는 계정 잔액, 자본 및 마진도 표시됩니다. - 차트의 어느 모서리에서나 Info Spread Swap Display를 찾을 수 있습니다. 0 - 왼쪽 상단 모서리, 1 - 오른쪽 상단, 2 - 왼쪽 하단, 3 - 오른쪽 하단.
// 훌륭한 트레이딩 로봇과 지표는 여기

This indicator calculates gann support and resistance prices with use gann pyramid formulation and draw them on the chart. And If you want, Indicator can alert you when the current price arrive these pivot levels. Alert Options: Send Mobil Message, Send E-mail, Show Message and Sound Alert Levels: S1, S2, S3, S4, S5, R1, R2, R3, R4, R5 Inputs: GannInputPrice: Input price for gann pyramid formulation. GannInputDigit: How many digit do you want to use for calculation formula. (The number and the
FREE

The swing continuation pattern happens in a trend direction after a short reversal / pull back . As the name suggests , these patterns occurs along the swing high and swing lows of a trend , this makes the patterns very low risk patterns with potential high rewards . The swing continuation indicator also combines Currency Meter as a filter for its execution. The idea is to go with both the price trend flow and currency trend flow. Which means the price action must be supported by the currency st
Think of an Experienced Traders’ Brain as a blueprint for a trading algorithm. Then the desire to keep charts as clutter free as possible. What you see below is a blueprint of Paul Bratby’s thought process but even he admits, he is getting too old to focus on all of these! • 9 Decision Points before Paul considers grading the trade a 3* trade
• Then another special Decision Point will make it a 4* trade
• Another for 5* trade
• And Finally, a total of 12 Decision Points being correct before he
The indicator allows you to instantly determine the current trend by color and FIBO levels. Higher Timeframe the panel shows the current trend of higher periods, helping to determine the strength of the trend Trade according to the trend when changing the color of candles or trade against the trend when the price hit the extreme levels of the FIBO Trend PRO indicator Advantages of the FIBO Trend PRO
Indicator never repaint and does not change their values Very easy to use and intuitive
FREE

Currency Strength Matrix (CSM) is an indicator that will show you the current strength of the major currencies in several timeframes, allowing you to sort the currencies for strength and spot possible trading setups. This indicator is ideal for scalping and in all those events of sudden big moves.
How does it work? The CSM compares the value of the current moving average with the same moving average in the previous candle for all the 28 pairs and all 9 timeframes, producing a Matrix of Strength
FREE
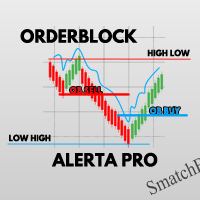
OrderBlock PRO ALERT
OrderBlock ALERTA PRO is the definitive tool for identifying the best entry points into the financial market. With it, you will find the ideal balance points for orders, detecting when liquidity will start to increase when breaking the bullish or bearish structure. Receive PUSH notifications directly on your Meta Trader, keeping you always informed.
Furthermore, OrderBlock ALERTA PRO identifies the HIGH LOW (HL) and LOW HIGH (LH) zones, providing you with the exact price
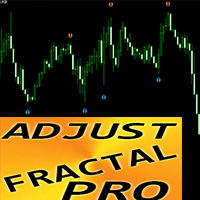
"Adjustable Fractals Pro"는 프랙탈 지표의 고급 버전으로, 매우 유용한 거래 도구입니다!
- 알다시피 표준 프랙탈 mt4 지표에는 설정이 전혀 없습니다. 이는 거래자에게 매우 불편합니다. - Adjustable Fractals Pro는 이 문제를 해결했습니다. 필요한 모든 설정이 있습니다. - 지표의 조정 가능한 기간(권장 값 - 7 이상). - 가격의 고점/저점으로부터의 조정 가능한 거리. - 프랙탈 화살표의 조정 가능한 디자인. - Info Spread Swap Display가 있습니다. 현재 스프레드와 외환 페어의 스왑을 첨부된 위치에 표시합니다. - 디스플레이에는 계정 잔액, 자본 및 마진도 표시됩니다. - 차트의 어느 모서리에서나 Info Spread Swap Display를 찾을 수 있습니다. 0 - 왼쪽 상단 모서리, 1 - 오른쪽 상단, 2 - 왼쪽 하단, 3 - 오른쪽 하단. - 표시기에는 모바일 및 PC 알림 기능이 내장되어 있습니다. //
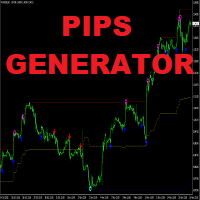
Apollo Pips Generator 는 추세의 방향으로 신호를 제공하는 지표입니다. 표시기는 여러 진입점을 제공하므로 항상 이익을 얻을 수 있는 거래 기회를 찾을 수 있습니다. 스크린샷에 주의하세요. 스크린샷은 상단과 하단을 나타내는 별 신호가 있는 채널로 표시되는 다른 도구와 함께 Pips Generator 도구를 보여줍니다. 이 조합은 시스템을 적용할 수 있는 여러 방법을 제공합니다. 구매 후 두 번째 표시기를 무료로 받으려면 저에게 연락하십시오. 스크린샷에 나와 있는 것과 완전히 동일한 시스템을 갖게 될 것입니다. 또한 최상의 결과를 얻기 위해 이 시스템을 사용하는 방법에 대한 지침도 제공합니다. 두 도구 모두 PUSH 알림을 포함한 모든 유형의 경고를 제공합니다. 나는 당신에게 행복한 거래를 기원합니다!

Advanced Stochastic Scalper - is a professional indicator based on the popular Stochastic Oscillator. Advanced Stochastic Scalper is an oscillator with dynamic overbought and oversold levels, while in the standard Stochastic Oscillator, these levels are static and do not change. This allows Advanced Stochastic Scalper to adapt to the ever-changing market. When a buy or a sell signal appears, an arrow is drawn on the chart and an alert is triggered allowing you to open a position in a timely mann

WaPreviousCandleLevels MT4 shows the previous candle levels, it shows the previous candle Open High Low Close levels (OHLC Levels) in different time frame. It's designed to help the trader to analyse the market and pay attention to the previous candle levels in different time frame. We all know that the OHLC Levels in Monthly, Weekly and Daily are really strong and must of the time, the price strongly reacts at those levels. In the technical analysis, the user can use them as a support and res
FREE

This indicator scans for you up to 30 trading instruments and up to 8 timeframes for occurrences of the high probability reversal patterns: Double Tops/Bottoms with fake breakouts . Please read also the blog post " Professional Trading With Double Tops/Bottoms And Divergences! " which explains the concepts behind the ULTIMATE Double Top/Bottom indicator and how you can use a professional top-down approach. This FREE Version of the Scanner scans only EURUSD and GBPUSD. The full version of the sca
FREE

Based on famous and useful indicator - Super Trend, we add some features to make this Indicator much easier to use and powerful. Ease to identify the trend of any chart. Suitable for both Scalping & Swing Better to use in the trending market be careful in sideway market, it might provide some fake signals Setting: ATR Multiplier ATR Period ATR Max Bars (Max 10.000) Show UP/DOWN node Nodes size Show Pull-back signals Pull-back filter ratio Period of MA1 Mode of MA1 Period of MA2 Mode of MA2 A
FREE

Relative Volume or RVOL is an indicator that averages the volume of X amount of days, making it easy to compare sessions volumes.
The histogram only has 3 colors:
Green - Above average volume
Yellow - Average volume
Red - Below average volume
The default setting is 20 days, which corresponds more or less to a month of trading.
With the data obtained from this indicator you can better gauge the commitment behind a move. For example, you will be better equipped to judge if a breakout of a r
FREE

The Keltner Channel is a volatility-based technical indicator composed of three separate lines. The middle line is an exponential moving average (EMA) of the price. Additional lines are placed above and below the EMA. The upper band is typically set two times the Average True Range (ATR) above the EMA, and the lower band is typically set two times the ATR below the EMA. The bands expand and contract as volatility (measured by ATR) expands and contracts. Since most price action will be encompasse
FREE

Description:
This indicator (with its algorithm) marks relative highs and lows, which have an array of useful applications.
This indicator will never repaint.
Features:
Marks relative highs and lows Use this to determine points of trend continuation i.e. where the trend may pull back before continuing higher or lower, past this point Or use this to determine potential points of reversal, particularly in ranging markets, or with other price action These highs and lows can sometimes be us
FREE

Swing High Low Pattern Recognition is a great indicator able to fix price levels and analyze the market swings. Swing High Low uses a dynamic approach of analysis that allows you to identify easily the best entry levels. The indicator using the minimum and maximum periods of the previous candles to analyze the impulsive movement and finally it sets the entry levels. The entry levels are: fast, good and best . The best is the last confirm of the swing. For a correct use we advise to wait the comp
SignalAlert 지표는 다른 지표에서 구매 및 판매 신호를 추적하고 신호가 발생하면 사운드 알림을 보내는 도구입니다. SignalAlert는 Binary Sixty Scalping과 같은 지표와 함께 사용할 때 빠르게 신호에 반응하는 데 유용합니다. 지표 설정: IndicatorName – SignalAlert가 신호를 읽을 지표의 이름을 지정합니다. 예를 들어, „Binary Sixty Scalping“을 정확히 입력하면 SignalAlert가 이 지표의 신호를 추적합니다. BuyBuffer – 구매 신호의 버퍼 번호를 지정합니다. 예를 들어, „Binary Sixty Scalping“의 구매 신호가 첫 번째 버퍼에 있으면 BuyBuffer = 0을 설정합니다. 다른 버퍼에 있으면 해당 번호를 지정합니다. SellBuffer – 판매 신호의 버퍼 번호를 지정합니다. 예를 들어, „Binary Sixty Scalping“의 판매 신호가 두 번째 버퍼에 있으면 SellBuffer
FREE

Current indicator shows the trading sessions for the major financial centres: London New York Tokyo Sydney There are available two types of displaying zones: in sub window below the chart and on the chart. When the subwindow is selected, the sessions are shown in the form of bars. If the sessions are shown on the main chart, they are displayed in the form of lines at the open price of the session that may also act as a support and resistance for further price action during the trading day. The
FREE
BinaryPin is an indicator developed and adapted specifically for trading short-term binary options. The indicator's algorithm, before issuing the signal, analyzes many factors, such as market volatility, searches for the PinBar pattern, calculates the probability of success when making a deal. The indicator is set in the usual way. The indicator itself consists of an information window where the name of the trading instrument is displayed, the probability of making a successful transaction, the
FREE

FTU idioteg i jipyoneun MT4 peullaespom-yong-imyeo dandog-eulo sayonghal su issjiman daleun jipyo ttoneun jeonlyaggwa gyeolhabhaneun geos-i gajang johseubnida. macd, adx deung dayanghan jipyoleul gyeolhabhayeo jin-ib ttoneun chuse byeonhwa jean-eul wihan hwasalpyo geuligi YouTubeeseo jjalb-eun sogae bidioleul sicheonghaseyo: https://youtu.be/lCRJ3mFNyOQ pyosigi gineung: panmae mich gumae hwasalpyo sigag mich cheong-gag gyeong-go chuse jisog / chogi chuse byeonhwa sinho saeloun gineung: gilog ma
FREE
This non-repainting indicator, inspired by Larry Williams’ renowned "VIX Fix", replicates the power of the VIX (Volatility Index) but works across all asset classes—making it a versatile tool for traders. Originally designed for stock indices, this version adapts to any market, including forex, commodities, and crypto, providing valuable insights into potential market bottoms.
For more details, check out this pdf: https://www.ireallytrade.com/newsletters/VIXFix.pdf
Key Features: Based on the w
FREE
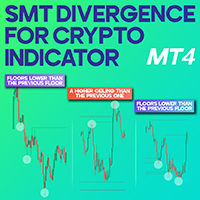
Smart Money Technique Divergence for Crypto Indicator MT4
The Smart Money Technique (SMT) Divergence Indicator for MetaTrader 4 is crafted based on divergence analysis and Smart Money principles. It identifies divergence patterns when three or more correlated financial instruments, including currency pairs, indices, or digital assets, exhibit varying price behaviors. Such discrepancies often indicate shifts in institutional money flow, hinting at potential trend reversals or diminishing momentu
FREE
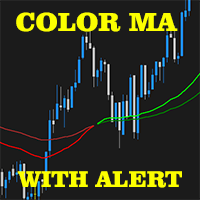
2 EMA Color Alerts Indicator is a powerful tool for any trader looking to stay on top of market movements. By using exponential moving averages (EMAs), this indicator can provide early warning signals for potential market reversals and trend changes. One of the key features of the 2 EMA Color Alerts Indicator is its customizable alerts. With this feature, traders can set their own parameters for receiving alerts, such as the EMA periods and the type of alert (e.g. sound, pop-up, email). This al
FREE

그것의 비밀이 없는 서로 다른 브로커 및 다른 유형의 계정할 수 있는 다른 확산 가치(간의 차이를 입찰 가격). 이러한 조건에서 동일한 전문가 고문은 완전히 다른 결과로 거래 할 것입니다. 기호의 확산이 클수록 얻는 이익이 적고 브로커가 귀하에게서 얻는 이익이 더 많습니다. 따라서 측정,확산이 매우 중요한 선택을 위한 브로커 계정식,특히 스캘핑,자정 및 장중 전략이 있습니다.
무한대에서 간단하지만 신뢰할 수있는 지표는 어떤 브로커에서 어떤 기호의 확산을 추적하는 데 도움이됩니다!
모든 차트에 스 캐터 미터 표시기를 설치하기 만하면됩니다(M1-H1 권장). 스프레드 미터는 최대 최소 및 평균 스프레드 변경 사항을 추적하고 기억합니다.
차트 하단의 산포계 표시기의 히스토그램은 실시간으로 기록을 축적합니다. 따라서 표시기를 지속적으로 사용하는 것이 중요합니다. Vps 또는 영구적 인 인터넷 연결이있는 컴퓨터를 사용하는 것이 좋습니다.
산란계 표시기의 매개 변수:
Low
FREE
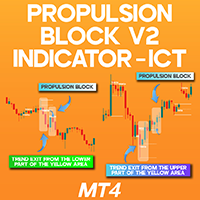
Propulsion Block V2 Indicator ICT MT4 The Propulsion Block V2 is an advanced yet lesser-known concept within the ICT trading framework, widely utilized by experienced traders to pinpoint high-probability trade entries and exits. These zones typically emerge where institutional investors or large market participants initiate or expand their positions.
This MetaTrader 4 indicator, in its second version, automatically detects Propulsion Blocks (Propulsion Block V2) —which are otherwise challenging
FREE
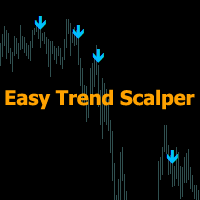
" Easy Trend Scalper " 지표는 추세 방향 내에서 스캘핑 거래를 위해 설계되었습니다.
표시기의 작동 원리.
이 지표는 시장이 어느 방향으로 움직이는지를 판단합니다.
빨간색 큰 화살표는 강세 방향을 나타냅니다.
파란색 큰 화살표 - 하락 방향을 나타냅니다.
강세 또는 약세 추세 내에서는 작은 화살표 형태로 스캘핑 신호를 생성하는 알고리즘이 있습니다.
주황색 화살표는 구매를 위한 신호입니다.
파란색 - 판매를 위한 신호입니다.
모든 거래 수단 및 모든 기간에서 사용할 수 있습니다. 추세 방향 변화와 진입 신호가 나타날 때 여러 유형의 알림을 제공합니다. 다시 그리지 않고도 작동하며 2~5개 캔들의 가격 방향을 예측할 수 있습니다. 화살표 형성 모드는 현재 캔들 또는 캔들 마감 시 수동으로 변경할 수 있습니다. 두 가지 경우에는 다음 캔들이 시작되어도 이전 캔들의 화살표는 다시 그려지지 않습니다.
원하는 도구에 맞게 구성해야 하는 매개변수도 수동으로 변경할 수 있습

The indicator is the advanced form of the MetaTrader 4 standard Fibonacci tool. It is unique and very reasonable for serious Fibonacci traders. Key Features Drawing of Fibonacci retracement and expansion levels in a few seconds by using hotkeys. Auto adjusting of retracement levels once the market makes new highs/lows. Ability to edit/remove any retracement & expansion levels on chart. Auto snap to exact high and low of bars while plotting on chart. Getting very clear charts even though many ret
Pipfinite creates unique, high quality and affordable trading tools. Our tools may or may not work for you, so we strongly suggest to try the Demo Version for MT4 first. Please test the indicator prior to purchasing to determine if it works for you. We want your good reviews, so hurry up and test it for free...we hope you will find it useful.
Combo Swing Control with Energy Beam Strategy: Confirm swing pullback signals Watch Video: (Click Here)
Features Detects overall bias and waits for overb

Volume Delta is a very powerful indicator that reads the supply on the Market. It calculates the Delta from movement of the price and the difference of BUY and SELL Tick volumes. Its special structure allows you to get all timeframe values available on the MT4 platform. A good observation of this instrument can suggest great entry points and possible reversal. We are confident that this tool will help you to improve your trading timing. See also for MT5: https://www.mql5.com/en/market/product/5

지표는 전날을 기준으로 계산된 클래식 피벗 수준을 차트에 표시합니다. 수식을 계산할 시간을 선택할 수 있습니다. 반전을 위해 플랫에서 거래하십시오. 트렌드 시장에서 이들을 타깃으로 삼으세요. 성공적인 거래를 위한 전략과 결합하십시오. 레벨은 버퍼를 사용하여 작성되고 사용 가능한 전체 견적 내역에 표시됩니다.
입력 매개변수.
Start Hour - 몇 시부터 하루의 시작을 계산합니다. 00 - 기본값. Show Mid Pivots - 중간 수준 표시.
Visual Button - 버튼 표시(활성화/비활성화). Corner - 버튼 앵커 각도. X indent - 픽셀의 수평 패딩. Y indent - 픽셀의 수직 패딩.
Label Visual - 디스플레이 레벨 레이블. Label Font Size - 글꼴 크기. Label Shift Bars - 비문의 들여쓰기(촛불의 수). Label Tooltip - 레벨 위의 커서 아래에 텍스트 표시.
Levels Styl
FREE

Description: For a comprehensive understanding of our indicators, we invite you to explore the entire Q&A section within this MQL5 blog post here . The Moving Average 5EMA Indicator is a valuable tool designed to provide comprehensive insights into market trends and potential entry and exit points. It incorporates five exponential moving average (EMA) lines, each representing the average price over different periods. This powerful combination offers a deeper understanding of price movements a
FREE
The Pioneer Of Trend Detection! A Powerful Indicator That Avoids Whipsaws And Uncertain Market Noise. Functions mainly as a filter to help you trade in the direction of the trend. It works in any pair or timeframe.
Features Advanced trend detection software using complex algorithms that can be used as the supporting tool or system. Unique trend detection that avoids whipsaws and uncertain market noise Analyzes statistics of maximum profits and calculates possible targets for the next signal Fle

API Reversal Master – The Reversal Detection Indicator for MT4 Spot Reversals with API Reversal Master API Reversal Master is MT4 indicator designed to help traders identify possible market reversals . Whether you're trading forex, stocks, or commodities, this tool provides alerts and visual cues to enhance your decision-making. Key Features: Alerts and Notification – Get notified when a possible reversal point is detected.
Color Changes – Visual indication of possible trend shifts.

Updates
9/12/2023 - If you are looking for the Spock EA, I don't sell it anymore. DM me for more info.
24/10/2023 - Check out my other products. Starting to roll out some EAs & indicators based on this range.
Currently there is no MT5 version. I am using MT4 myself.
So I will spend my time mostly to develop more extensive stats for the Stats version and maybe even an EA. But I might develop a MT5 version.
All depends on the demand. Meaning, the more people request it, the bigger the chan
FREE

Dark Sniper pointer indicator.
Complete absence of redrawing
The percentage of correct indicator forecasts depends on your settings; the default is period 7 (performed better)
The arrow indicates the direction of the next candle and the possible direction of the trend in the future. Suitable for small timeframes m1 and m5 It is recommended to open transactions from 1 to 2 candles. The signal appears on the current candle. Open a trade on the next one since the signal is being generat

This indicator is a professional Trend identifier, it measures the angle or slope of moving averages with different methods. As this indicator calculate angles you can identify the strength of trend by magnitude of angle. It also shows if angle is increasing or decreasing which gives you the opportunity to make more information about current trend. You can combine this indicator with your strategy as a filter or you can use it alone to make your trading system. This is not a repainting indicator
FREE

Informative & optimized Zigzag, Accumulated volume, Price change A rewrite of the traditional zigzag tool with new additions. Features:- Optimized code Displays accumulated volume between peaks Displays price change between peaks Usage:- Identify trend swings Identify high volume swings Compare price changes between swings Drawing Fibonacci tool on strong price change or high volume swings
FREE
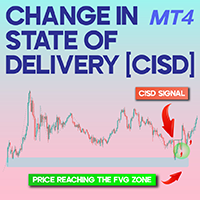
Change in State of Delivery CISD MT4
The Change in State of Delivery (CISD) Indicator is one of the ICT trading tools designed for MetaTrader 4 (MT4) . It assists traders in detecting CISD-level breaks and evaluating trading opportunities based on the signals it provides. «Indicator Installation & User Guide»
MT4 Indicator Installation | Change in State of Delivery CISD MT5 | ALL Products By TradingFinderLab | Best MT4 Indicator: Refined Order Block Indicator for MT4 | Best MT4 Utili
FREE
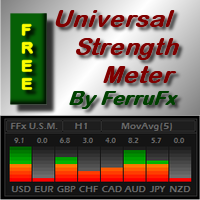
PRO version is available here: https://www.mql5.com/en/market/product/12648 FFx Universal Strength Meter is more than a basic strength meter. Instead of limiting the calculation to price, it can be based on any of the 19 integrated strength modes + 9 timeframes. With the FFx USM, you are able to define any period for any timeframe. For example, you can set the dashboard for the last 10 candles for M15… Full flexibility! Very easy to interpret... It gives a great idea about which currency is weak
FREE
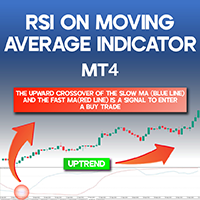
RSI-Based Moving Average Indicator for MT4
One of the widely used methods for trading in alignment with market trends is leveraging Moving Average Crossovers. The RSI-Based Moving Average Indicator enhances this strategy by integrating the Relative Strength Index (RSI) as an additional confirmation tool. This indicator generates buy and sell signals by plotting two oscillating lines that move between 0 and 100, helping traders identify potential trade opportunities. «Indicator Installation & Us
FREE
Unlike a standard moving average, trendy traders unique algorithm will show you a less choppy signal resulting in a smoother and easier trend to follow thereby making your trading decisions more confident. Put simply when price moves above the average it signals a bullish trend and when price moves below the average it signals a bearish trend. The trader is then given 2 levels of take profit and a stop loss on each new signal. It can also be added to other trend-following systems for better per
FREE
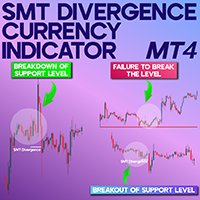
SMT Divergence EU-GU-DXY Indicator MT4 The SMT Divergence EU-GU-DXY Indicator for MetaTrader 4 is a powerful analytical tool designed to detect price divergence among three major Forex pairs. It identifies discrepancies between EUR/USD, GBP/USD, and the U.S. Dollar Index (DXY), highlighting potential trading opportunities through color-coded signals. «Indicator Installation & User Guide»
MT4 Indicator Installation | SMT Divergence Currency Indicator MT5 | ALL Products By TradingFinderLab
FREE

Just another plain Super Trend indicator.
On this one i have added another buffer (on index 2) which can be used on EA; the values is -1 to identify a bearish trend while for bullish trend the value is 1.
Here a code snippet:
int trend = ( int ) iCustom ( NULL , Timeframe, "SuperTrend" , Period , Multiplier, 2 , 1 ); It work on every timeframe.
If you need help to integrate it on your EA, don't hesitate to contact me.
FREE

This Indicator Paints levels which are very ' Adamant ' and strong in nature. These levels act as strong Price rejection levels for a life time and never repaint.
Disclaimer : If you are looking for a Fancy, colorful and eye catchy indicator please stay away.
No trader can become a good trader without considering levels where the price can hold, bounce or break. These levels help traders to enter markets at a cheaper price. They can be Support resistance, demand supply, pivot point, Fibonacci

Two Period RSI compares long-term and short-term RSI lines, and plots a fill between them for improved visualization. Fill is colored differently according to an uptrend (short period RSI above long period RSI) or a downtrend (short period RSI below long period RSI). Short-term RSI crossing long-term RSI adds a more robust trend confirmation signal than using single period RSI alone. This is a small tool to help visualize and confirm RSI trends. We hope you enjoy! Looking for RSI alerts? You can
FREE

[V 1.00] MTF NRPA 5 이동 평균 RTD가 출시되었습니다!
비 다시 그리기 화살표 실시간 대시보드.
최고의 이동 평균 지표를 찾고 있다면 올바른 페이지에 있습니다. 일반적으로 사람들은 두 이동 평균의 교차점(교차)이 다음 가격 추세의 방향을 결정하기 때문에 두 이동 평균을 설정합니다. 빠른 이동 평균이 느린 이동 평균과 교차하고 빠른 > 느린 경우 추세가 상승합니다. 반대로 빠른 이동 평균이 느린 이동 평균과 교차하고 빠른 < 느린 경우 추세가 하락합니다. 두 이동 평균의 단점은 장기적인 추세를 볼 수 없다는 것입니다. 이것이 제가 이 거래 도구를 개발한 이유입니다.
설명 방법은 다음과 같습니다.
이 거래 도구에서는 5개의 이동 평균을 사용합니다. 예, 다섯! 기본적으로 저는 MA 1과 MA 2를 큰 시간 프레임인 H1에 설정했습니다. MA 1과 MA 2의 교차점은 H1 기간에 추세 변화가 있음을 의미합니다. 그런 다음 MA 3 및 MA 4는 현재 시간 프레임(

본 상품은 브로커 서버의 시간대를 기준으로 15개국의 거래 세션을 표시하고 원하는 설정에 따라 다양한 표시 모드를 표시하여 차트 혼잡을 방지하고 사용자가 원하는 시간으로 세션을 설정할 수 있도록 설계되었습니다.
외환 시장에서는 해가 지지 않지만 그 리듬은 각기 다른 거래 세션의 비트에 맞춰 춤을 춥니다. 이러한 세션, 겹치는 부분 및 독특한 분위기를 이해하는 것은 시장에 반대하지 않고 함께 움직이기를 원하는 외환 거래자에게 매우 중요합니다.
Tokyo China London Canada New York Moscow Saudi Arabia ... USDJPY *** *
***
AUDJPY ***
NZDUSD *
***
EURAUD
**
GBPUSD
***
***
EURCHF
***
USDCHF
*
***
GBPJPY *** ***
FREE

The " YK Find Support And Resistance " indicator is a technical analysis tool used to identify key support and resistance levels on a price chart. Its features and functions are as follows:
1. Displays support and resistance levels using arrow lines and colored bands, with resistance in red and support in green.
2. Can be adjusted to calculate and display results from a specified timeframe using the forced_tf variable. If set to 0, it will use the current timeframe of the chart.
3. Uses the
FREE
MetaTrader 마켓은 과거 데이터를 이용한 테스트 및 최적화를 위해 무료 데모 거래 로봇을 다운로드할 수 있는 유일한 스토어입니다.
어플리케이션의 개요와 다른 고객의 리뷰를 읽어보시고 터미널에 바로 다운로드하신 다음 구매 전 트레이딩 로봇을 테스트해보시기 바랍니다. 오직 MetaTrader 마켓에서만 무료로 애플리케이션을 테스트할 수 있습니다.
트레이딩 기회를 놓치고 있어요:
- 무료 트레이딩 앱
- 복사용 8,000 이상의 시그널
- 금융 시장 개척을 위한 경제 뉴스
등록
로그인
계정이 없으시면, 가입하십시오
MQL5.com 웹사이트에 로그인을 하기 위해 쿠키를 허용하십시오.
브라우저에서 필요한 설정을 활성화하시지 않으면, 로그인할 수 없습니다.