Guarda i video tutorial del Market su YouTube
Come acquistare un Robot di Trading o un indicatore
Esegui il tuo EA
hosting virtuale
hosting virtuale
Prova un indicatore/robot di trading prima di acquistarlo
Vuoi guadagnare nel Market?
Come presentare un prodotto per venderlo con successo
Indicatori tecnici gratuiti per MetaTrader 4 - 26

This indicator idea comes from Tushar Chande called Qstick.
Technical indicators quantify trend direction and strength in different ways.
One way is to use the difference between close and open for each bar and to sum it up over a period of time.
The formual is:
Qstick (period ) = Average ((close-open ), period )
In this indicator, we can choose how to calculate body by two famous chart types. The first and default indicator settings are based on Heiken Ashi chart, and the second is based
FREE

Indicator with the function of catching trees should pinbar of all time frames 1. PinBar identification indicator for multi timeframe. 2. Function backtest of PinBar candlestick patterns 3. Announcements on MT4 / MT5 and on mobile phones Please watch my movie on youtube for instructions. S ubscribe my channel for free indicator. https://youtu.be/gIONGgBMqW8
#KIDsEA #indicator #Pinbar #priceaction #mt4 #mt5
FREE

This indicator provides a statistical analysis of price changes (in points) versus time delta (in bars). It calculates a matrix of full statistics about price changes during different time periods, and displays either distribution of returns in points for requested bar delta, or distribution of time deltas in bars for requested return. Please, note, that the indicator values are always a number of times corresponding price change vs bar delta occurred in history. Parameters: HistoryDepth - numbe
FREE

It is a demo version of Advanced Arrow indicator It works only on GBPJPY but the full version works on all currency pairs.
Features Simply it gives you entry point ,SL line and 4 TP lines or less. Once SL-TP lines are shown with the arrow, they remains as they are until signal change. It is historical indicator. No Repaint.
Indicator parameters Indicator Version : choose V5 or V6. TP 1 Line color : TP1 color. TP 2 Line color : TP2 color. TP 3 Line color : TP3 color. TP 4 Line color : TP4 colo
FREE
The Slope is an MT4 indicator that calculates the slope of the price, and draws a histogram so you could see when it's positive, negative, or ranging.
Key Features: Calculates Slope of the Line Chart Shows the numbers as a Histogram below the chart Choose Different Periods for calculating the slope. Sends Alerts and Push Notifications when slope changes direction Settings:
CalculationPeriod: The number of bars used to calculated the slope ( for example, if CalculationPeriod = 10, The Slope w
FREE

This indicator will show week and monthhigh low, very useful to understand the market sentiment. To trade within the range/ break out. Low- can act as support- can used for pull back or break out High- can act as resistance- can used for pull back or break out Breakout strategy refers to the day trading technique that provides traders with multiple opportunities to go either long or short . The main idea is to identify the trend in its most juicy state followed by a trending move.
FREE

The Channel Builder (CB) or Ivanov Bands indicator is a broad generalization of the Bollinger Bands indicator. First, in CB, the mean line <X> is calculated using various averaging algorithms. Secondly, the mean deviations calculated by Kolmogorov averaging are plotted on both sides of the middle line <X>. The middle line <X>, besides the standard SMA, EMA, SMMA and LWMA averaging algorithms, can be Median = (Max + Min) / 2 sliding median (which is the default). In
FREE
Highly configurable Volume indicator.
Features: Highly customizable alert functions (at levels, crosses, direction changes via email, push, sound, popup) Multi timeframe ability Color customization (at levels, crosses, direction changes) Linear interpolation and histogram mode options Works on strategy tester in multi timeframe mode (at weekend without ticks also) Parameters:
Volume Timeframe: You can set the lower/higher timeframes for Volume. Volume Bar Shift: you can set the offset of the l
FREE

L'indicatore Candle GAP è uno strumento essenziale per i trader che utilizzano le strategie di Gap Trading in quanto identifica automaticamente i gap delle candele per ogni giorno della settimana. Un gap si riferisce a una differenza di livello di prezzo tra la chiusura e l'apertura di due giorni consecutivi. Questo indicatore riconosce quattro tipi di modelli di gap: comune, fuga, continuazione ed esaurimento. Incorporando questo indicatore in qualsiasi grafico, i trader possono convali
FREE
Questo indicatore semplifica il processo di creazione dei modelli di grafico, consentendo di salvare le impostazioni correnti del grafico in un modello con un solo clic su un pulsante. L'indicatore aggiunge un pulsante direttamente sul grafico che salva automaticamente il modello con un determinato nome e prefisso, facilitando l'organizzazione e l'utilizzo dei modelli.
Le funzioni principali dell'indicatore sono:
Creazione di un modello del grafico corrente con un solo clic sul pulsante. Poss
FREE
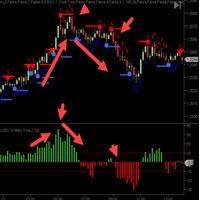
The C ycleTraderPro Close Strength Value Indicator measures the distance from the OPEN of a new bar to the CLOSE of that bar. Input - length = 10 default We add these values together going back the the length setting. If the 1st bar was plus 10 ticks and then the next bar was minus 7 ticks, then this would register +3
There are 2 ways to trade Close Strength Value: 1. Trading in the direction of lower highs and lower lows and vice versa for buys, higher highs, and higher lows. 2. Trade when the
FREE

This indicator calculates directly the value of the dollar index by using the ICE formula to plot the chart, this can help you as reference. You do not need your broker to provide the ICE DX to use this indicator, is a way to have it calculated. Little discrepancies could be found in the exact value of the candles or time due closing time of the trading floor and the use of decimals, but generally will give you good reference. You need your broker offers the feed for the following pairs in orde
FREE

The purpose of this new version of the MT4 standard indicator provided in your platform is to display in a sub-window multiple timeframes of the same indicator. See the example shown in the picture below. But the display isn’t like a simple MTF indicator. This is the real display of the indicator on its timeframe. Here's the options available in the FFx indicator: Select the timeframes to be displayed (M1 to Monthly) Define the width (number of bars) for each timeframe box Alert pop up/sound/ema
FREE

The purpose of this new version of the MT4 standard indicator provided in your platform is to display in a sub-window multiple timeframes of the same indicator. See the example shown in the picture below. But the display isn’t like a simple MTF indicator. This is the real display of the indicator on its timeframe. Here's the options available in the FFx indicator: Select the timeframes to be displayed (M1 to Monthly) Define the width (number of bars) for each timeframe box Alert pop up/sound/ema
FREE
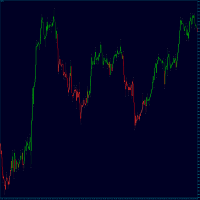
TrendFinder RSI are Colored candlesticks showing the trend based on The Relative Strength Index (RSI) This indicator will give you the color change on the next bar on the confirmation candle and will never repaint TrendFinder RSI is optimize to trade on any market and to be used trending and None trending markets. For best results use this indicator as an extra tools after you have completed your regular analysis and use it for alerts based on such analysis.
FREE

MP Gradient Adaptive RSI oscillator uses AMA with the basic RSI to cover the retracements with minimum lag. Trigger line crossing the oscillator will provide an entry point for trader.
Settings: RSI period: period of the oscillator Sensitivity of the oscillator: controls the sensitivity of the oscillator to retracements, with higher values minimizing the sensitivity to retracements. RSI applied price: source input of the indicator Number of bars to draw: is used when the Fill Type option is no
FREE

This is an implementation of the market cycle indicator described by Raghee Horner in the book "Forex Trading for Maximum Profit" . The current state of the market can be determined by analyzing the inclination angle of the exponential moving average (EMA) running on a period of 34 bars. If the EMA inclination is defined as the direction of the hour hand on the dial from 12 to 2 hours, then an uptrend is considered to be present; from 2 to 4 hours, the market consolidates; from 4 to 6 hours, a d
FREE

Record Session High Trader uses the concepts of within candlesticks trading to gauge when a trend might be wearing out and therefore ready for reversal or pause simply by looking at the candles. We call it a record session high when we get 8 or more previous candles that have higher closes. We call it a record session low when we get 8 or more previous candles that have lower closes. We don't rely on the typical Oscillation Indicators for recognizing overbought or oversold but more we rely on lo
FREE

Индикатор показывает максимальное отклонение от скользящей средней за заданный период. Границы канала могут послужить своего рода зонами перекупленности/перепроданности, от которых может произойти откат цены к центру канала. За этими уровнями и стоит искать дополнительные сигналы для входа в сделку. В настройках индикатора всего 2 параметра - период, за который будет расчитываться индикатор и метод усреднения скользящей средней.
FREE
This indicators when combine with its slave version can help you a better view in backtesting visual mode. https://www.mql5.com/en/market/product/61574 They will help you in developing a multi time frame trading strategy. 1) Run backtest in visual mode 2) Add the master indicator to the backtesting chart 3) Add the slave indicators to other charts of the same symbol with different time frames. Run the backtest and you will see all the charts auto scrolling.
FREE

Hello. Another free indicator from Sepehr! ;) You can determine the trend with this tool. Using crosses of two Moving averages, you can say that the trend is going to be bullish or bearish; A fast-moving average and a slow one. When the fast-moving crosses up the slow-moving, it's going to be an uptrend and when it crosses down the slow-moving, it means that you are going to have a downtrend. That's easy ;) Hope to enjoy it Sepehr(Faran)
FREE

There is a very simple and surprisingly effective indicator called Pi Cycle, which starts to give the first warning. It is worth a look, so as not to miss the giant elephant in the living room!))
What is Pi Cycle?
Pi Cycle is a very simple indicator created by analyst Philip Swift . It takes into account two (DMA biased moving averages ): 350-day average x 2 111-day average Both can be considered long-term indicators. The second one is obviously more sensitive to current market changes, since
FREE
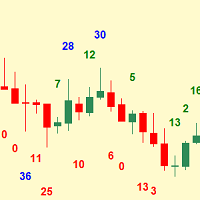
Simplest indicator for bar shadows. Very useful for Kangaroo Tail strategy.
"Shadows" - this is the distance from high and close of the bull bar and low and close of the bear bar. The purpose of the shadow is to show you if the bar is strong or not. Whether it is internal to the trend or is external. It even helps determine if a trend is starting. Input arguments: How many prevoius bars to calculate Value that should be passed to trigger the alarm How many times to repeat the alarm (Put 0 if yo
FREE
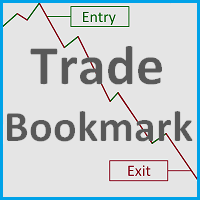
This tool helps you find, revisit and document your past trades by marking the entries and exits using price labels. This indicator is designed to help you analyse your trades to, for example, find strengths and weaknesses of your Expert Advisor/strategy or even help writing your trading diary by clearly showing your past trades that you want to revisit. To only select those trades that were, for example opened by one specific Expert Advisor, you can select the magic number of those trades that
FREE
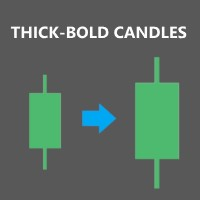
Description: Expand the width of your candles horizontally in MT4 to improve visibility when zooming in or out of the chart. Once attached to the chart, the indicator will automatically double the size of the candles compared to their normal value. Main indicator inputs: Body: size of the candle body Wick: size of the candle wick Additionally, you have the option to change the color of the candle body. We hope you find this free and useful indicator enjoyable!
FREE
This indicator allows to hide Bill Williams Alligator (on all MT4 timeframes) from a date define by the user with a vertical line (Alone) or a panel (with "Hidden Candles"). Indicator Inputs: Jaws Period Jaws Shift Teeth Period Teeth Shift Lips Period Lips Shift Method Apply To Information on "Alligator" indicator is available here: https://www.metatrader4.com/en/trading-platform/help/analytics/tech_indicators/alligator ************************************************************* Hey traders!
FREE

Do you need precision? Tick charts show each change in the ask or bid; The chart updates whenever either price changes. Study the markets more deeply, with surgical precision. Tick Chart Window saves all the received ticks and shows them into a seperate window. Get the best entry price in the Market. trade with precision trade good Spread Register In the comment section you will see the highest spread, the lowest spread and the average spread since the indicator was loaded.
FREE

Channels indicator does not repaint as its based on projecting the falling and raising channels. As a trader you need a path to be able to place your buy and sell trades such as: Supply and Demand , Falling & raising channels. Falling and raising channels can be in any time frame and also can be in all time frames at the same time and the price always flows within these channels. Experienced trades will draw the key levels and channels around the timeframes. But, they will not be able to draw
FREE

The indicator informs when the current bar closes and a new bar opens. TIME is an important element of trading systems. BarTimerPro indicator helps you CONTROL THE TIME . Easy to use: place on the chart and set “alarms” if it necessary. In the tester, the indicator does not work. Key Features
Shows the time elapsed since the opening of the current bar Indicator Updates Every Second Setting the appearance (31-36) and the location (21-24) of the indicator, changing all texts (41-50). 4 types of “
FREE

A classic indicator with advanced features for more accurate display of the market situation. All settings of all moving averages are available, such as the moving average type and the priced used in its calculation. It is also possible to change the appearance of the indicator - line or histogram. Additional parameters provide the ability of fine tuning.
Distinctive features Does not redraw. Additional parameters for fine tuning. Displayed as a line or as a histogram. Works on all timeframes a
FREE

The purpose of this new version of the MT4 standard indicator provided in your platform is to display in a sub-window multiple timeframes of the same indicator. See the example shown in the picture below. But the display isn’t like a simple MTF indicator. This is the real display of the indicator on its timeframe. Here's the options available in the FFx indicator: Select the timeframes to be displayed (M1 to Monthly) Define the width (number of bars) for each timeframe box Alert pop up/sound/ema
FREE

---> Check all the other products <---
The Candle Bias is a coloring indicator that doesn't take account of the close price of the bars.
It will color the candle in the bearish color (of your choice) if the downard range is greater than the upward range. Conversely, it will color the candle in the bullish color of your choice if the upward range is greater than the downward range.
This is a major helper for Multi Time Frame analysis, it works on every security and every Time Frame. You ca
FREE
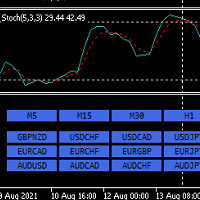
Hello,
This is an easy symbol change panel.
The free version only can change major pairs which are "AUDUSD, EURUSD, GBPUSD, USDCHF, USDCAD, USDJPY, NZDUSD"
The full version can add your symbols.
FULL version here:
https://www.mql5.com/en/market/product/71176?source=Site+Market+MT4+Indicator+New+Rating005
Also, can change the TimeFrame as well.
Symbols must be active on your Market Watch list.
Parameters:
ratio - change the size LineNumber - you can set that how many symbols are displa
FREE
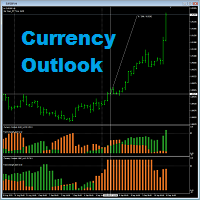
Currency Outlook is an indicator that can help us "Trade the right pair in the right direction and at the right time". This indicator analyzes prices of all cross currency pairs of the selected currency and report the result to us in form of double colours histogram diagram. The maximum height of the histogram diagram of the indicator is 100. The indicator is exclusively programming for AUD, CAD, CHF, EUR, GBP, JPY, NZD and USD. A feature for calculating trade lot size has been added to th
FREE

Indicator is converted from another programming language code by programmer " sbtnc ". MQL version is simplified to be more useful by less settings complexity. There is some clues from programmer about indicator: The indicator tracks and reports the percentage of occurrence of daily tops and bottoms by the time of the day. At certain times during the trading day, the market reverses and marks the high or low of the day. Tops and bottoms are vital when entering a trade, as they will decide if y
FREE

Highly configurable CCI indicator. Features: Highly customizable alert functions (at levels, crosses, direction changes via email, push, sound, popup) Multi timeframe ability Color customization (at levels, crosses, direction changes) Linear interpolation and histogram mode options Works on strategy tester in multi timeframe mode (at weekend without ticks also) Adjustable Levels Parameters:
CCI Timeframe: You can set the current or a higher timeframes for CCI . CCI Bar Shift: you can set
FREE

Free version of https://www.mql5.com/en/market/product/44606 Simple indicator to calculate profit on fibonacci retracement levels with fixed lot size, or calculate lot size on fibonacci levels with fixed profit. Add to chart and move trend line to set the fibonacci retracement levels. Works similar as default fibonacci retracement line study in Metatrader. Inputs Fixed - select what value will be fix, lot or profit (available in full version, lot is set on free version) Fixed value - value t
FREE

Tasso di cambio
In base alla formula, ROC = (Close[n] - Close[n-lookback]) / Close[n-lookback] * 100 per tracciare il tasso di variazione dell'azione del prezzo di una coppia di valute in un periodo di ricerca e fornisce due variabili globali, SYMBOL_ROC e SYMBOL_ROC_LOOKBACK, che rappresentano l'ultimo valore del tasso di variazione e il tasso di variazione nel periodo di ricerca precedente. Invocando l'indicatore utilizzando la funzione iCustom, iCustom ( "Market/RedeeCash_Rate_of_Change.ex4
FREE

Questo indicatore modifica continuamente il colore dei bordi e dei corpi delle candele, nonché il colore dei volumi in tempo reale. L'indicatore è facile da usare. La tavolozza dei colori è varia. Questo prodotto è una soluzione grafica, quindi è difficile descrivere ciò che fa tramite testo, è più facile vederlo scaricandolo, inoltre il prodotto è gratuito. L'indicatore è adatto ai blogger che vogliono creare una bella immagine di un grafico per l'editing video o ai trader che vogliono rendere
FREE

This is Demo Version of PipsFactoryDaily This indicator depends on High and Low price of currency in the last day, and then I made some secret equations to draw 10 lines.
Features You will know what exactly price you should enter the market. You will know when to be out of market. You will know what you should do in market: Buy Sell Take profit, and there are three levels to take your profit Support Resistance Risk to buy Risk to sell
Signal Types and Timeframes Used You can use this indicator
FREE

The indicator shows the difference between Open and Close prices. The indicator in a separate window shows the difference between the Opene price of the current bar with the Close price of the previous bar. The panel in the upper left corner shows the difference between the Open and Close prices of the current bar.
Parameters Count_Bars - number of bars to display the indicator data. If 0, the number is displayed on all available bars; display - enable numerical values; _fontsize - indicator fo
FREE

Marginhedged Information indicator. Lot - set the required lot for calculations, set using the input field MARGININIT - Initial margin requirements for the specified lot MARGINHEDGED - Margin charged from overlapped orders per set lot PERCENT - Margin charged on overlapped orders expressed as a percentage Description of indicator settings: _color - set color An example of using the indicator:
One buy position with lot 1 is open in the market, the margin requirements in this case correspond t
FREE

The indicator displays signals according to the strategy of Bill Williams on the chart. Demo version of the indicator has the same features as the paid, except that it can work only on a demo account .
Signal "First Wise Man" is formed when there is a divergent bar with angulation. Bullish divergent bar - with lower minimum and closing price in the upper half. Bearish divergent bar - higher maximum and the closing price at the bottom half. Angulation is formed when all three lines of Alligator
FREE
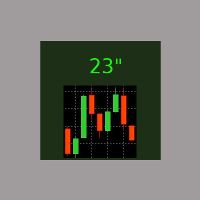
E' il più semplice indicatore esistente. Ha un'unica funzione: segnalare i secondi trascorsi dall'ultimo minuto in modo molto comodo, con un'etichetta spostabile nel grafico, in modo da evitare al trader di allontanare l'occhio dalla candela in formazione. Si usa su M1, ma anche su intervalli maggiori, per chi è interessato ad aprire/chiudere le posizioni nel momento migliore. Talvolta un movimento intenso negli ultimi 10" del minuto dà indicazioni sull'andamento futuro, ed è utilizzabile per s
FREE
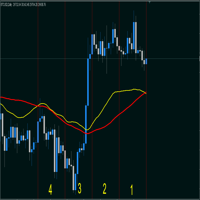
Индикатор суммируеn две средние скользящие, заданные в настройках и умножает на 2. (A + B)/2; Сдвиг на графике - смещает линию на графике.(ВАЖНО! учитывайте сдвиг на графике и сдвиг линии они суммируются, Т.Е. если смешение линий задано 50 и смещение на графике заданно 50 суммарно сдвинется на 100). Метод усреднения и тип цены классические как в средних скользящих. Период - колицество свечей для расчета. По умолчанию индикатор показывает среднею скользящию с периодом 26.
FREE
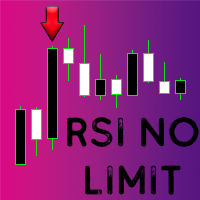
Questo indicatore personalizzato per MetaTrader 4 (MT4) genera segnali di acquisto e vendita basati sulla variazione percentuale dell'RSI (Relative Strength Index) rispetto a un periodo specifico. Ecco come funziona in breve:
1. L'indicatore calcola l'RSI per il periodo specificato (`RSI_Period`) e confronta il valore RSI corrente con quello di un numero di barre precedenti (`Bars_Back`).
2. Calcola la variazione percentuale dell'RSI tra i due periodi.
3. Se la variazione percentuale supera
FREE

The indicator is based on two Moving Averages. Its only difference from traditional indicators is that it is presented as a histogram. The histogram has four colors; each color represents a MA with its own period. In case of a descending trend, if a price is lower than a moving average, the indicator displays a value lower than the red zero level. In case of ascending trend, the indicator value is higher than the green zero level. Parameters: Period MA 1 - Period of the first moving average. MA
FREE

The indicator calculates the average price velocity over the specified time period. It is known that the trading time flows unevenly, in bursts. It either goes faster, or slows down. This indicator will tell if the trading time has accelerated and it is necessary to go to the smaller timeframes to search for trade signals.
Usage Alert is generated when the price velocity exceeds the specified threshold. The threshold value can be modified using the buttons on the information panel. A .wav file
FREE
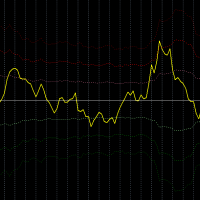
Description:
This indicator measures how far the price is away from Moving Average or multiple Moving Averages (from Lowest MA Period to Highest MA Period). also you can apply weighted factor that increase / decrease from lowest MA to highest MA period.
Inputs:
Lowest MA Period Highest MA Period Weighted factor for Lowest MA Period Weighted factor for Highest MA Period MAs method MAs applied price ATR Period 1st band factor 2nd band factor 3rd band factor indicator Applied price
FREE

Features It is a demo version of All inOne indicator It works only on EURUSD, but the full version works on all currency pairs. All in One indicator is a simple indicator, it makes you know about 8 indicators in all timeframes simultaneously at a single glance. Stochastic RSI Moving Average (MA) Parabolic SAR ADX MACD CCI Last Candle (Candle) In all timeframes (M1, M5, M15, M30, H1, H4, D1, MN) at the same time.
Parameters Stochastic: PercentK : Period of the %K line. PercentD : Period of the %
FREE
Highly configurable Average True Range (ATR) indicator.
Features: Highly customizable alert functions (at levels, crosses, direction changes via email, push, sound, popup) Multi timeframe ability Color customization (at levels, crosses, direction changes) Linear interpolation and histogram mode options Works on strategy tester in multi timeframe mode (at weekend without ticks also) Adjustable Levels Parameters:
ATR Timeframe: You can set the lower/higher timeframes for ATR. ATR Bar Shift: you
FREE

ReviewCandleChart is a unique product that can verify past price fluctuations using candlestick charts. This indicator accurately reproduces market price fluctuations in the past and can make trading decisions (entries, profits, loss cut) many times so that you can learn the trading faster. ReviewCandleCahrt is the best indicator to improve trading skills. ReviewCandleCahrt caters to both beginners and advanced traders.
Advantages of the indicator This Indicator for verifying price fluctuation
FREE

We stopped creatin small tools for MT4. Our focus are on MT5. Only very useful tools maybe we will develop to MT5. New Candle Alert is a simple indicator that notify you when a new candle is formed.
You can modify the notification message that will appear for you. The alarm sound is default by meta trader program.
MT5 version: https://www.mql5.com/pt/market/product/37986
Hope you enjoy it. Any doubt or suggestions please notify on private or by comments.
See ya.
FREE

This is a standard Bollinger Bands indicator. I have added a quick control panel in the bottom left corner for it. When multiple different parameters of this indicator are simultaneously enabled, the control panel can quickly switch between different parameters of the indicator, making it easier to observe multiple indicators simultaneously. For example, it is possible to quickly switch observations while combining a period of 20 and a period of 30. Parameter description: Indicator ID: The uniqu
FREE

With this app you can find the stop out level live or without opening a transaction.
The application consists of 3 boxes, you can enter the amount of money in your Balance box account or it will automatically calculate the current account amount. SELL lot size and BUY lot size can be entered, or trades that are currently open will be calculated automatically. Hedge transactions are calculated automatically.
If you press the S key of the keyboard, you can access the boxes with the values entere
FREE

Slow T3 MA Trend indicator derived from T3 moving averages. This indicator is part of the T3 Cloud MA indicator and is posted here on its own. Buying/Selling opportunities above/below line. The MA line can also be used as dynamic support/resistance for more aggressive entries. Use default values for best settings. The number of look back bars is user defined. This indicator can be used in combination with other strategies such as price action. Suitable for all time frames.
FREE

Lampropeltis is a trend indicator. The algorithm of calculation is based on data from the standard indicators included in the MT4 package and interpretation of patterns formed by these indicators. The settings include a minimum set of parameters: Slow MA - slow MA period; Slow MA method - slow MA smoothing method; Fast MA - fast MA period; Fast MA method - fast MA smoothing method. Change of the signal color to red indicates the possibility of opening a Sell order. Change of the signal color to
FREE
This indicator is a tool to measure the relative strength of different currency pairs. It used a user selected base currency as a comparing standard, and evaluate all other major currencies base on their relative strength/weakness. the stronger one currency compare to the base currency, the higher its value. Base currency has a fix strength value of 50.
Indicator parameters Strength Period - Change the strength period in the settings affects the number of bars used for calculation. The higher t
FREE

Introducing the “Symbol Cost Info MT4” indicator – your ultimate tool for staying ahead in the forex market! This innovative indicator is designed to empower traders with real-time cost information, directly on their charts. Here’s why every trader needs the “Symbol Cost Info MT4” in their arsenal: Real-Time Spread Monitoring : Keep a close eye on the spread for any currency pair, ensuring you enter the market at the most cost-effective times. Pip Value at Your Fingertips : Instantly know t
FREE

SpreadLive shows the full Spread history of a chart with different colors. It alerts you (MT4, E-Mail and Mobile) when the spread reaches the limit, which you can define in the settings. The menu contains Current Spread , Average Spread and Highest Spread of current chart. The main idea is to use it with an EA and analyze negative profits from the spread history. This helps you to see how your broker varies the spread.
Inputs Spread limit - limit to alert. Type - Show in points or pips. Alert:
FREE
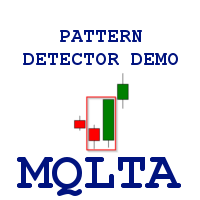
Pattern Detector can detect the most common 1, 2 and 3 candlestick patterns and send notifications when detected. The DEMO version only works on AUDNZD pair. Full product can be found https://www.mql5.com/en/market/product/29190
How does it work Add the indicator to the chart you want to analyze and select which patterns to detect, the indicator will draw the detected patterns. You can also be notified via alert, app and email when a new pattern is detected.
Parameters Indicator Name - Used to
FREE
Binary Options Assistant (BOA) BURN Signals Indicator provides signals based on Ana Trader Binary Options Strategy. Indicators: MACD & Stochastic
Stop missing trades, stop jumping from chart to chart looking for trade set-ups and get all the signals on 1 chart! U se any of the BOA Signals Indicator with the Binary Options Assistant (BOA) Multi Currency Dashboard .
All BOA Signal Indicator settings are adjustable to give you more strategy combinations. The signals can be seen visually and
FREE
Binary Options Assistant (BOA) CHILL Signals Indicator provides signals based on Katie Tutorials Binary Options Strategy. Indicators: 3 Moving Averages & RSI
Use any of the BOA Signals Indicators with the Binary Options Assistant (BOA) Multi Currency Dashboard so you can:
Stop missing trade set-ups Stop jumping from chart to chart looking for trade set-ups Get all the signals on 1 chart All BOA Signal Indicator settings are adjustable to give you more strategy combinations. The signals can b
FREE

Hypothetical trend line display
Distance from the trend line
Can be used in all symbols
Can be used in all time frames
An interesting indicator for predicting small waves
The greater the distance from the trend line, the more likely it is to return to the trend line
Settings:
The first three(osic 1,2,3):
are the same as the settings of the zigzag indicator
The bigger these numbers are, the bigger the trend lines and the longer the trend
Back Show:
The number of candles displayed
Clr1,2:
The
FREE

The indicator still has a few bugs but is ready for testing.
This is my first indicator that determines entry and exit points. The entry point is based on breaking the peaks determined by a channel indicating highs and lows (invisible channels). TP1 is a probable target at which most positions can be closed. The channel determining the opening and closing of positions is based on different assumptions. The red stop loss line is determined based on lows and highs.
The stop loss can be adjusted a
FREE

FusionAlert StochRSI Master is an indicator available for MT4/MT5 platforms, it is a combination of RSI & Stochastic indicator which provide "alerts" when the market is inside "overbought and oversold" regions combined for both indicators, results in more precise and accurate signals to be used as a wonderful tool, in the form of "buy or sell" signals. This indicator comes with many customization options mentioned in the parameter section below, user can customise these parameters as needful. Jo
FREE

!!! In [CodeBase] ho pubblicato il codice indicatore Mql4. Scarica il codice gratuitamente!!! (Devi adattare il codice quando aggiorni il terminale).
Questo indicatore è lo strumento di un trader. Su tutti i periodi e simboli, mostra il movimento degli stocastici М1, М5, М15, М30, Н1, Н4 ogni minuto (la scala temporale da quella attuale a -240 minuti è delle ultime 4 ore).
Step_Stoch elimina la mancanza di stocastico - lag. Ad esempio, il fatto che H1 (o M30) dopo l'aumento ha iniziato a scend
FREE

This is a trend following indicator that identifies optimal entry points in the direction of a trend with an objective stop loss to manage the trade. The indicator allows you to catch trend early and ride it. The Indicator draws resistance line as it detects an Uptrend and draws support line when it detects a Downtrend on the chart. When those levels are broken, that allows you to identify the Trend Direction and Momentum in the direction of prevailing trend which offers optimal entry points in
FREE

Market Dashboard FREE Indicator gives you advanced information’s about your selected Symbols in MarketWatch
Features
Daily Price Movements (M1 – D1) RSI Values with Highlight Function for your current Timeframe & H1 & H4 Profit per Symbol and traded lots (buy & sell) EMA 5 – 100 based on selected period Swap Information (which direction is positive) FIBO Info & Tracking (highlighted FIBO Levels close to current price – based on selected period) One Click ChartOpen this Version is limited to 2
FREE

Hallo!
Ich bin Tatsuron, ein japanischer Privatanleger. Wir verwalten über 1 Milliarde Yen in Forex.
Lassen Sie mich einen sehr nützlichen Indikator vorstellen, den ich verwende.
The indicator that is the basis of the market price. ThreeLine has improved the Moving Average (SMA) to answer the long-term SMA numerical settings. The more you repeat daily trades and verifications, the more credible the Three Line will be. If the angle of ThreeLine is upward, it will be white. If it faces downwar
FREE
Il MetaTrader Market è il posto migliore per vendere robot di trading e indicatori tecnici.
Basta solo sviluppare un'applicazione per la piattaforma MetaTrader con un design accattivante e una buona descrizione. Ti spiegheremo come pubblicare il tuo prodotto sul Market per metterlo a disposizione di milioni di utenti MetaTrader.
Ti stai perdendo delle opportunità di trading:
- App di trading gratuite
- Oltre 8.000 segnali per il copy trading
- Notizie economiche per esplorare i mercati finanziari
Registrazione
Accedi
Se non hai un account, registrati
Consenti l'uso dei cookie per accedere al sito MQL5.com.
Abilita le impostazioni necessarie nel browser, altrimenti non sarà possibile accedere.