Смотри, как быстро заказать торгового робота
Ознакомьтесь с правилами перед работой
Как заказать торгового робота на MQL5 и MQL4
Посмотри пример Технического задания для заказа робота
Новое в категории:
34+ USD
50 - 60 USD
200+ USD
30+ USD
50 - 2500 USD
30 - 75 USD
30 - 50 USD
Работа завершена
Время выполнения 42 дня
Техническое задание
Hi,
I'm seeking an experienced coder with advanced mathematical understanding to let him programm a complex custom indicator that will later be part of the corresponding final EA. Budget is $ 90.00 (only for the indicator) here on mql5.com. Who can do this accurately?Best,
Ben
PS: Here's the description of the requested indicator SupRes_v1:
Concept:
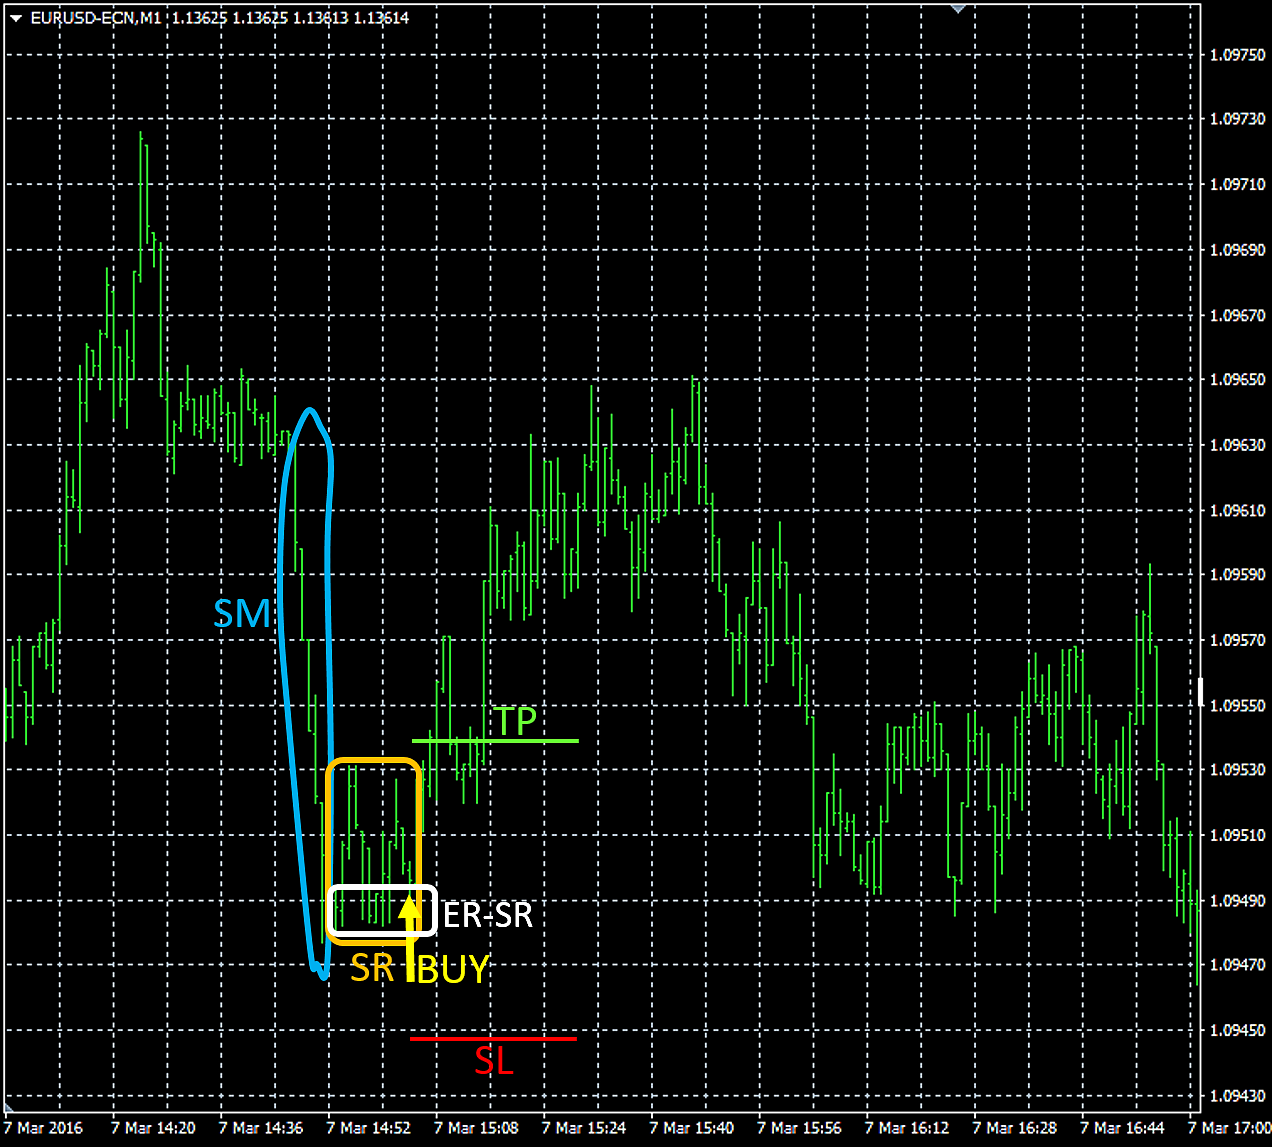
SupRes_v1 detects strong up/down price movements followed by a support/resistance area and draws a down(sell.order) / up(buy.order) arrow contrary to said strong movement. The requested indicator also plots lines for suggested fixed SL/TP levels along with said arrows that symbolize the recommended trading direction.
It is recommended to open the attached image resp. figure in a separate browser tab etc. for a better understanding when reading the detailed description below.
Description in detail:
Stage 1:
The fx chart resp. price makes a strong up(sell.order) / down(buy.order) movement for at least n bars. A strong movement (SM) must be calculated as follows:
SM = [(Difference in points between the highest high and the lowest low of the last n closed bars)/n]/[SUM(length of n bars)]
In the Indis GUI the user must also be able to define the minimum value for SM:
-> Minimum value of SM: 0.55 [etc.]
-> Minimum number n of SM bars: 5 [etc.]
If e.g. SM = 0.60, the strong movements bars overlapping value must be averagely maximum 40 %.
If e.g. SM = 1.00, the strong movement consist of consecutive, averagely non-overlapping bars.
If e.g. SM > 1.00, the strong movements bars MUST have partly gaps between each other.
The indi must permanently scan the charts last n closed bars and recognize if all conditions for a valid SM are fulfilled.
Once a SM is detected the indi must note the value resp. price of SMs lowest low and highest high and their positions (time/date). From then on the indi must continually check resp. recalculate if the movement stays strong (definition see above) when including the follow-up bars n+1, n+2, n+3, , n+x (instead of calculating only with n) and ONLY IN THIS CASE update the values/dates for SMs lowest low and highest high (see above).
Furthermore a potential SM(n) resp. SM(n+x) must be ignored by the indi if it exceeds maximum points of distance SM or undercuts minimum points of distance SM, whereby distance = difference between the highest high and the lowest low of all SM valid closed bars (n+x):
-> Maximum points of distance SM: 300 [etc. (if TF = M1)]
-> Minimum points of distance SM: 70 [etc. (if TF = M1)]
Stage 2:
The strong movement slows down. This means that the Minimum value for SMs n bars: 0.55 [etc.] is undercut by the currently closed n+x+1 bar e.g. SMs calculated current actual value shrinks from >0.55 to 0.54 or 0.43 etc. In this case the indi must make the final notation of SMs lowest low / highest high (see above) BUT EXCLUDING the last closed bar that caused the end of SM!
Now the bars of SM consist of the initial bar (IB) followed by n-1 bars + x bars that let the movement stay strong (x can also be 0!) including the final SM bar (FB), before SM is terminated by the terminating bar (TB) which already belongs to the support/resistance area (SR), see below.
Stage 3:
The strong movement (SM) is per definition followed by a support/resistance area (SR). Now the indi must check if at least the next k closed bars within SR starting with TB (see above) are fulfilling the following conditions:
1.) The difference of SRs k bars highest high and lowest low must be a maximum percentage (SR-MP) in relation to SM:
-> Maximum value for SR-MP: 0.35 [etc.]
-> Minimum number k of SR bars: 5 [etc.]
If e.g. SR-MP = 0.35, the k bars in the support/resistance area (SR) are all swinging within a range of maximum 35 % in relation to the strong movements (SM) distance [calculated according to Stage 1).
2.) At least e bars of the k closed bars (within SR, see above) have a high(sell.order) / low(buy.order) that is close to the highest.high(sell.order) / lowest.low(buy.order) of SM-SR, whereby SM-SR includes ALL closed bars starting with IB (initial bar of SM) and ending with the last closed CURRENT bar. Said e bars upper/bottom extrema [high(sell.order) / low(buy.order)] must be in a specified range [in points]; for example 2 bars out of 5 within SR are close to each other AND close to said extremum of SM-SR:
-> Maximum range of SRs e bars: 10 [etc.]
-> Minimum number e of SR bars with similar extrema: 2 [etc.]
If Minimum number e of SR bars with similar extrema = 0, there MUST NOT be any couple/triplet etc. of bars with similar extrema but CAN BE.
3.) At least the l last closed bars of k are lower(sell.order) / higher(buy.order) OR EQUAL to the corresponding extremum of SM-SR:
-> Minimum number l of SRs last bars with lower/higher extremum: 2 [etc.]
If Minimum number l of SRs last bars with lower/higher extremum = 0, the last closed bars within k have no further restriction at this point.
NOTE:
If not all conditions of Stage 3 are fulfilled at the close of bar k, the indi must continually check resp. recalculate them with bars k+1 (instead of k), then k+2 (instead of k+1), then k+3 (instead of k+2), and so on. This process will end if
a) all conditions are fulfilled
or
b) Maximum value for SR-MP is exceeded by the currently processed bar.
If b) occurs the indi must go back to resp. start again with Stage 1.
If a) occurs the indi must proceed with Stage 4 (see below).
Stage 4:
If all conditions of Stage 3 are fulfilled the indi must wait until the current price reaches the end region of SR = ER-SR. The ER-SR is per definition located in the upper(sell.order) / bottom(buy.order) area of SR and finally ending with the SRs highest.high(sell.order) / lowest.low(buy.order). ER-SR must be set in the GUI by the user as a percentage of the distance between the highest high and the lowest low of SR:
-> ER-SRs percentage for entry price level: 0.25 [etc.]
In this case the current price must reach the top(sell.order) / bottom(buy.order) 25% of SR to fulfill this condition.
If said value is set to e.g. 1.25 (= 125%) the current price must exceed(sell.order) / undercut(buy.order) SRs highest.high(sell.order) / lowest.low(buy.order) with a distance of at least 25% SR, whereby distance of SR = highest.high - lowest.low of the current/actual SR in points.
This means that all values above 1.00 result in an price must exceed(sell.order) / undercut(buy.order) a special price level that lies OUTSIDE SR. This calculation is NOT the same as for values between 0.00 and 1.00, because the latter values result in an price must reach specific area.
NOTE:
Its very important that all follow-up bars after Stage 3 resp. while Stage 4 must apart from that ALSO be in the range of Maximum value for SR-MP [see Stage 3: 1.)], even the currently processed (not closed) bar!
As soon as a (current) follow-up bar of Stage 4 exceeds Maximum value for SR-MP before reaching ER-SR (see above) the indi must go back resp. start again with Stage 1.
Stage 5:
If all conditions of Stage 4 are fulfilled the indi must draw a colored down(sell.order) / up(buy.order) arrow above/below the current price reaching ER-SR (see above):
-> Color of the up/buy arrow: yellow [etc.]
-> Color of the down/sell arrow: yellow [etc.]
Furthermore the indi must calculate and draw suggested fixed SL/TP levels (horizontal thin and dotted lines with a length of 20 bars):
-> Color of the fixed SL line: red [etc.]
-> Color of the fixed TP line: lime [etc.]
The value resp. price level of SL/TP must be calculated as follows:
A user defined percentage of the difference highest.high and lowest.low of the whole movement IB->ArrowBar is converted to points and
for SL added(sell.order) to / subtracted(buy.order) from the arrows price level
resp.
for TP subtracted(sell.order) from / added(buy.order) to the arrows price level:
-> SM-SRs percentage for calculating SL buy: 0.35 [etc.]
-> SM-SRs percentage for calculating TP buy: 0.25 [etc.]
-> SM-SRs percentage for calculating SL sell: 0.40 [etc.]
-> SM-SRs percentage for calculating TP sell: 0.20 [etc.]
Furthermore the final SL/TP levels must ALWAYS be expanded by a user set spread (in points) that best represents the brokers average:
-> Spread added to expand TP/SL: 12 [etc.]
Stage 6:
After an arrow and its corresponding TP/SL lines were drawn by the indi the latter must pause all further calculations for the current signal triggering bar AND for r (recess) follow-up bars. After r bars it starts again with Stage 1:
-> Number of recess bars after signal: 10 [etc.]
NOTE: The indi must be 100 % non-repaint and every arrow resp. TP/SL line will stay forever!
Extra filter:
If enabled, all potential sell/buy signals will be skipped if not at least b bars BEFORE SM have a lower.high(sell.order) / higher.low(buy.order) than the highest.high(sell.order) / lowest.low(buy.order) of SM-SR with at least p points difference:
-> Enable extra filter: true/false
-> Minimum number of lower/higher bars b before SM: 100 [etc.]
-> Minimum points of lower/higher bars before SM: 120 [etc.]
!! Please optimize the indicator for the lowest possible CPU usage thx !!
Откликнулись
1
Оценка
Проекты
149
36%
Арбитраж
29
3%
/
55%
Просрочено
35
23%
Свободен
2
Оценка
Проекты
120
34%
Арбитраж
17
18%
/
41%
Просрочено
51
43%
Свободен
3
Оценка
Проекты
395
28%
Арбитраж
69
19%
/
49%
Просрочено
120
30%
Свободен
4
Оценка
Проекты
301
30%
Арбитраж
54
24%
/
56%
Просрочено
98
33%
Свободен
Похожие заказы
Pomoc dla deweloperów z Polski
40+ USD
Prosze o kontakt tylko osób mówiące po polsku. Potrzebuję pomocy z .skax̌nikiem w Tradingview skompilowane znikim Tylko dla osób mówiących po Polsku. Wskalnik obsługuje insidebary i fakinsidbar oraz daje alarmy przekazywane do Metatrader 5
I am new in trading and would a programmer to create an indicator for me with these specific instructions. 1. Trading Logic Supertrend Indicator: Inputs: ATR Period, ATR Multiplier, Timeframe. Signal is generated when the Supertrend line flips direction. Buy Condition: When price closes above the Supertrend line and the Supertrend flips from bearish (above price) to bullish (below price). EA opens a Buy order. Sell
We are teaching beginners how to trade on ThinkorSwim. We’d like to create 5 scripts, beginning with a chart with one indicator and then adding additional indictors with each chart. The first chart (Level 1) has just 9 day Exponential Moving Average & 20 day Exponential Moving Average and Previous day High, Low, & Close. Level II will have the same indicators as Level I plus Price Candles. Level III has Level II
🟢 MQL5 Tester & Analyst — EA XAUUSD
35 - 40 USD
I am looking for an expert in backtesting and optimization for MQL5 / MetaTrader 5 to evaluate my Expert Advisor (Complete Corrections + Cleanup). 📌 Objective : Validate the robustness, stability, and structural consistency of the strategy under real market conditions (XAU/USD M15, 2023–2024 - 2025 period). ⚙️ Deliverables ✅ Complete performance report : Profit factor, Drawdown, Sharpe, Z-Score, Recovery Factor
I'm looking for extra upgrade of existing, extremely complex MT4's EA of significant size with many different features. 99%+ of those features I will not be even talking about, unless you ask me for them. One of the feature that I have to mention is that the EA is working on two different EX4 sides. Source terminal side (Source EX4) and Target terminal side (Target EX4) within exact channel id number and this feature
Project Description: I am looking for an experienced developer to build a breakout box trading algorithm designed for futures trading , specifically for the 6J (Japanese Yen) contract. The system must be built with prop firm trading rules in mind (fixed risk, limited drawdown, no overnight exposure) and structured for Tradovate-style workflow — clean session logic, pending breakout orders, and strict time-based trade
Conversion of Limit Order EA(MT4 to MT5)
30 - 100 USD
Hi, Good morning: Thanks for looking at my requirement: The objective of the EA is to do some updates in the Main EA (limit order) I have an EA, which places limit order, by reading a text file in the specified folder. Limit Order EA: The EA reads: AUDJPY, BUY, 100.52244, 100.34927, 09/10/2025, 05:45, 09/10/2025, 06:45, 0.17318, 100.91209, 0.09, 100.65232 PAIR, DIRECTION, LIMIT PRICE, SL PRICE, START DATE, START
CRT strategy
35+ USD
I already have some part of the code, i only need developer who knows what hes doing and have experience in similar job to update my code and make it work better and accurately bellow is what i want to be updated on the code HTF swing OB/BB plot correctly in LTF using hybrid method and plot only in external swing point that caused a BOS/CHOC plot HTF FVG correctly on LTF in real time with OB/BB and FVG not plotting
Hello Developers, This is buy side/sell side order for an EA that consist of 3 common indicators with 4 conditions to trigger a buy or sell with added stop loss and take profit. Please send your qualifications for a decision tomorrow. Thanks
I need an experienced MT5 developer to perform full optimization and backtesting for an existing Expert Advisor. The goal is to identify the best-performing parameter sets for consistent profitability and low drawdown. Please provide: Experience with MT5 Strategy Tester Sample optimization or backtest reports Estimated completion time Deliverables: optimized .set files and performance summary report
Информация о проекте
Бюджет
40 - 90 USD
VAT (19%):
7.6
- 17.1
USD
Итого:
47.6
- 107.1
USD
Исполнителю
36
- 81
USD
Сроки выполнения
от 1 до 4 дн.